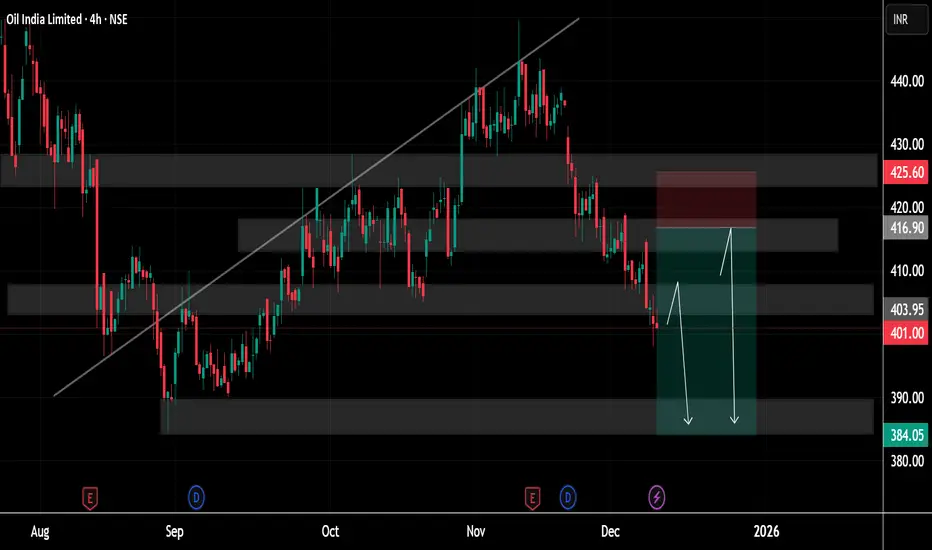
OIL INDIA BUY ON DIP WITH triangle support lineAs per my personal analysis OIL INDIA can be buy on dip.
Oil India Ltd is a Maharatna public sector oil & gas company engaged in upstream exploration, development, production and associated midstream activities.
• Current price range ~₹430–440 per share.
• 52-week range roughly ₹325–492, showing vo
Next report date
—
Report period
—
EPS estimate
—
Revenue estimate
—
36.75 INR
65.51 B INR
317.03 B INR
543.90 M
About Oil India Limited
Sector
Industry
CEO
Ranjit Rath
Website
Headquarters
Noida
Founded
1959
IPO date
Sep 30, 2009
Identifiers
2
ISIN INE274J01014
Oil India Ltd. is an investment holding company, which engages in the business of exploration, development and production of crude oil and natural gas, transportation of crude oil and production of LPG. It operates through the following segments: Crude Oil, Natural Gas, Liquefied Petroleum Gas, Pipeline Transportation, Renewable Energy, and Others. The company was founded on February 18, 1959 and is headquartered in Noida, India.
Related stocks

Long Trade Setup – Oil India Ltd Bias: Long from confluence zone
Price is retracing into a strong demand zone that aligns with both the 21 EMA and 50 EMA, creating a confluence setup ideal for a long entry. The pivot level at 431.38 acts as a structural magnet, and a clean break above it could accelerate momentum toward higher targ

Yesterday’s idea played out well.
Trade Update | Follow-up
Yesterday’s idea played out well. Breakout-Confirmed-Strength-with-Caution/
The stock delivered ~6% upside in today’s morning session 📈
Stock: OIL INDIA LIMITED
The move came exactly the way the structure suggested —
✔ Strong breakout
✔ Volume expansion
✔ Momentum foll

OIL INDIA – Upside Setup Building🟦 OIL INDIA – Upside Setup Building with Global Support
Oil India is showing positive structure, supported by rising crude prices and improving global cues.
📊 Technical View
• Sustaining above 38.2% Fibonacci retracement
• Contraction pattern formed → often precedes breakout
• Momentum supportive,

65% Upside potentialStock has been moving sideways for over a year.
Volume is now picking up along with a bullish crossover in key moving averages.
This NIFTY 50 stock underperformed during the previous NIFTY rally.
Structure now indicates it may start supporting NIFTY in the upcoming move.
A strong support zone is pl

Crude Oil Price Update Clean and clear ExplanationCrude Oil trading in a clear downtrend over the past few weeks. The price is moving inside a descending channel, which means sellers are in control and each rally is getting sold near lower highs.
Technically Price trend is bearish as price keeps making lower highs and lower lows the grey sloping

Crude Oil Price Update – Clean & Clear ExplanationCrude Oil highlighting how the market has shifted from a previously rising trend into a phase of weakness. Earlier, the price followed an upward sloping trendline, reflecting steady buying strength, but eventually the price broke below that trendline, signalling the start of a broader correction. Si
OIL INDIA BUY VIEW OIL INDIA - BUY PROJECTION
Trade Setup :
Fundamental Analysis
Stock PE - 9.22
Industry PE - 20.7
Low Debt
Promoter Holding - 53 %
DII Holdings - 17 %
Regularly Paid Dividend - 2 %
Strong Fundamental - Stock Possible to Doubled - (Current - 474 ) (Target - 948 )
for Long term 5 years Hold

OIL LONG_Support @ 20/50/ 200 Daily EMAOIL Long:
- Price takes support at 20/50/ 200 Daily EMA
- Forms Higher low & movement shows good Volume
- Enter Long when the prices are favorable in the lower timeframe
- Target: 485
- SL: Close below 20 Daily EMA or today's low

OIL Range Breakout with Strong Volume Confirmation Timeframe: Daily (1D)
📌 Chart Observed: Appears to be a stock forming higher lows after a strong recovery from
bottom.
🔍 Pattern Noticed:
• Price breakout above 200 EMA – typically a strong trend reversal signal.
• Today’s candle shows a bullish engulfing move with a volume spike, indicat

See all ideas
Summarizing what the indicators are suggesting.
Neutral
SellBuy
Strong sellStrong buy
Strong sellSellNeutralBuyStrong buy
Neutral
SellBuy
Strong sellStrong buy
Strong sellSellNeutralBuyStrong buy
Neutral
SellBuy
Strong sellStrong buy
Strong sellSellNeutralBuyStrong buy
An aggregate view of professional's ratings.
Neutral
SellBuy
Strong sellStrong buy
Strong sellSellNeutralBuyStrong buy
Neutral
SellBuy
Strong sellStrong buy
Strong sellSellNeutralBuyStrong buy
Neutral
SellBuy
Strong sellStrong buy
Strong sellSellNeutralBuyStrong buy
Displays a symbol's price movements over previous years to identify recurring trends.
O
OILI4503388
Oil India International Pte Ltd. 4.0% 21-APR-2027Yield to maturity
4.37%
Maturity date
Apr 21, 2027
N
734NRL35.N0
Numaligarh Refinery Limited 7.34% 23-SEP-2035Yield to maturity
—
Maturity date
Sep 23, 2035
See all OIL bonds
EEDM
iShares IV PLC - iShares MSCI EM CTB Enhanced ESG UCITS ETF Unhedged USDWeight
0.07%
Market value
7.01 M
USD
EDM2
iShares IV PLC - iShares MSCI EM CTB Enhanced ESG UCITS ETF Accum Shs Unhedged USDWeight
0.07%
Market value
7.01 M
USD
Explore more ETFs
Frequently Asked Questions
The current price of OIL is 504.95 INR — it has increased by 4.94% in the past 24 hours. Watch Oil India Limited stock price performance more closely on the chart.
Depending on the exchange, the stock ticker may vary. For instance, on NSE exchange Oil India Limited stocks are traded under the ticker OIL.
OIL stock has risen by 17.79% compared to the previous week, the month change is a 26.10% rise, over the last year Oil India Limited has showed a 23.76% increase.
We've gathered analysts' opinions on Oil India Limited future price: according to them, OIL price has a max estimate of 600.00 INR and a min estimate of 390.00 INR. Watch OIL chart and read a more detailed Oil India Limited stock forecast: see what analysts think of Oil India Limited and suggest that you do with its stocks.
OIL stock is 3.53% volatile and has beta coefficient of 1.00. Track Oil India Limited stock price on the chart and check out the list of the most volatile stocks — is Oil India Limited there?
Today Oil India Limited has the market capitalization of 797.85 B, it has increased by 3.51% over the last week.
Yes, you can track Oil India Limited financials in yearly and quarterly reports right on TradingView.
Oil India Limited is going to release the next earnings report on Feb 6, 2026. Keep track of upcoming events with our Earnings Calendar.
OIL earnings for the last quarter are 6.42 INR per share, whereas the estimation was 11.18 INR resulting in a −42.58% surprise. The estimated earnings for the next quarter are 7.83 INR per share. See more details about Oil India Limited earnings.
Oil India Limited revenue for the last quarter amounts to 54.57 B INR, despite the estimated figure of 52.80 B INR. In the next quarter, revenue is expected to reach 51.31 B INR.
OIL net income for the last quarter is 14.29 B INR, while the quarter before that showed 18.96 B INR of net income which accounts for −24.66% change. Track more Oil India Limited financial stats to get the full picture.
Oil India Limited dividend yield was 2.98% in 2024, and payout ratio reached 28.55%. The year before the numbers were 2.62% and 26.96% correspondingly. See high-dividend stocks and find more opportunities for your portfolio.
As of Jan 30, 2026, the company has 6.41 K employees. See our rating of the largest employees — is Oil India Limited on this list?
EBITDA measures a company's operating performance, its growth signifies an improvement in the efficiency of a company. Oil India Limited EBITDA is 101.93 B INR, and current EBITDA margin is 38.87%. See more stats in Oil India Limited financial statements.
Like other stocks, OIL shares are traded on stock exchanges, e.g. Nasdaq, Nyse, Euronext, and the easiest way to buy them is through an online stock broker. To do this, you need to open an account and follow a broker's procedures, then start trading. You can trade Oil India Limited stock right from TradingView charts — choose your broker and connect to your account.
Investing in stocks requires a comprehensive research: you should carefully study all the available data, e.g. company's financials, related news, and its technical analysis. So Oil India Limited technincal analysis shows the buy rating today, and its 1 week rating is strong buy. Since market conditions are prone to changes, it's worth looking a bit further into the future — according to the 1 month rating Oil India Limited stock shows the buy signal. See more of Oil India Limited technicals for a more comprehensive analysis.
If you're still not sure, try looking for inspiration in our curated watchlists.
If you're still not sure, try looking for inspiration in our curated watchlists.