TradeCity Pro | Ethereum Consolidates in Descending Triangle👋 Welcome to TradeCity Pro!
In this analysis I want to review Ethereum for you. Ethereum is by far the most popular altcoin in the market and with a market cap of 520 billion dollars it is ranked 2nd on CoinMarketCap.
⏳ 4-Hour Timeframe
After the bullish leg that started from the bottom of 3380, Et

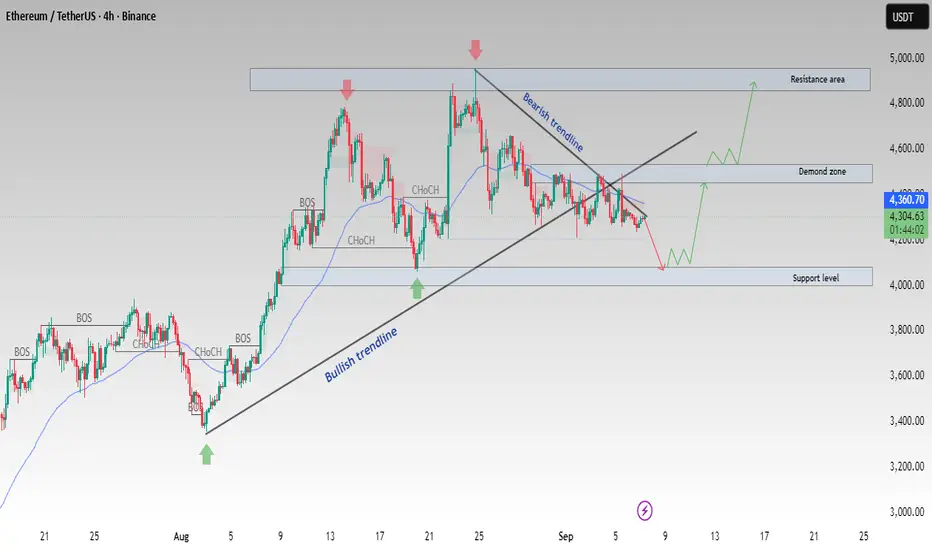
ETH/USDT at Key Demand Zone–Bullish Reversal or Deeper Pullback?Ethereum (ETH/USDT) on the 4H timeframe is trading near a critical demand zone after pulling back from resistance.
Key technical notes:
Bullish trendline supported recent upward moves
Bearish trendline currently limiting upside momentum
Price is consolidating between demand zone (4,200 – 4,300)
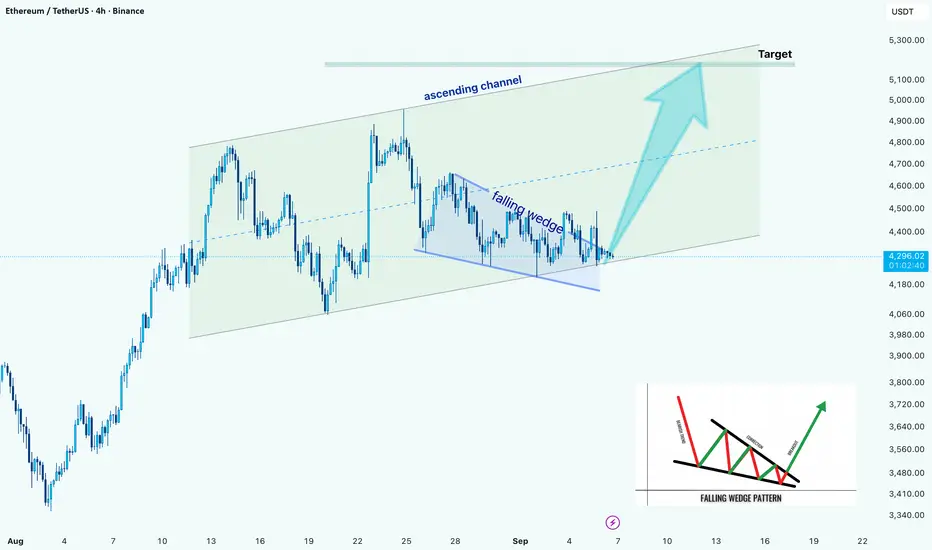
ETH/USD –> Falling Wedge Breakout Within Ascending ChannelHello guys!
Ethereum is showing a strong technical setup on the 4H chart. Price has been respecting an ascending channel since early August, and within this structure, a falling wedge has recently formed.
Right now, ETH is testing the wedge breakout point near the bottom line of the channel. If bu
ETH/USDT | Hits $4950 ATH After 130% Rally – More Gains Ahead?By analyzing the Ethereum (ETH) chart on the weekly timeframe, we can see that, as expected, price has continued its bullish rally since our last analysis — successfully hitting all three targets at $4000, $4400, and $4900. With a remarkable 130% growth in just 77 days, Ethereum finally printed a ne

ETH at a Crossroads: Bounce or Breakdown?ETH at a Crossroads: Bounce or Breakdown?
ETH hit our first target at 4335 and bounced back over the weekend.
Right now, it's testing a strong resistance zone—the same area that caused a drop before. If this zone holds, ETH could start another bearish wave (as shown in the black scenario), but th

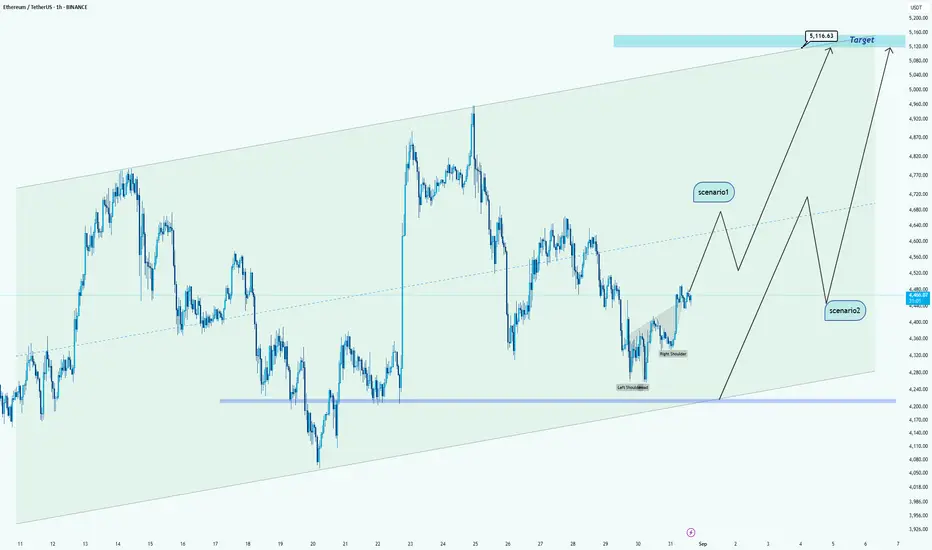
ETH/USDT Analysis -> towards upper levelsHello guys!
Currently, Ethereum is trading inside a clear ascending channel and has just formed a potential inverse head & shoulders pattern near the channel’s support. This setup gives us two possible scenarios:
🔹 Scenario 1:
If ETH continues its bullish momentum and breaks above the mid-line of
Lingrid | ETHUSDT Bullish Momentum Following Trendline BreakoutBINANCE:ETHUSDT is approaching the $4,200 support zone and forming a higher low structure. The chart shows a falling wedge pattern breaking against the downward trendline, indicating potential bullish reversal. If price holds above $4,200 and confirms breakout, continuation toward $4,600 becomes li

ETHERUM New Analysis | Be Careful (4H)This analysis is an update of the analysis you see in the "Related publications" section
Considering the lack of price penetration and the formation of higher highs at the first supply zone, Ethereum may have already started its drop without a recovery and could move from the current area toward th

Possible ETHUSDT Insane BUYThe 3rd Touch on the Bearish Counter Trendline has happened. Now, we wait for the 3rd Touch on the Bullish Main Trendline.

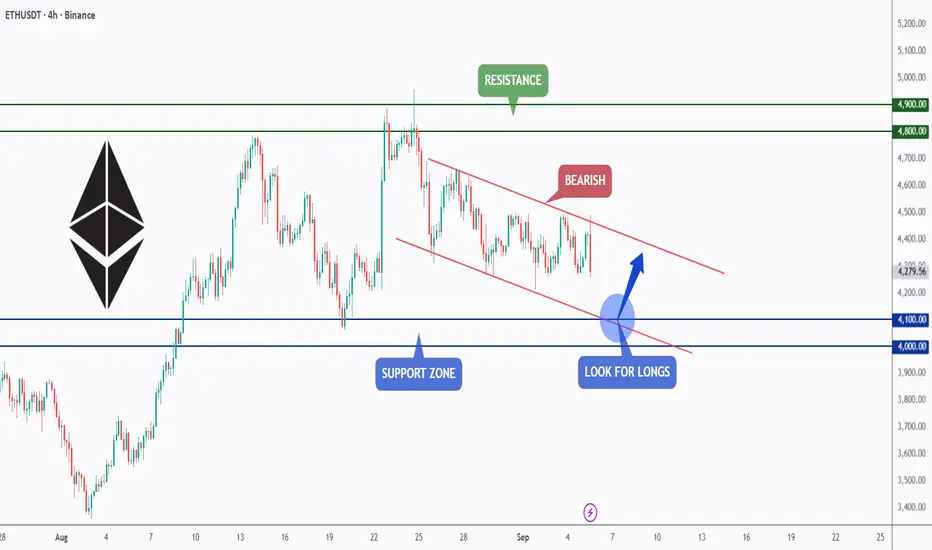
ETH – Watching the Falling Channel!Ethereum is currently trading within a falling channel on the 4H timeframe, showing short-term bearish pressure.
Price is approaching the support zone around the $4,000–$4,100 area, which also aligns with the lower boundary of the channel.
As long as this zone holds, it could act as a springboard
See all ideas
Summarizing what the indicators are suggesting.
Oscillators
Neutral
SellBuy
Strong sellStrong buy
Strong sellSellNeutralBuyStrong buy
Oscillators
Neutral
SellBuy
Strong sellStrong buy
Strong sellSellNeutralBuyStrong buy
Summary
Neutral
SellBuy
Strong sellStrong buy
Strong sellSellNeutralBuyStrong buy
Summary
Neutral
SellBuy
Strong sellStrong buy
Strong sellSellNeutralBuyStrong buy
Summary
Neutral
SellBuy
Strong sellStrong buy
Strong sellSellNeutralBuyStrong buy
Moving Averages
Neutral
SellBuy
Strong sellStrong buy
Strong sellSellNeutralBuyStrong buy
Moving Averages
Neutral
SellBuy
Strong sellStrong buy
Strong sellSellNeutralBuyStrong buy
Displays a symbol's price movements over previous years to identify recurring trends.