DAX, Weak StillDespite the huge recovery in US indices over the past few days, DAX continued to be weak and even made new lows yesterday. Could see further downside to 23700-800 or so, confluence of supports before a strong bounce.
Of course, a lot depends on how US indices perform today. SPX need to hold at current 6730 level, NDX 24980 and come down for this plan to work out.
Trade ideas

24639 ?This channel is not providing individualized trading or investment advice, nor is it a banking service, brokerage service, trading service, investment service or money management service

DAX into the open.Tuesday 21st OctoberThat looks to be the pattern we are trading.Uneless that resitance gets blown out.Lets see what happens
Technical Analysis WeeklyGermany 40 has re-entered its trading range after a failed bullish breakout. Price trades at 24,057, slightly below its VWAP of 24,206. RSI at 48.4 suggests subdued momentum. Support lies at 23,683, while resistance is 24,729.
UK 100 maintains a bullish trend but is undergoing a corrective phase. Price has pulled back to 9,394, below its VWAP of 9,403. The RSI at 51.4 indicates weak bullish momentum. Support is at 9,287, and resistance stands at 9,558.
Wall Street remains in a bullish trend but continues to correct lower, currently at 46,303, on top of its VWAP. RSI at 52.6 shows a neutral stance. Support lies at 45,630, and resistance is estimated at 46,911.
Brent Crude is turning bearish within its broader range. Price has fallen to 6,094, below the VWAP of 6,422. RSI at 30.9 indicates strongly bearish momentum. Support sits at 5,983, while resistance is at 6,860.
Gold extends its bullish run in a strong impulsive phase, trading at 4,259, significantly above the VWAP of 4,015 but down a bit from all time highs. The RSI at 75.5 signals less overbought conditions. Support is way down at 3,677, and resistance is at 4,353.
EUR/USD holds its trading range, now trading at 1.1666, right next to its VWAP. RSI at 49.0 signals neutral momentum. Support is at 1.1556, and resistance is at 1.1782.
GBP/USD stays in a bullish trend but is correcting sideways, trading at 1.3423, slightly above the VWAP of 1.3400. RSI at 49.8 shows consolidation. Support is at 1.3299, with resistance at 1.3514.
USD/JPY is in a pullback following its bullish range-breakout, currently at 150.67, just above its VWAP of 150.30. The RSI at 54.2 reflects moderate bullish momentum. Support lies at 146.60, and resistance is at 154.01.
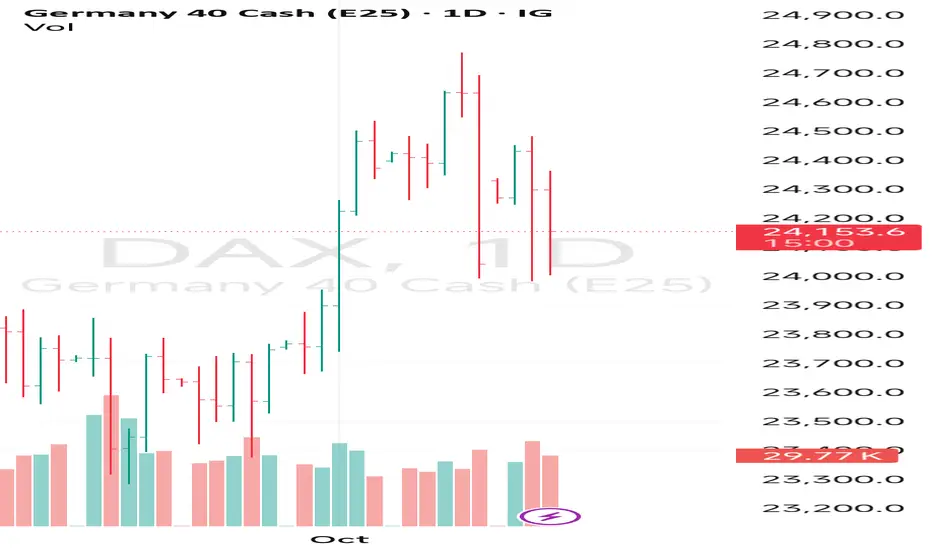
Sell Germany 40 Index#Dax broke 24185 support levels on the daily chart.
The short term trend is down.

GER40 Review October 14 2025Short-term price movement ideas.
The price has completed a monthly liquidity grab, after which we received confirmation on the weekly chart — forming the conditions for a downward move, at least toward the weekly long FVG.
At the moment, price has tested the daily short FVG, from which a potential 4H structure break and new FVG are forming. If this break occurs, the next step would be to wait for the 4H area of interest; upon confirmation, short positions could be opened with the target of taking out the previous low.
Be flexible, adapt to the market, and the results will come quickly. Good luck to everyone.

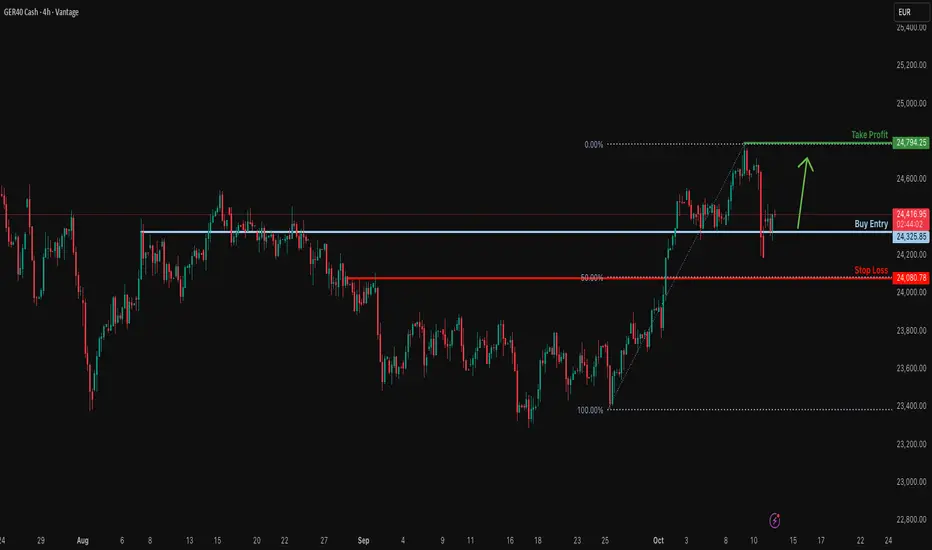
Bullish continuation setup?GER40 has bounced off the support level, which is an overlap support and could potentially rise from this level to our take profit.
Entry: 24,325.85
Why we like it:
There is an overlap support level.
Stop loss: 24,080.78
Why we like it:
There is a pullback support that lines up with the 50% Fibonacci retracement.
Take profit: 24,794.25
Why we like it:
There is a swing high resistance level.
Enjoying your TradingView experience? Review us!
Please be advised that the information presented on TradingView is provided to Vantage (‘Vantage Global Limited’, ‘we’) by a third-party provider (‘Everest Fortune Group’). Please be reminded that you are solely responsible for the trading decisions on your account. There is a very high degree of risk involved in trading. Any information and/or content is intended entirely for research, educational and informational purposes only and does not constitute investment or consultation advice or investment strategy. The information is not tailored to the investment needs of any specific person and therefore does not involve a consideration of any of the investment objectives, financial situation or needs of any viewer that may receive it. Kindly also note that past performance is not a reliable indicator of future results. Actual results may differ materially from those anticipated in forward-looking or past performance statements. We assume no liability as to the accuracy or completeness of any of the information and/or content provided herein and the Company cannot be held responsible for any omission, mistake nor for any loss or damage including without limitation to any loss of profit which may arise from reliance on any information supplied by Everest Fortune Group.
DAX overbought pullback supported at 23970The DAX remains in a bullish trend, with recent price action indicating a potential overbought pullback within the broader uptrend.
Support Zone: 23970 – a key level from previous consolidation. Price is currently testing or approaching this level.
A bullish rebound from 23970 would confirm ongoing upside momentum, with potential targets at:
24490 – initial resistance
24580 – psychological and structural level
24770 – extended resistance on the longer-term chart
Bearish Scenario:
A confirmed break and daily close below 23970 would weaken the bullish outlook and suggest deeper downside risk toward:
23870 – minor support
23770 – stronger support and potential demand zone
Outlook:
Bullish bias remains intact while the Dax40 holds above 23970. A sustained break below this level could shift momentum to the downside in the short term.
This communication is for informational purposes only and should not be viewed as any form of recommendation as to a particular course of action or as investment advice. It is not intended as an offer or solicitation for the purchase or sale of any financial instrument or as an official confirmation of any transaction. Opinions, estimates and assumptions expressed herein are made as of the date of this communication and are subject to change without notice. This communication has been prepared based upon information, including market prices, data and other information, believed to be reliable; however, Trade Nation does not warrant its completeness or accuracy. All market prices and market data contained in or attached to this communication are indicative and subject to change without notice.

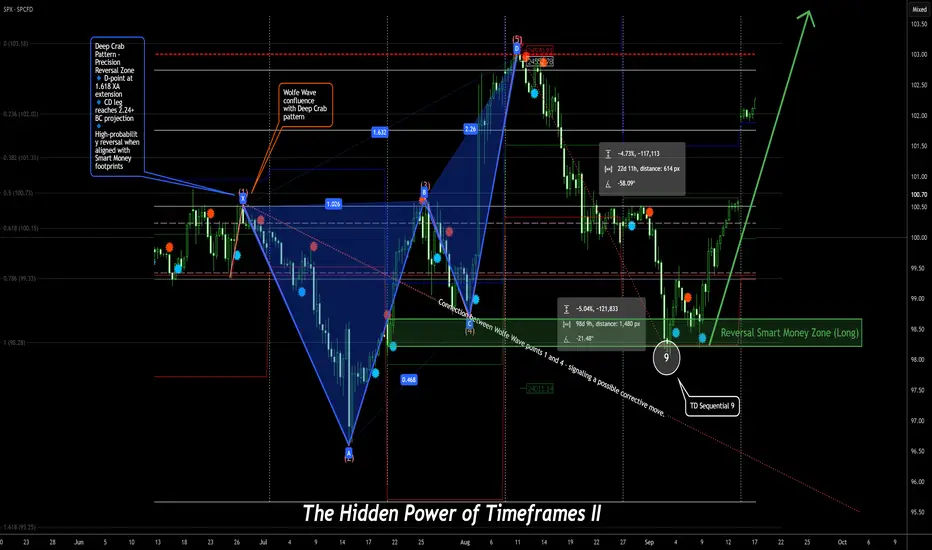
The Hidden Power of Timeframes – Part 2 🔮 The Hidden Power of Timeframes – Part 2 Connection Confluence” – The Invisible Architecture of Precise Trades
Seeing the Invisible
Welcome to Part 2.
If Part 1 gave you clarity on how timeframes interact, we now go one level deeper — into the unseen forces that move beneath the surface of every chart.
🧠 The question is:
“How can I recognize where structure is headed — before it even forms?”
🧠 It’s Not Just About Alignment – It’s About Multi-Timeframe Confluence
The magic doesn’t lie in one indicator or one pattern.
It’s born in the interplay of powerful concepts:
🌀 Wolfe Waves forming at the edges of Order Blocks
🧬 Harmonic Patterns merging with RSI or MACD divergences
🔢 TD Sequential counts signaling exhaustion at precise turning points
🕯️ Japanese Candlesticks confirming what orderflow already whispers
🔐 Smart Money footprints revealing where the crowd dreams — and where those dreams get crushed
This is more than technical analysis.
This is about reading intention — before it becomes visible.
⏳ Multi-Timeframe Fractals – The Echo of the Market
The market is fractal.
What unfolds on a 15-minute chart can mirror the Daily — and often previews the next big move on the Weekly.
📌 Example Scenario:
✅ Bullish divergence on the 4H chart
✅ Aligns with a Gartley pattern on the Daily
✅ Completes just as a TD9 count signals exhaustion on the Weekly
✅ While retesting a monthly liquidity pool
That’s not coincidence — that’s Signal Confluence.
And those who read it are always one step ahead of the market.
🛰️ Smart Money & Orderflow – Trade the Why, Not Just the What
Smart Money doesn’t chase candles.
It trades intent, imbalance, and psychology.
🛠️ Tools of the Trade:
Fair Value Gaps (FVG)
Order Blocks
Liquidity Sweeps
Breaker Blocks
Displacement & Inducement
Retail traders chase patterns.
Smart Money chases the dreams of retail.
🔗 The Real Edge: Seeing Connections Others Miss
A Wolfe Wave is just a shape
An Elliott Wave is just a count
A TD9 is just a number
But when…
🌀 A Wolfe Wave forms during the 5th Elliott Wave
🔢 Ends with a TD9 at a liquidity high
🔐 Inside an Order Block...
💥 That’s not just technicals — that’s chess on the chart.
That’s how real precision is born.
That’s how you anticipate moves weeks — or even months — in advance.
🧭 The Meta Skill: Navigating Confluence Across Timeframes
You don’t need to know everything.
You just need to:
✔️ Recognize when timeframes align
✔️ Feel where systems converge on one idea
✔️ Avoid forcing trades when there’s no synergy
✔️ Only act when the market’s story is consistent across all levels
A true edge doesn’t come from more tools —
It comes from clarity in complexity.
🧩 Bonus Insight: Alignment Within a Single Timeframe
Timeframe confluence is powerful.
But don’t underestimate the strength of multiple high-probability signals inside just one timeframe.
Example:
In a 4H chart:
Wolfe Wave
Harmonic Pattern
Orderflow Zone
Divergence
…all pointing to the same reversal area.
That’s not clutter — that’s weighted confluence.
These moments often deliver the most decisive trades.
💬 Comment below – or share this with someone who’s always fighting their own timeframes.
🚀 Let’s trade with precision — not prediction.
My bullish positionYou saw what happened at the beginning of Q4 how indices fell then Trump announced a cooling pressure but an ice meltdown to the dollar so
All indices will go long till next year, bye dollar shorts, welcome zzzusd longs contiunation. Hedge funds already bought till last year now they just adding on dips
📈📉📊📈📉📊🗂️📂

GER40 (DAX) Bulls in Control, But Overbought Signals Flash
GER40 (DAX) Bulls in Control, But Overbought Signals Flash Technical Forecast:
Asset: GER40 (DAX Index)
Closing Price: 24,190.7 (as of 11th Oct 2025) USTC+4
Analysis Timeframe: Intraday (1H/4H) & Swing (D/W)
1. High-Level Market Structure & Context
The GER40 maintains a robust bullish trend on higher timeframes, trading well above its key Daily and Weekly Moving Averages. However, the recent ascent has pushed the index into overbought territory on intraday charts, suggesting a potential for a short-term pullback or consolidation before the next leg higher. Geopolitical stability and ECB policy expectations remain key drivers.
2. Multi-Timeframe Technical Breakdown
Primary Trend (Daily/Weekly): Bullish
Elliott Wave: The index appears to be in a powerful Wave 3 impulse wave on the daily chart. A minor Wave 4 pullback is anticipated, which would be a healthy correction and a buying opportunity for the subsequent Wave 5.
Ichimoku Cloud: The price is far above the Daily Cloud (Kumo), confirming the strong bullish trend. The Lagging Span (Chikou Span) is also well above the price action of 26 periods ago.
Moving Averages: The Golden Cross (50 EMA > 200 EMA) is firmly intact on the daily chart, providing dynamic support.
Short-Term Outlook (4H/1H): Caution - Overbought
RSI Divergence: The 4H RSI is showing a clear bearish divergence, forming lower highs while price makes higher highs. This is a strong warning sign of weakening momentum and an impending pullback.
Bollinger Bands: The price is riding the upper band on the 4H chart, a classic sign of an overextended move.
Wyckoff Theory: The market shows signs of a potential upthrust or a bull trap formation near the 24,250 resistance. A failure to hold gains here could lead to a reaction back to the support zone.
3. Key Price Levels & Patterns
Resistance: 24,250 - 24,350 (Recent highs & Upper Bollinger Band)
Immediate Support: 24,000 (Psychological level & recent swing low)
Strong Support: 23,800 (50-period EMA on 4H & Fibonacci 38.2% retracement)
Major Support: 23,500 (200 EMA on Daily & Wave 4 target)
A Bearish Gartley or Bat harmonic pattern is forming, suggesting a potential reversal at the 24,250-24,350 PRZ (Potential Reversal Zone).
4. Actionable Trading Plan
Intraday Strategy (Next 1-2 Days):
Scenario A (Short Setup): Look for a rejection at the 24,250-24,350 resistance zone, confirmed by a bearish candlestick pattern (e.g., Bearish Engulfing, Shooting Star) and a turn down in the RSI.
Sell Entry: 24,260 - 24,320
Stop Loss: 24,450
Take Profit 1: 24,050
Take Profit 2: 23,850
Scenario B (Long Setup): A buy-the-dip opportunity emerges on a pullback to the 23,800 - 23,850 support cluster, with a bullish reversal candlestick and RSI recovering from oversold (<40).
Buy Entry: 23,820 - 23,870
Stop Loss: 23,700
Take Profit 1: 24,100
Take Profit 2: 24,250
Swing Trading Strategy (Next 1-2 Weeks):
Bias: Bullish overall. The primary goal is to enter long on dips.
Ideal Long Entry: A deeper pullback to the 23,500 - 23,600 zone would present a high-probability, low-risk long entry for a swing trade targeting new highs above 24,500.
Invalidation: A daily close below 23,450 would invalidate the immediate bullish Elliott Wave count and suggest a deeper correction is underway.
5. Volume & Momentum Insight
VWAP & Volume: The Anchored VWAP (from a recent low) shows the price is extended above it, supporting the overbought thesis. Volume has been declining on the most recent push higher, indicating a lack of strong conviction—a characteristic of a bull trap.
Conclusion: While the long-term trend for the GER40 is unequivocally bullish, the short-term setup favors a corrective pullback. Intraday traders can scout for short opportunities at resistance, while swing traders should patiently wait for a better risk/reward long entry at lower support levels. Always manage your risk.
Disclaimer: This is technical analysis, not financial advice. Trade at your own risk.

GER40 – Bullish Breakout Toward Key ResistanceThe German DAX (GER40) has broken above the 24,470.00 resistance level, confirming a bullish continuation pattern. Buyers are maintaining strong momentum, aiming for the next key target near 25,209.27, with a potential extension toward 25,587.34 if momentum sustains.
Support at: 24,470.00 🔽 / 23,888.55 🔽
Resistance at: 25,209.27 🔼 / 25,587.34 🔼
🔎 Bias:
🔼 Bullish: While price holds above 24,470.00, buyers could continue driving price toward 25,209.27 and 25,587.34.
🔽 Bearish: A drop back below 24,470.00 would weaken the bullish structure, exposing 23,888.55 as the next downside target.
📛 Disclaimer: This is not financial advice. Trade at your own risk.

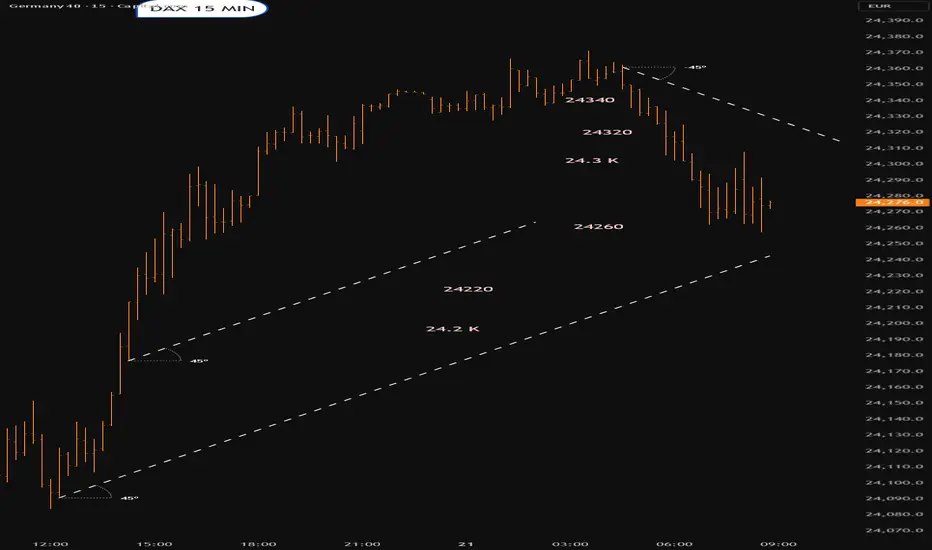
Dax into the open.Tuesday 14th October24.2K supp area looming
Rez starts @ 24.3K
Lets see what happens

Technical Analysis WeeklyGermany 40 is back in a neutral trend after a false break to new highs, trading at 24,374 near its VWAP of 24,025. The RSI at 57.9 suggests modest bullish sentiment. Support is at 23,256, with resistance at 24,795.
UK 100 is in a bullish trend but currently in a pullback phase, trading at 9,430, just above the VWAP of 9,373. The RSI at 56 signals stable but slowing momentum. Support is at 9,148, while resistance stands at 9,598.
Wall Street remains in a bullish trend but undergoing a correction after Friday’s sharp drop, trading at 45,915, slightly below its VWAP of 46,366. The RSI at 45 reflects a cooling market. Support is at 45,718 and resistance is at 47,015.
Brent Crude continues in a bearish trend but holding in a range phase, currently at 6,341 and below its VWAP of 6,597. RSI at 37.8 indicates weak buying pressure. Support is at 6,219 and resistance at 6,975.
Gold maintains its explosive bullish impulsive trend into a fresh record high on Monday, trading at 4,069 above its VWAP of 3,865. The RSI at 83 shows extreme overbought conditions. Support lies at 3,631, with resistance at 4,099.
EUR/USD is still in a broader range phase. After a false break to new highs a fortnight ago, it is now breaking down toward the bottom of the range - trading at 1.1614 just below its VWAP of 1.1699. The RSI at 41 suggests weakening momentum. Support is at 1.1567 and resistance at 1.1831.
GBP/USD is testing the lower bounds of its longer term price range, trading at 1.3350 slightly below the VWAP of 1.3424. The RSI at 42 indicates lack of bullish strength. Support is at 1.3301 and resistance at 1.3545.
USD/JPY despite a pullback on Friday, the pair continues its bullish impulsive move, trading at 151.84 above the VWAP of 149.56. The RSI at 64 signals strengthening momentum. Support lies at 145.66, while resistance is at 153.46.
DAX 08.10.2025~+ Import steel tariffs in the EU (local industry is supported)
*Index didn't follow through much to the downside on FR PM resignation

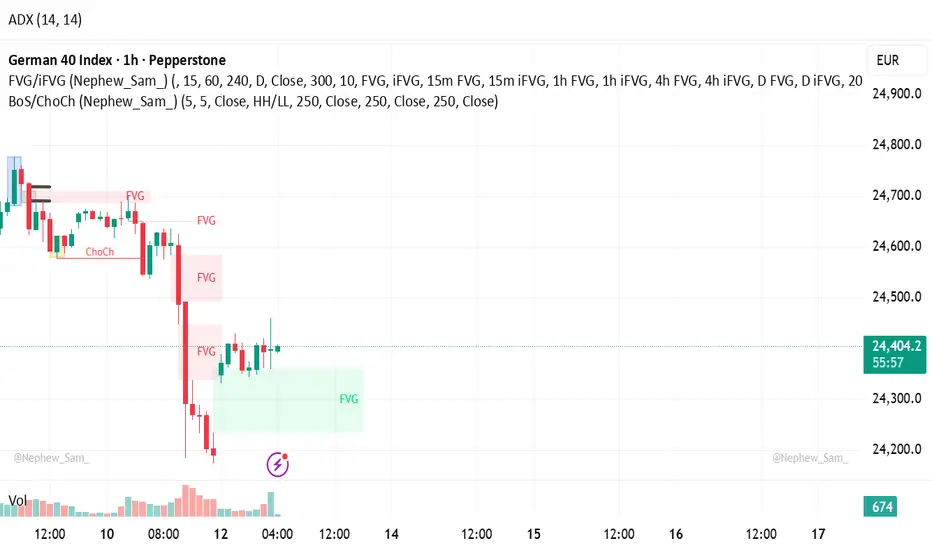
DAX Set for a London Session Breakout?Price is currently ranging above a fair value gap (FVG) after a strong sell-off. The market is showing signs of potential accumulation, holding above this imbalance zone. As we head into the London session, I’ll be watching for bullish momentum and a possible push upward if price continues to respect this area.
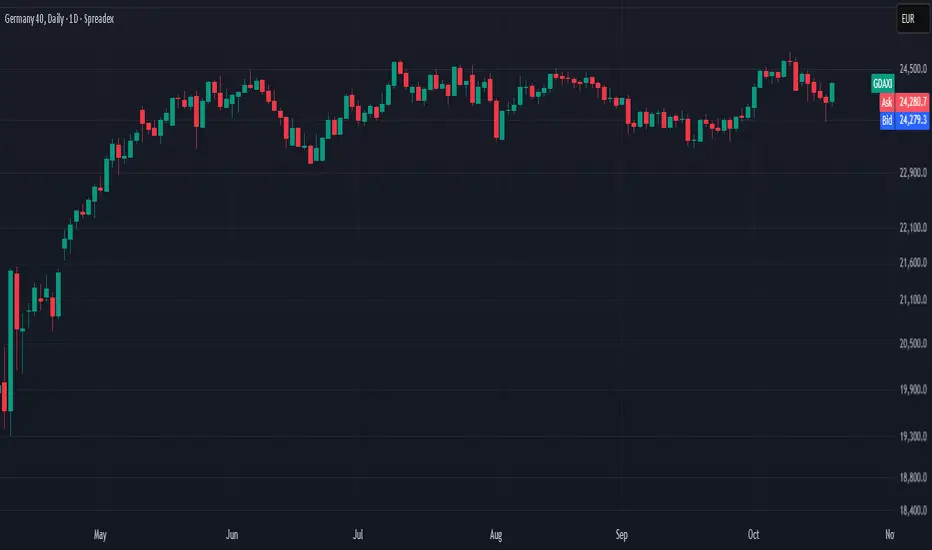
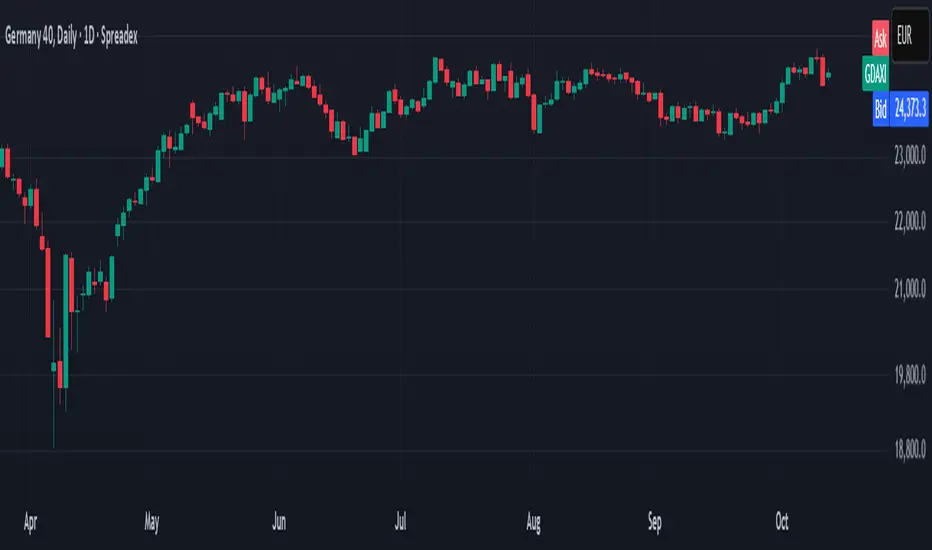
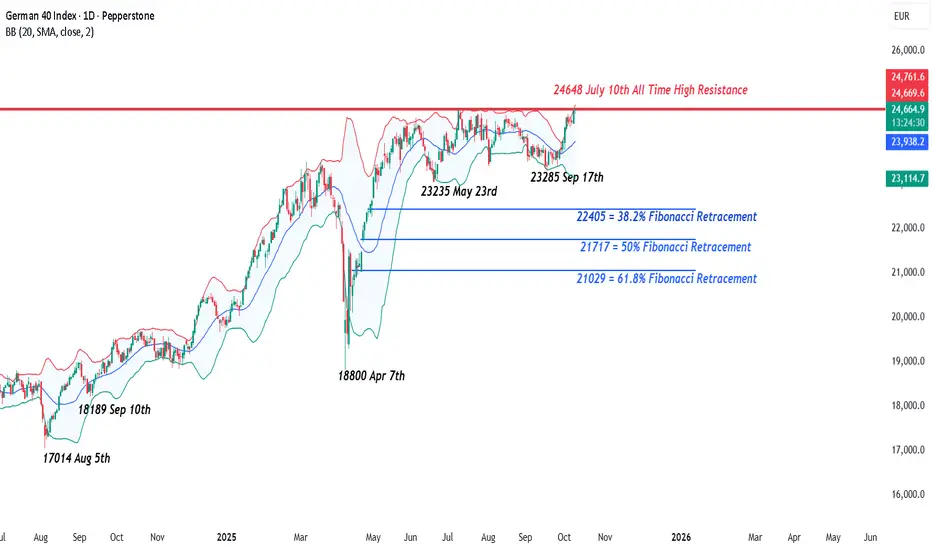
Germany 40 Index – Focus on the All-Time HighDespite weaker than expected factory orders (4th monthly fall) and industrial production (3 year low) data from Germany earlier this week, which both unexpectedly fell, highlighting weaker growth prospects and structural issues that urgently need to be addressed to support the country’s key industrial corporates to deal with the impact of US tariffs and competition from China, the Germany 40 index has steadily moved back towards its all-time high of 24648.
In fact, since the end of a disappointing range bound September, the Germany 40 has risen around 800 points or 3.4% as investors look to rotate back into European markets in a search of lower valuations compared to US companies, especially in the technology sector.
Now, in what has been a week light event week, with Q3 earnings about to start, the focus for traders could be whether the technical trends indicate there is enough momentum to push towards new record highs, or whether the recent gains may lead to some profit taking ahead of the Friday close.
Technical Update: Focus on the All Time High
Recent activity in the Germany 40 index has been contained between 23235, the May 23rd session low, and 24648 the July 10th all-time high. The price action within this range has reflected a more balanced tone, with a clear tug-of-war between buyers and sellers.
A decisive closing breakout through either boundary may be needed to suggest the next directional move.
As the chart above shows, the most recent price activity since the 23285 September 17th low has seen prices recover, a move that is now testing the important resistance level marked by the July 10th all-time high at 24648.
Traders could well be watching closely to see if this new strength leads to a clear closing upside breakout, or if the range between 23235 and 24648 is to remain intact.
Potential Resistance Levels:
One could argue that having previously attracted sellers and held firm as a ceiling since July 10th, 24648 remains the first key resistance to watch. A closing break above this level might signal renewed bullish momentum and open the door for further upside in price.
While a close above 24648 doesn’t guarantee continued strength, it could encourage further upside attempts.
When in new all-time high territory, pinpointing resistance becomes more difficult, but Fibonacci extension levels can offer useful reference points. These projections can be used to help frame potential resistance levels.
While a successful close above 24648 has yet to materialise, such a break could prompt traders to shift their focus towards 25162, the 38.2% extension or even 25482, which is the 61.8% level.
Possible Support Levels:
Of course, the July 10th high of 24648 currently remains intact on a closing basis and continues to serve as the first possible resistance level, marking the upper boundary of the current sideways range. As such, it may once again prove effective in capping price strength. If this resistance holds, it could see renewed selling pressure, raising the risk of fresh price declines.
As shown in the chart above, the 24273 low from October 6th, represents the last correction low in the current rally and may now act as an initial support. If this level breaks it could signal potential for downside moves towards 24133, which is the 38.2% Fibonacci retracement, and possibly further to the rising Bollinger mid-average, which currently stands at 24000.
The material provided here has not been prepared accordance with legal requirements designed to promote the independence of investment research and as such is considered to be a marketing communication. Whilst it is not subject to any prohibition on dealing ahead of the dissemination of investment research, we will not seek to take any advantage before providing it to our clients.
Pepperstone doesn’t represent that the material provided here is accurate, current or complete, and therefore shouldn’t be relied upon as such. The information, whether from a third party or not, isn’t to be considered as a recommendation; or an offer to buy or sell; or the solicitation of an offer to buy or sell any security, financial product or instrument; or to participate in any particular trading strategy. It does not take into account readers’ financial situation or investment objectives. We advise any readers of this content to seek their own advice. Without the approval of Pepperstone, reproduction or redistribution of this information isn’t permitted.
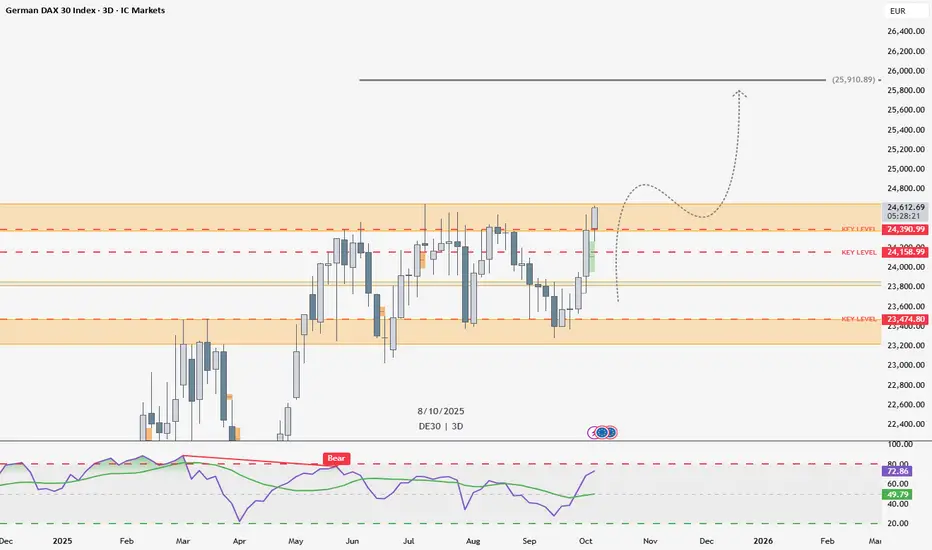
German DAX (DE30) — 3D ChartGerman DAX (DE30) — 3D Chart 📈
I expect price to form a new Higher High (HH) and a Break of Structure (BOS) on the 3-Day timeframe.
Long-term target: around 25,910
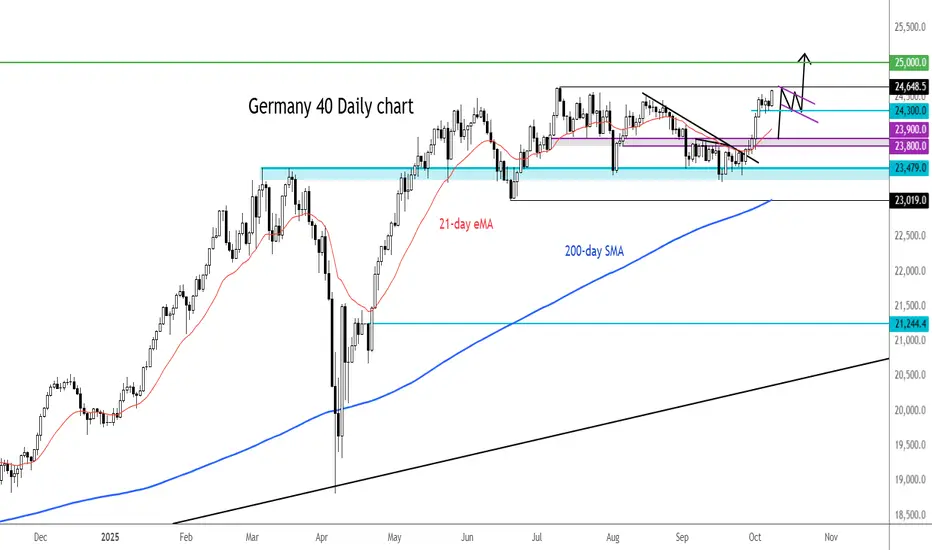
DAX break out againDAX held the 24,300 support level we highlighted previous and it has just broken out to a new high on the week and month. It looks like we will get that follow-thru to a new all-time high we were looking for so long as this level now remains intact.
If a new high is made, why stop there? Expectations of more German stimulus continues to drive markets higher. So i wouldn't be surprised if the DAX even reached 25K handle in the coming days.
By Fawad Razaqzada, market analyst with FOREX.com
Dax.A bit more confirmation neededRetracing a bit.Is it enough to convince buyers to walk..?
Lets see what happens

Dax. A top in place.?Careful with that...Could recoil and kick you where it hurts
Could be a top.Maybe the market might fool around trying to convince you

DAX: Bulls Are Winning! Long!
My dear friends,
Today we will analyse DAX together☺️
The recent price action suggests a shift in mid-term momentum. A break above the current local range around 24,671.00 will confirm the new direction upwards with the target being the next key level of 24,764.14 and a reconvened placement of a stop-loss beyond the range.
❤️Sending you lots of Love and Hugs❤️