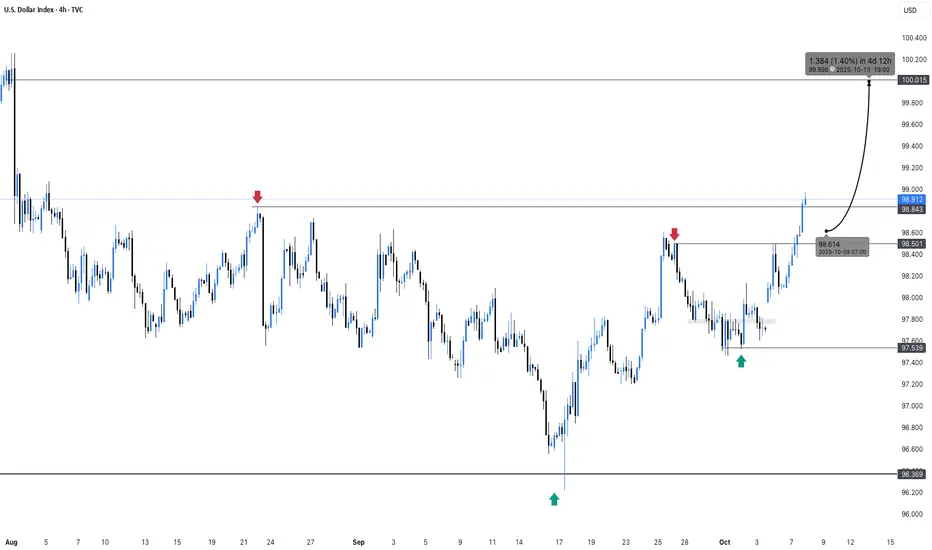
DXY – The Road to 100 Looks ClearIn my previous analysis on DXY, I mentioned that as long as the 97.60 zone holds, there are strong chances for an upside move and a possible test of the 100 level.
Indeed, the index reversed perfectly from that support area and has now broken above the interim resistance around 98.60, trading close to 99 at the time of writing.
Over the last three sessions, DXY has also completed an inverted Head & Shoulders pattern, with the neckline breakout confirming the bullish structure.
From here, the path toward the 100 zone appears clear and technically justified.
I maintain a bullish bias for the U.S. Dollar Index, which naturally implies a bearish outlook for EURUSD and GBPUSD in the short term.
Trade ideas

08.10.25 Morning ForecastPairs on Watch -
FX:GBPUSD
FX:EURUSD
A short overview of the instruments I am looking at for today, multi-timeframe analysis down to what I will be looking at for an entry. Enjoy!


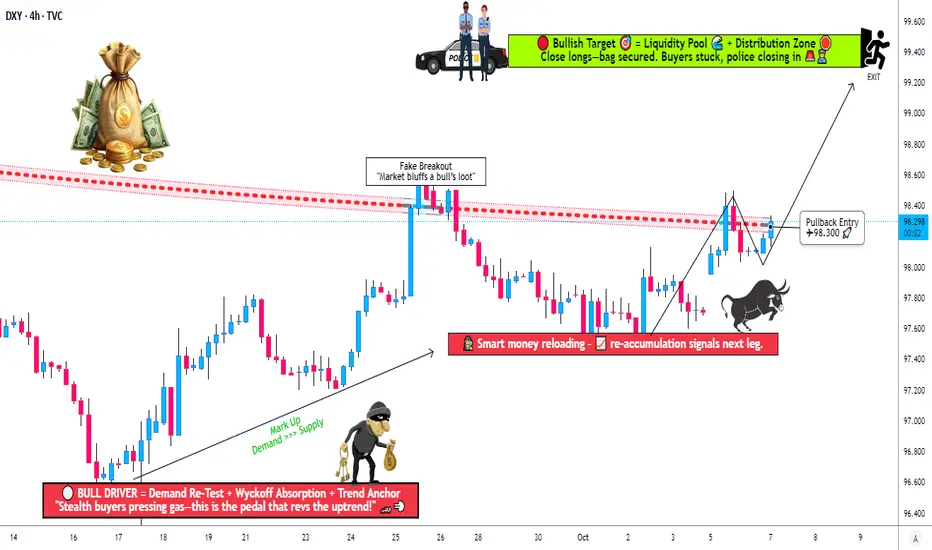
DXY Breakout Confirmed — How Far Can Bulls Run?💰 Thief’s Heist: DXY Bull Raid in Progress ⚡ Layered Entry Strategy!
📈 Setup Summary
Asset: DXY Dollar Index (Cash)
📊 Bias / Plan: BULLISH — 0.786 Triangular Moving Average was breached by buyers → trend confirmation in progress 🚀
🎯 Thief’s Game Plan (Swing / Day Trade)
🕵️ Entry Plan — “Layered Thief Style”:
💎 Any price level entry is valid — flexibility is the Thief’s advantage!
🔹 Sample Limit Layers:
• 97.800
• 98.000
• 98.200
(💡 You can increase or reduce layers based on your own style — stack smartly!)
🧨 Stop Loss (Thief SL):
⚠️ 97.400 → This is the “Thief SL Zone”
👉 But you’re the mastermind — set your own SL if you prefer!
💰 Target Zone (TP):
🚧 Police Barricade at ~99.400 — strong resistance area + oversold trap likely
💨 Thieves escape with bags before the trap closes!
⚙️ Take profit partially or fully at your own comfort — be swift, be smart 🦅
🧩 Market Insight & Technical Reasoning
✅ 786 Triangular MA breach confirms bullish structure
✅ DXY strength often follows Treasury Yield push 📈
✅ Strong USD = Weak Gold & EUR/USD usually
✅ Oversold readings hint buyers ready to counter attack
🔗 Correlation Watchlist (Related Pairs)
Keep an eye on these for confirmation 🔍
💶 FX:EURUSD → usually inverse to DXY
💷 FX:GBPUSD → tracks EUR/USD correlation
💴 FX:USDJPY → directly correlates with DXY
🥇 Gold ( OANDA:XAUUSD ) → moves opposite to DXY
💵 TVC:US10Y Yields → rising yields = bullish DXY
💡 Key Tip:
When EUR/USD & GBP/USD drop sharply + yields rise → DXY often continues its rally 🧭
⚠️ Notes & Thief Disclaimers
👑 Dear Ladies & Gentlemen (Thief OGs):
I’m not recommending my SL or TP — make your own risk rules 💼
You can make money, take money, or just watch the play unfold 🎭
This is a “Thief Style” strategy, shared for fun & educational inspiration only 🧠
Always manage risk & protect capital first — thieves survive by escaping, not over-staying 💨
✨ “If you find value in my analysis, a 👍 and 🚀 boost is much appreciated — it helps me share more setups with the community!”
Disclaimer: this is thief style trading strategy just for fun
#DXY #USDIndex #Dollar #Forex #LayeredEntry #SwingTrade #DayTrade #ThiefStrategy #TrendBreak #SmartMoney #TechnicalAnalysis #USD #TradingView #FXStrategy
This is a quick follow up from early this morningI was freaking out over the pattern and the dxy and then it occurred to me that every time I do a trade and I want to get out of it... I basically get back into the dollar by default.... And that may be the reason the dollar is doing so badly is that there are a group of sharp traders exiting the gold and silver because they may understand that there is a reversal pattern and that they should liquidate their position in the gold and silver contracts...... This is clearly hypothetical in any case... I think there is value to the video that I did this morning and I hope that you take a look at it.

DXY: Will Go Down! Short!
My dear friends,
Today we will analyse DXY together☺️
The recent price action suggests a shift in mid-term momentum. A break below the current local range around 98.437 will confirm the new direction downwards with the target being the next key level of 98.260 and a reconvened placement of a stop-loss beyond the range.
❤️Sending you lots of Love and Hugs❤️

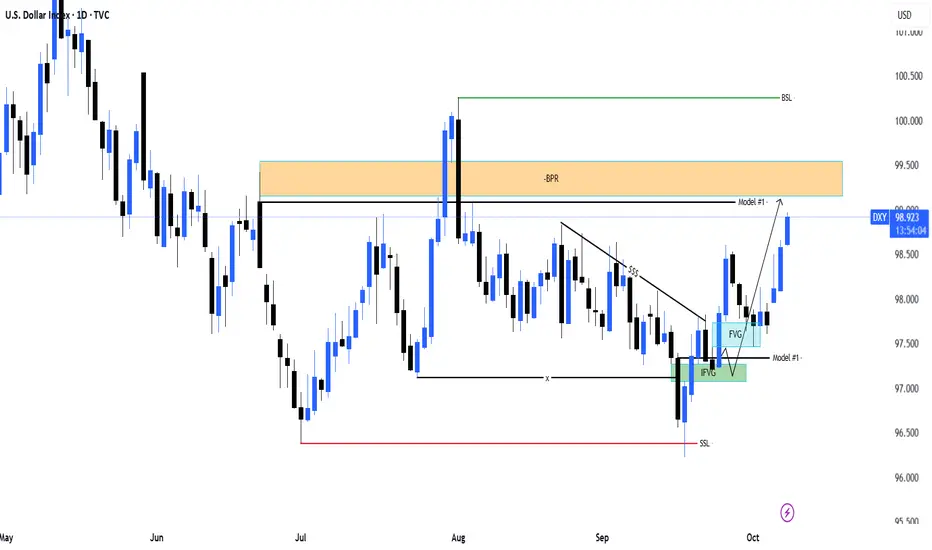
DXY Target Achieved | Smart Money Model #1 Playing Out PerfectlyHello Billionaires!!
In DXY D1 Projection we know the bullish projection on DXY played out exactly as expected.
Price swept the short-term sell-side liquidity (SSL), filled the IFVG, and then launched upward through the FVG, completing the Model #1 structure.
Currently, price is trading inside the BPR (Balanced Price Range), showing that the target zone has been successfully reached.
🧠 Smart Money Logic:
SSL sweep → Market Structure Shift
IFVG + FVG = Strong Reaccumulation
Price delivered to BPR (Premium Zone)
Model #1 completion confirms bullish delivery
Now I’ll be watching for potential reaction or retracement from this premium zone before the next move develops.
#DXY #SmartMoneyConcepts #PriceAction #ICT #Forex #Liquidity #BPR #FVG #IFVG

Bullish DXYPotential Inverted Head and Shoulders display.
Am very Bullish on USD Index right now and Bearish on most xxx/USD pairs.

DXY H4 CHARTWe are looking price making a rally targeting the marked supply area of the LTF price structure. It is important to note the many retail traders are coming into the market at this current price area which is late according our strategy.
this rally in price will have a huge impact to the drop of the GOLD which is long over due. We will monitor the price action for better entry given price drops targeting our LTF DEMNAD AREAS.
DOLLARThe dxy rally into 99,187 will be watched for rejection, this price action could give USDJPY ,EURUSD ,GBPUSD,AUDUSD AND NZDUSD a good trade opportunity.

DXY 30 SEPTEMBER 2025 BEFOREAnticipating the potential for Bullish DXY :
1. Looking for support to form around the key levels within a key trading session , should support fail to form at the key levels price could drop below 91.199
2. Should we get rapid and aggressive movement away from the key level i will target the recent Swing high at 98.605 for profit taking

Dollar IndexDXY - U.S Dollar Index
- Completed " 12345 " Impulsive Waves
- Change of Characteristics
- Break of Structure
- Falling Wedge as an corrective pattern in Short Time Frame
- Demand Zone

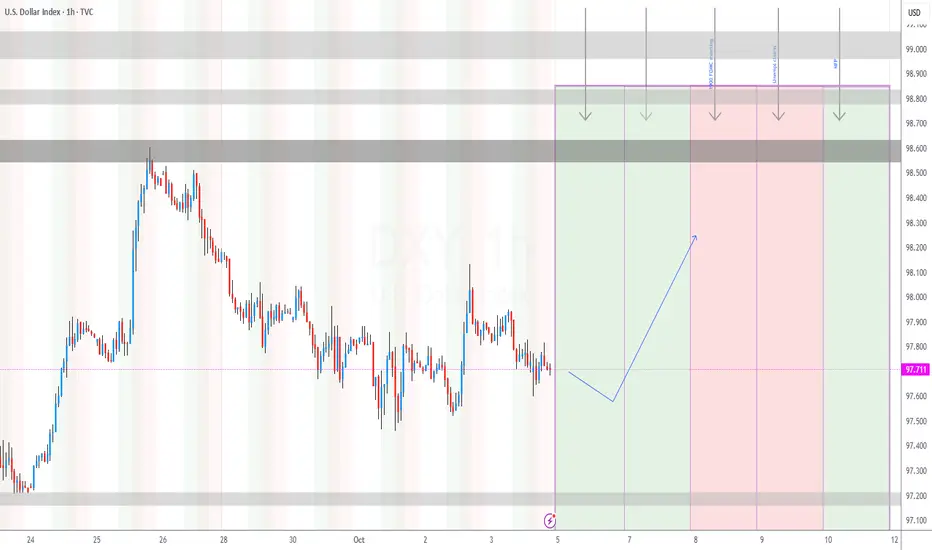
DXY key levels to look out for this week (WC 06/10)DXY key levels for the following week ahead of FOMC meeting, Unemployment claims & Non-Farm Payroll releases
DXY DAILY TIMEFRAME ANALYSIS 1. Market Context & Structure
Timeframe: Daily
Current Price: 97.711
Trend Bias: Medium-term bearish structure still intact, though currently in a corrective bullish retracement.
Structure Flow:
Lower highs and lower lows dominate since mid-July.
Current price action shows a potential pullback within a bearish trend.
---
🧩 2. Key Technical Zones
🔵 Supply Zone (99.50–100.20 area)
This area represents an institutional short-entry zone, where large orders previously triggered aggressive selling pressure.
Expect liquidity inducement — price may push into this zone to grab stops above prior highs before reversing down.
Aligns with the fair value gap below, which provides imbalance liquidity magnetism.
🟥 Fair Value Gap (around 99.00)
The gap between bullish and bearish candles created inefficiency in price delivery.
The market often revisits such imbalances to fill orders left behind by institutional players.
Expect a short-term rally into this gap before a reversal.
🟪 Demand Zone (96.20–96.50)
Marked as a strong previous accumulation point.
Each retest here in the past has produced bullish rejection wicks — suggesting pending liquidity below.
This is likely the final downside target if the bearish continuation unfolds.
---
📉 3. Institutional Flow Outlook
Scenario A (High-Probability Bearish Path):
1. Price retraces upward into the fair value gap / supply zone.
2. Smart money executes sell programs once liquidity above minor highs is swept.
3. Momentum shifts downward, leading price to revisit the 97.00 mid-support and ultimately the 96.20 demand zone.
Scenario B (Less Likely Bullish Continuation):
Only if DXY reclaims and holds above 100.50, confirming institutional demand, then bias could shift bullish — but current chart doesn’t support this yet.
---
💼 4. Macro Correlation
A weak DXY typically strengthens:
EUR/USD → bullish continuation toward higher liquidity pools.
Gold (XAU/USD) → potential upside resumption as dollar weakens.
Watch for confirmation from upcoming CPI or FOMC data — a dovish Fed stance will likely accelerate the bearish DXY scenario.
---
🧠 5. Professional Summary
Factor Observation Implication
Market Structure Lower highs & lower lows Bearish continuation likely
Supply Zone 99.50–100.20 Institutional sell area
Fair Value Gap 98.80–99.20 Liquidity magnet (retracement target)
Demand Zone 96.20–96.50 Final downside liquidity target
Bias Bearish Look for shorts after retracement
---
📊 Conclusion:
DXY is likely setting up a liquidity-grab rally into the 99.00–100.00 supply zone, followed by a bearish continuation toward 96.20.
Institutional players are expected to use that retracement to load shorts, maintaining bearish macro bias.

DXYDXY is going sideways, we meed more sideways movement this week before going up.
Disclosure: We are part of Trade Nation's Influencer program and receive a monthly fee for using their TradingView charts in our analysis.

DXY nfp again breaking the support?Hello traders, this is a complete multiple timeframe analysis of this pair. We see could find significant trading opportunities as per analysis upon price action confirmation we may take this trade. Smash the like button if you find value in this analysis and drop a comment if you have any questions or let me know which pair to cover in my next analysis.

DXYI am bullish on DXY. My Target is 115, this could take about 18-24 months. Next year 2026 looks full on bullish for DXY.

DXY 1H🔹 Overall Outlook and Potential Price Movements
In the charts above, we have outlined the overall outlook and possible price movement paths.
As shown, each analysis highlights a key support or resistance zone near the current market price. The market’s reaction to these zones — whether a breakout or rejection — will likely determine the next direction of the price toward the specified levels.
⚠️ Important Note:
The purpose of these trading perspectives is to identify key upcoming price levels and assess potential market reactions. The provided analyses are not trading signals in any way.
✅ Recommendation for Use:
To make effective use of these analyses, it is advised to manually draw the marked zones on your chart. Then, on the 15-minute time frame, monitor the candlestick behavior and look for valid entry triggers before making any trading decisions.

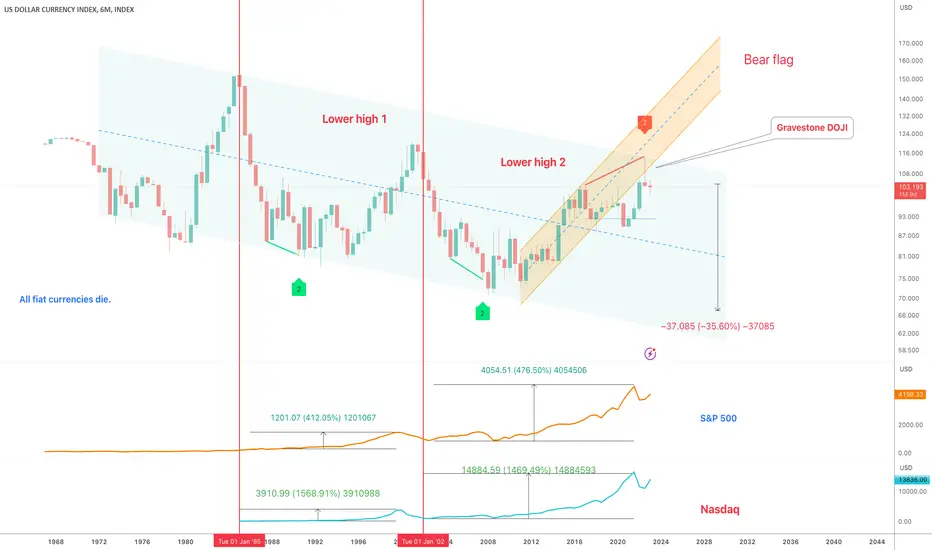
Dollar index - Macro Bearish divergenceA lot of information in the above 6-month chart of the dollar index, could discuss for hours.. some highlights:
1) The bearish divergence currently printing shall confirm by July 2023 should 100 level collapse. It is the only time in history a bearish divergence of this strength has printed on the 6-month chart.
2) IF it confirms, the index will target the lower side of the channel around 60-70 level.
3) Notice the trend of the index, lower highs lower lows. It is remarkable how many are bullish on the dollar, in the macro sense.
4) Both the S&P 500 and the NASDAQ made considerable gains in the 10-year period that followed a rejection from the upper side of the channel. Many ‘experts’ now talk about the coming lost decade. Gold is the only option, they say. Is that what you see in this chart?! Not what I’m seeing..
Will return in July to see how this candle prints, however with 1.3 months to go it is not looking good for the dollar.
Ww
DXY LOCAL SHORT|
✅DXY price is reacting to a confirmed ICT supply level, showing a clean mitigation from the imbalance zone. As long as this level holds, sellers may target the short-term liquidity resting below 98.30. Time Frame 2H.
SHORT🔥
✅Like and subscribe to never miss a new idea!✅

dxy similar to the last 3 mull markets dxy has broken down from it highs
last week dxy tried to break out of the range to be just put back into the range
so expect a continuation into low 90's , will it bottom at 93 or go lower to 89 , i something to be seen

Elliott wave analysis of the DXYThis is a full blown Elliott wave analysis of the DXY, the US Dollar Index.
I show three possible scenarios. Both the macro and current wave forms are analyzed.
