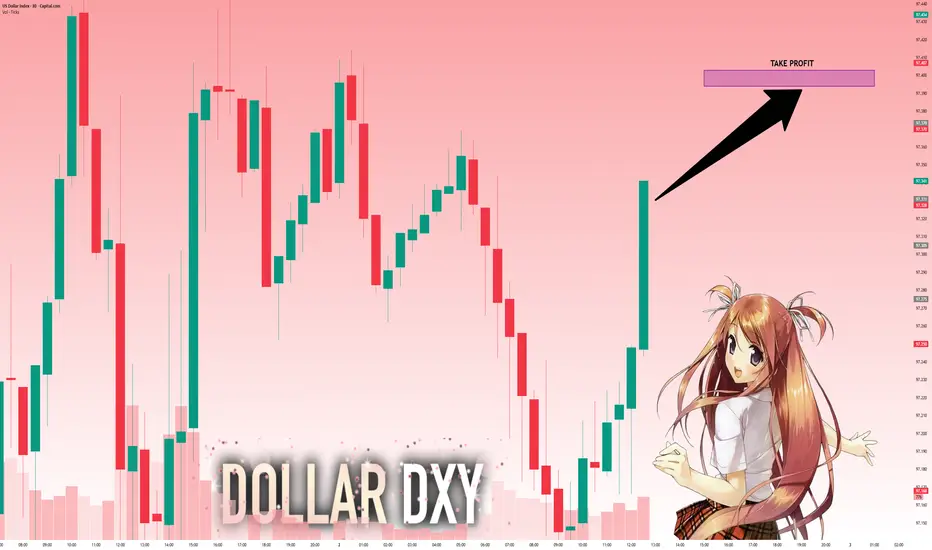
DXY: Move Up Expected! Long!
My dear friends,
Today we will analyse DXY together☺️
The recent price action suggests a shift in mid-term momentum. A break above the current local range around 97.331 will confirm the new direction upwards with the target being the next key level of 97.393 and a reconvened placement of a stop-loss beyond the range.
❤️Sending you lots of Love and Hugs❤️
Trade ideas
Dxy builds momentum The DXY remains firm in its bullish conception, setting up for a potential projection toward the 101.000 level. This reinforces sustained dollar strength as market structure aligns with bullish momentum.

1:1 GUSmall reversal area based off previous lows, momentum to the downside but this might work out as a mini retracement.

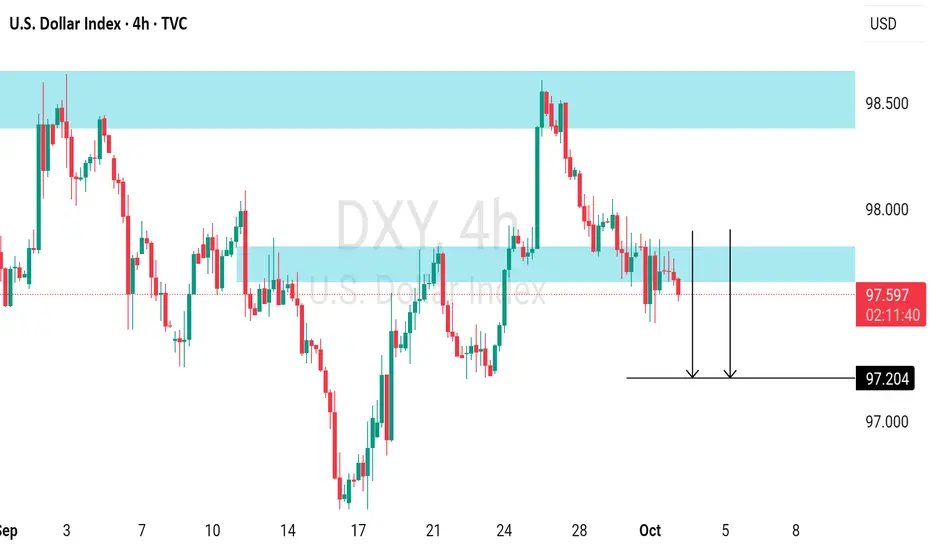
DOLLAR INDEX(DXY) : Bearish Outlook Explained The recent violation of horizontal daily support on the 📉DXY presents a reliable bearish signal.
This indicates a mid-term trend favoring sellers.
It is anticipated that the price may decline to the 97.20 support level in the near future.
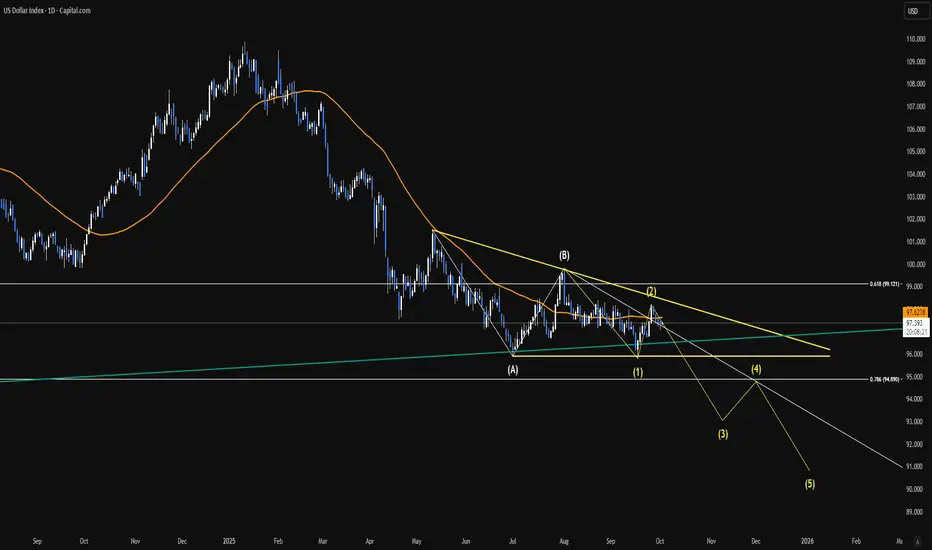
USD Breakdown in the making?Price has been consolidating within Fibs golden ratio while creating a typically bearish descending triangle, applying Elliot Theory (still learning btw) I find this pattern interesting at the bottom of a HTF bullish channel. With current monetary policy (as I understand it) Trump is intentionally weaking the Dollar to favor USA manufacturing. If this trend continues I believe it´s possible DXY reaches 91.00 levels and potentially keep boosting risk assets and/or gold.
50 DMA supports bearish momentum, Is the Dollar about to break down?
DXY in rangedxy strugling (september open /october open) levels above that is 38.2% fib from sep high also psychological level 98 with 50day moving average and 100 MA above them , in downside level 97.5 acted as support today, what do you think considering government shutdown?

My USD analysis 1st of October 2025I made a very long sophisticated USD post but it was taken down (thanks tradingview <3) where I called long on USD. My reason was just pure technical and how it was at a support range. I think there is still more upside despite the drama that's happening around the USD. I would wait for a retest at the support then make an attempt to go long. This might potentially be a formation of a double bottom. Gold and Silver skyrocketing, but I believe there is so much potential for USD.

US DOLLAR LIQUIDITY GAMES🇺🇸 US Dollar Range Politics – Liquidity Before Clarity
The dollar isn’t trending — it’s negotiating.
📊 Current Setup
U.S. Dollar Index (DXY): 98.322 → testing the value area high
Range Floor: 96.747 → the value area low
Structure: Bearish range, with liquidity being hunted before any true direction emerges.
🏛️ Macro Backdrop
Tariffs are reshaping global flows.
Fiscal gridlock + shutdown risk clouds investor confidence.
Inflation + Fed policy signals remain mixed.
Every headline feels like an amendment to a bill no one fully understands.
The result: the dollar drifts sideways in a liquidity-seeking phase. Traders should expect chop inside the box until a decisive catalyst (data, Fed action, or policy shift) provides clarity.
🌍 Cross Pair Impact
This stalemate spills into the majors:
EURUSD & GBPUSD → reflecting the same sideways ranges and fake-outs.
USDJPY → volatility compressed, waiting for dollar direction.
Crosses are trading in sympathy — liquidity hunts on both ends, with no clean trend until DXY escapes its range.
🧭 Takeaway: The dollar is boxed in by politics and policy. Patience rules here: trade the range, wait for the breakout.

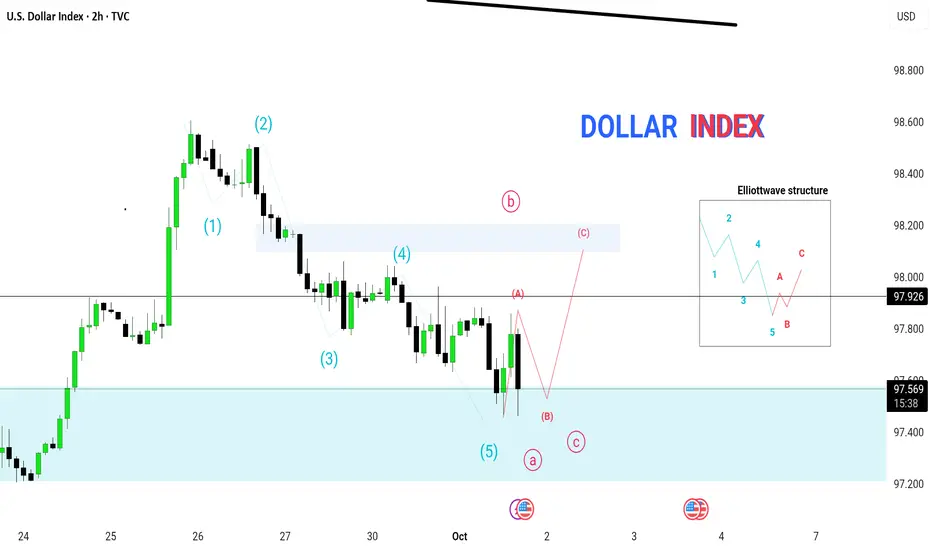
Dollar Index Elliott Wave Analysis | next move ABCIn this , we break down the U.S. Dollar Index (DXY) using Elliott Wave Theory. 📊
✅ 5-wave impulsive structure (1–5) has completed
✅ Market entering corrective phase (ABC)
✅ Key support: 97.40 – 97.20
✅ Resistance zone: 98.00
✅ Short-term bias: Possible corrective upside before continuation
This analysis is crucial for EUR/USD traders, as Dollar Index movement directly impacts Euro strength. Watch till the end to understand the upcoming correction and trading opportunities. 🚀
#ElliottWave #DollarIndex #ForexAnalysis #DXY #EURUSD
DXY TRADE IDEA 9.29.2025I am expecting the dollar index to find support at previous closing resistance zone. Support from this box is likely to give the next wave 5 from the initial impulse from the bottom thrust.

DXY Pressure Is Still to the DownsideIt has been a bumpy ride for the bears in this market without a doubt. But pressure to the downside is still strong.
We are yet to get a strong reversal signal. And so for now we keep riding the downtrend.

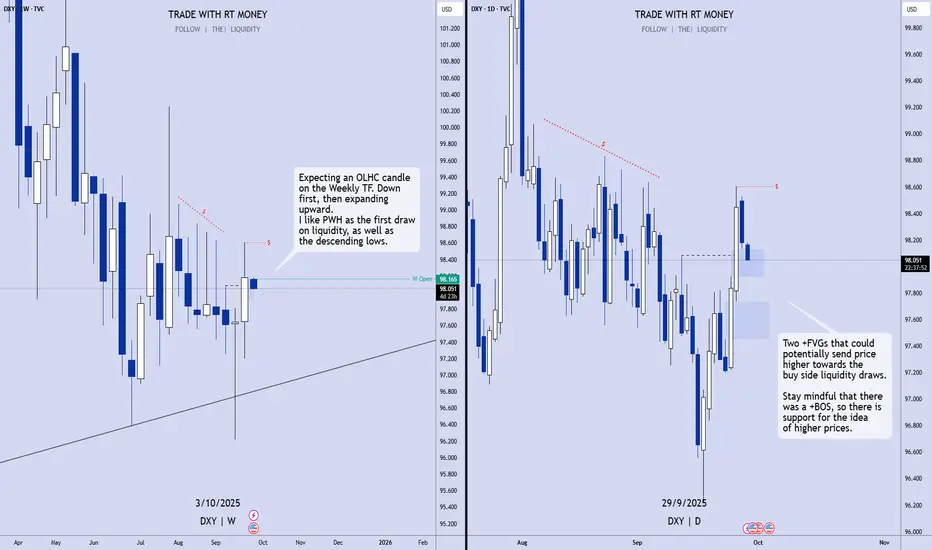
US Dollar Index: Bullish! Buy The Dip!Expecting price to retrace into the +FVGs below. Look on the 1H for a CISD when price comes into contact with either of the two poi's. Once a directional change is confirmed, buy it.
Enjoy!
May profits be upon you.
Leave any questions or comments in the comment section.
I appreciate any feedback from my viewers!
Disclaimer:
I do not provide personal investment advice and I am not a qualified licensed investment advisor.
All information found here, including any ideas, opinions, views, predictions, forecasts, commentaries, suggestions, expressed or implied herein, are for informational, entertainment or educational purposes only and should not be construed as personal investment advice. While the information provided is believed to be accurate, it may include errors or inaccuracies.
I will not and cannot be held liable for any actions you take as a result of anything you read here.
Conduct your own due diligence, or consult a licensed financial advisor or broker before making any and all investment decisions. Any investments, trades, speculations, or decisions made on the basis of any information found on this channel, expressed or implied herein, are committed at your own risk, financial or otherwise.
01.10.25 Morning ForecastPairs on Watch -
FX:USDJPY
FX:EURAUD
FX:GBPAUD
A short overview of the instruments I am looking at for today, multi-timeframe analysis down to what I will be looking at for an entry. Enjoy!

Bearish drop off?The US Dollar Index (DXY) is rising towards the pivot which acts as a pullback resistance that aligns with the 50% Fibonacci retracement and could drop to the 1st support.
Pivot: 98.12
1st Support: 97.23
1st Resistance: 98.77
Disclaimer:
The above opinions given constitute general market commentary, and do not constitute the opinion or advice of IC Markets or any form of personal or investment advice.
Any opinions, news, research, analyses, prices, other information, or links to third-party sites contained on this website are provided on an "as-is" basis, are intended only to be informative, is not an advice nor a recommendation, nor research, or a record of our trading prices, or an offer of, or solicitation for a transaction in any financial instrument and thus should not be treated as such. The information provided does not involve any specific investment objectives, financial situation and needs of any specific person who may receive it. Please be aware, that past performance is not a reliable indicator of future performance and/or results. Past Performance or Forward-looking scenarios based upon the reasonable beliefs of the third-party provider are not a guarantee of future performance. Actual results may differ materially from those anticipated in forward-looking or past performance statements. IC Markets makes no representation or warranty and assumes no liability as to the accuracy or completeness of the information provided, nor any loss arising from any investment based on a recommendation, forecast or any information supplied by any third-party.

DXY Technical & Order Flow AnalysisOur analysis is based on a multi-timeframe top-down approach and fundamental analysis.
Based on our assessment, the price is expected to return to the monthly level.
DISCLAIMER: This analysis may change at any time without notice and is solely intended to assist traders in making independent investment decisions. Please note that this is a prediction, and I have no obligation to act on it, nor should you.
Please support our analysis with a boost or comment!

BUY US Dollar! Sell xxxUSD Pairs! Buy USDxxx Pairs!This is the FOREX futures outlook for the Sept 30th.
In this video, we will analyze the following FX markets:
USD Index, EUR, GBP, AUD, NZD, CAD, CHF, and JPY.
Keep it simple! Buy USDxxx pairs. Sell xxxUSD pairs. Just wait for valid setups. Once price shows a valid change in the state of delivery on your entry TFs, enter.
Enjoy!
May profits be upon you.
Leave any questions or comments in the comment section.
I appreciate any feedback from my viewers!
Like and/or subscribe if you want more accurate analysis.
Thank you so much!
Disclaimer:
I do not provide personal investment advice and I am not a qualified licensed investment advisor.
All information found here, including any ideas, opinions, views, predictions, forecasts, commentaries, suggestions, expressed or implied herein, are for informational, entertainment or educational purposes only and should not be construed as personal investment advice. While the information provided is believed to be accurate, it may include errors or inaccuracies.
I will not and cannot be held liable for any actions you take as a result of anything you read here.
Conduct your own due diligence, or consult a licensed financial advisor or broker before making any and all investment decisions. Any investments, trades, speculations, or decisions made on the basis of any information found on this channel, expressed or implied herein, are committed at your own risk, financial or otherwise.

DXY Daily Outlook: Bearish Pressure BuildsLooking at the DXY (US Dollar Index) chart as of September 30, 2025, the long-term structure is clearly in a descending wedge pattern, showing sustained weakness since the sharp rejection from the 100.23 level earlier this year. Price action has been consistently making lower highs and lower lows, respecting the upper and lower trendline resistance and support. Currently, DXY is trading around 97.80, slightly above the mid-support zone, but momentum suggests that bears remain in control.
The chart also highlights multiple Change of Character (ChoCH) and Break of Structure (BOS) points, showing failed attempts by bulls to reverse the trend. Each rally has been capped below descending resistance, most recently around the 98–99 zone, which is now acting as a supply area. The ongoing compression in price suggests a possible breakout direction soon.
From a Fibonacci perspective, the major retracement levels drawn from the swing high (100.23) to the swing low (96.18) give clear downside targets. If the wedge breaks bearish, first support lies near 96.18, followed by Fib -0.382 (94.63), then deeper at -0.618 (93.67). A strong bearish continuation could extend toward the -1.618 projection (89.62), which aligns with long-term demand.
On the other side, if bulls manage to reclaim 98.50–99.00 with strong volume, it could trigger a corrective leg toward 100.23 (previous high and wedge resistance). However, given repeated rejections, this remains the less likely scenario unless macro fundamentals (such as Fed policy or global risk sentiment) strongly shift in favor of the dollar.
The RSI/Momentum structure would likely be neutral-to-bearish given the flat but declining structure. The price remains below the major moving averages (200-day SMA/EMA), adding weight to the bearish bias.
Momentum / indicators
Momentum on the daily appears neutral-to-bearish (rallies are weaker and get rejected).
RSI on daily (if checked) is likely flat-to-slightly below neutral, not showing strong bullish divergence — therefore rallies are corrective.
Price is trading under the major moving averages on the daily (200MA acts as dynamic resistance), reinforcing the bearish bias unless reclaimed decisively.
Key daily levels
Immediate resistance / supply: 98.00 – 99.00 (daily rejection zone).
Invalidation for bearish view (daily close basis): daily close above 100.23 / decisive break and hold above 100.5–101 would flip bias.
Near-term support: 96.18 (first target / pivot).
Secondary targets if 96.18 breaks: 94.63, 93.67 then 89.62 as extended target on a strong bearish continuation.
Price-action scenarios
Bearish continuation (favored): Price respects the upper descending trendline, forms a daily rejection or bearish engulfing at ~98.0–99.0 → short with first target at 96.18, partial take at 94.63 if momentum continues.
Neutral / consolidation: Price oscillates 97–98.5, chopping in wedge — wait for a daily close below 96.60 or above 99.50 before taking directional trade.
Bullish breakout (less likely): Daily close above 100.23 with follow-through and volume would signal trend change toward 102+ — invalidate shorts and look for long setups only after retest.
In Summary
Trend: Bearish within a descending wedge.
Resistance: 98.50 → 99.00 → 100.23.
Support: 96.18 → 94.63 → 93.67 → 89.62.
Long-term bias: As long as 99–100 zone is not broken decisively, DXY is likely to head lower toward 94–90 levels in coming months.
Risk factor: Only a macro-driven breakout above 100.23 would invalidate the bearish outlook and shift momentum toward 102+.
One-line Conclusion
Daily bias = bearish while price stays under the 98–100 supply zone; preferred approach is to short on daily rejections or after a break+retest of 96.18, with extended targets at 94.6 → 93.7 → 89.6, and clear invalidation only on a daily close above ~100.23.
Note
Please risk management in trading is a Key so use your money accordingly. If you like the idea then please like and boost. Thank you and Good Luck!

DXY BUYING SETUPmarket trend in daily time-frame and lower time-frame is uptrend
formation of dimunation in 4hrs time-frame
there was a impulsive movement before correction

DXY idea We expect the Monday low to be sweeped to then continue in the HTF direction. A more HP setup will be if the sweep will be done on 4h Timeframe thru fvg higher after sweeping.
So we just wait. We let the price developing.
The setup is also valid if we continue higher directly without sweeping, but instead creating new 4h fvg higher.

Dollar Index: The Calm Before the Storm?The Dollar Index has been stuck in a tight range, but don’t mistake sideways trading for stability.
Behind the scenes, traders are torn — weaker economic data and the prospect of a shutdown argue for a softer dollar, while global demand for safe havens keeps a firm bid under the greenback.
That tug-of-war has kept DXY consolidating near recent highs, almost like a coiled spring waiting for a breakout.
When Washington sneezes or the Fed shifts tone, the dollar won’t drift — it will lurch, and the next move could set the tone for every major market this quarter.

Dollar Index analysis at the start of the weekThe overall trend of the Dollar Index is still bearish, and today after the market opened it dropped again from a key support level. On the lower timeframe it looks bullish, but on the higher timeframe this could just be a correction

U.S. Dollar Index (DXY)- Daily Timeframe Analysis 🔎 Market Structure
The Dollar Index (DXY) remains in a bearish market structure, forming consistent lower highs and lower lows. Price action is currently reacting within important Fair Value Gaps (FVGs), which often act as magnet zones for liquidity and corrective moves before resuming the primary trend.
---
🟪 Higher-Timeframe Fair Value Gaps
April FVG (Purple Box): Price previously filled part of this imbalance but failed to sustain a bullish continuation. This reinforced bearish order flow.
September FVG (Blue Box): Price recently tapped into this imbalance, where sellers may look to re-enter the market.
---
📉 Bearish Reaction Zones
99.000 – 100.000 (Red Box): A critical supply zone aligning with the upper boundary of the blue fair value gap. If price retests this region, strong rejection is likely.
Current price around 97.96 suggests the market is already reacting to this supply/FVG area.
---
🔮 Directional Bias
The broader expectation is for the DXY to form a new lower high before resuming bearish momentum.
Two possible scenarios are highlighted:
1. Rejection directly from the current FVG zone (97.9 – 99.0) → continuation lower.
2. Slight extension into the upper supply zone (99.5 – 100.0) → liquidity grab → sharp bearish reversal.
Both paths suggest a downside move targeting 96.20 and potentially lower levels.
---
📌 Summary for Traders
Bias: Bearish
Key Resistance: 99.0 – 100.0 (FVG + Supply Zone)
Key Support: 96.20 (short-term target)
Expectation: Formation of a lower high, followed by renewed selling pressure.
⚠️ Note: Always confirm with confluence (macroeconomic data, USD pairs’ correlation, and risk management rules) before entering trades.

DXY: Bulls Are Winning! Long!
My dear friends,
Today we will analyse DXY together☺️
The recent price action suggests a shift in mid-term momentum. A break above the current local range around 97.541 will confirm the new direction upwards with the target being the next key level of 97.640 and a reconvened placement of a stop-loss beyond the range.
❤️Sending you lots of Love and Hugs❤️
