$DXY - Ballads of The Dollar (Q3/Q4 2025/26)TVC:DXY - Ballads of The Dollar
TVC:DXY
(Q3-Q4/2025)
(2026)
*** NOTE THAT THIS IS NOT FINANCIAL ADVISE !
PLEASE DO YOUR OWN RESEARCH BEFORE PARTAKING ON ANY TRADING ACITVITY BASED SOLEY ON THIS IDEA.
*Fundamental Summary
What to Watch out for :
-The Dollar Index ( TVC:DXY ) has recently retraced from mid-2025 highs as markets price an easing cycle for the Federal Reserve.
The Fed began cutting rates in 2025 and market pricing implies additional cuts through late-2025/early-2026.
That shift is the main near-term headwind for the dollar.
-The broad macro backdrop (slower global growth, easing inflation) supports a gradual AMEX:USD softening on average in 2026 — but risk events (hotter-than-expected inflation, geopolitical flight-to-safety, tariff shocks) could trigger episodic dollar strength.
+1
- Bank/Strategy Notes
(JPMorgan, market reports) show many Macro desks expecting some AMEX:USD weakness into 2026, but divergence in regional growth and rate paths keeps volatility and range trading likely.
+1
- Key current fundamentals and news drivers.
Fed policy path / rate cuts:
The OECD and market pricing expect more Fed easing (several 25bp cuts across late-2025 into 2026).
The magnitude and timing of cuts are the single largest driver for DXY.
A faster/larger easing path → weaker TVC:DXY ;
A delayed or shallower path → stronger OPOFINANCE:DXY.
+1
- U.S. GDP Growth & Labor data:
Slowing growth and softer payrolls increase rate-cut expectations;
any surprising strength in jobs or inflation would support the dollar.
+1
- Cross-Currency Central Bank Policies:
The European Central Bank, BoJ and others’ moves matter — if the ECB stops cutting or the BoJ tightens, that reduces one-sided USD weakening.
JPMorgan and other large banks note currency pairs (e.g., USD/JPY)
will be shaped by central bank divergence.
+1
- Global Growth & Inflation (IMF/World Bank):
Global growth is projected to remain modest in 2025–26.
Falling global inflation reduces the need for other central banks to keep rates high, which can compress rate differentials and weigh on USD upside.
+1
- Risk Sentiment(Geopolitics & Tariffs)
Episodes of risk-off (safe-haven flows) or trade/tariff headlines can push short-term USD strength even if the long-term trend is softer.
+1
- Data-Driven Events Risks:
watch out for U.S. CPI, PCE, non-farm payrolls and each FOMC statement/summary of economic projections — these are volatility catalysts that will determine whether the index follows the base case or a tail scenario.
Federal Reserve
+1
- Cross-Hedging:
If you expect the base-case mild USD weakening,
consider pairs where dollar weakness shows clearly (EUR/USD, AUD/USD, NZD/USD) or hedge with short-USD positions sized to risk tolerance.
If you fear tail-risk spikes, hold options or tight stop-losses because sudden rallies can be sharp.
TECHNICAL ANALYSIS :
- Charts show a macro Support/Demand zone ~96 (a historically important DXY floor) and a supply/resistance cluster around ~102–105 (multiple reaction highs).
That structure matches recent market commentary that the mid-90s acts as a key support and the low-to-mid-100s area is the principal resistance zone.
Use these bands to refeer as the primary range framework.
- Momentum/MA signals are mixed:
short-term pullbacks (to trendline/200-day EMA) are visible on several data summaries;
RSI/momentum in mid-2025 has shown episodic bullish runs followed by corrective phases—consistent with a choppy transition from a strong-dollar regime to a more range-bound market.
(Dovish / Hawkish tail risks)
Forecast — scenario framing and level ranges
Below we give a base case and two alternative scenarios
As presented expected TVC:DXY ranges (not precise dates) for the remaining part of 2025 (the next calendar quarter(s) from now) and for 2026.
-Best case-scnario (highest probability)
Fed cuts gradually; TVC:DXY drifts lower but remains range-bound
Q4 2025 (near term): TVC:DXY drifts toward 98–101 as markets price in further Fed easing and global risk appetite improves.
Occasional pullbacks to the 96–97 demand zone are possible on weak US data.
(Full-Year 2026)
Average 95–100 TVC:DXY , with the index oscillating between the mid-90s (95–97) on dovish surprises and re-testing ~100–103 on risk events or if other central banks disappoint.
This reflects expectations of a lower Fed funds rate by spring 2026 but still persistent inflation risk that keeps cuts measured.
- Dovish tail
(Fed cuts faster / Global resilience): AMEX:USD Weakens more
Q3 & Q4 2025:
Quick drop to 95–98 if the Fed signals a multi-cut path and U.S. real rates fall; EUR/JPY strength and reduced safe-haven flows accelerate the move.
2026:
TVC:DXY trades 92–97 on average.
This is the scenario many currency strategists price as the “USD softening” path if inflation cools quickly and global growth stabilizes.
- Hawkish tail
(Inflation Reaccelerates or Geopolitical shocks): AMEX:USD reasserts
Q3-Q4 2025:
A surprise inflation uptick or risk shock pushes markets back to a higher DXY 101–106 zone (testing the resistance cluster shown on your chart at ~102–105).
2026:
Intermittent surges to 103–108 on episodic safe-haven flows or delayed Fed easing; average could still be mid-to-high-90s if the hawkish episodes are episodic rather than structural.
- Practical Trade / Risk Managment recommendations (tactical)
If you’re trading price action on your charts: use the 96 area as a high-conviction support/demand entry (tight risk) and 102–105 as the primary supply zone to consider fading rallies.
Your annotated zones and boxed consolidation areas are a good place to set stop levels and scale positions.
Trade ideas

DXYEVERYTHING is in the chart, I believe it is moving to the upside as the Bearish momentum comes to an end.


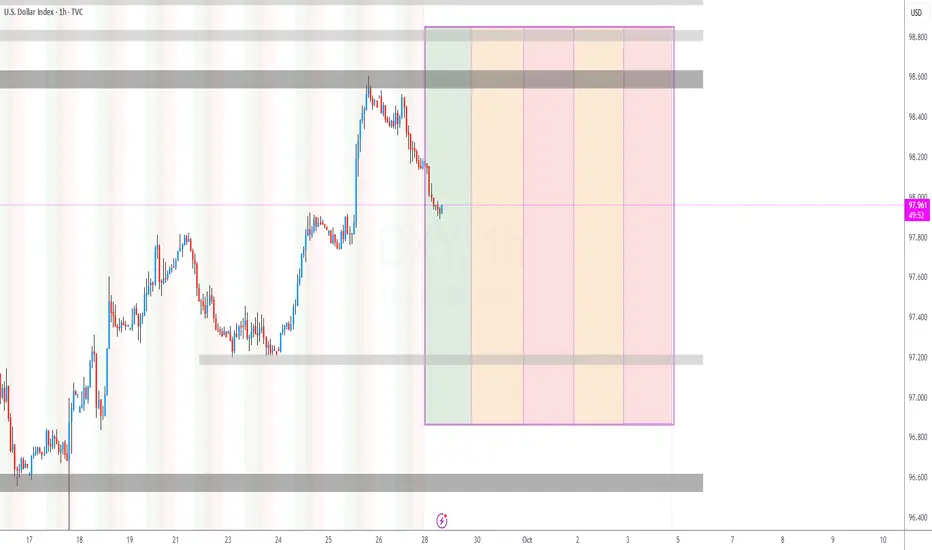
U.S Dollar Index (DXY) Bullish Reversal Setup – Targeting 98.913Previous Trend:
There was a strong upward move, forming a rising channel (highlighted in pink).
Price reached the upper boundary of the channel and then reversed downward.
Current Price Action:
Price broke below the midline of the channel and is approaching a potential support zone.
This zone is marked by a blue rectangle (support/demand area).
Trade Idea: Long Setup (Buy Position)
Entry Point: Around 97.862
Stop Loss: Around 97.665–97.679 (just below support zone)
Target Point: 98.913 (near previous high)
✅ Trade Rationale
Support Zone: The marked area has previously acted as a demand zone, likely to support price again.
Bullish Recovery Expectation: The idea is that price will bounce from this support zone and resume upward movement.
Good Risk-Reward Ratio:
Risk: ~20 pips (from 97.862 to 97.665)
Reward: ~105 pips (from 97.862 to 98.913)
Risk-to-Reward Ratio: ~1:5 — a favorable setup.
⚠️ Cautions
Price is still above entry level (98.020) — the setup assumes a pullback to the 97.86 area before buying.
If price breaks below 97.665, the setup would be invalidated (stop loss hit).
Channel Breakout Risk: Since the channel is already broken to the downside, this trade assumes a temporary dip before a rebound — which may or may not happen.
📌 Summary
Parameter Value
Entry 97.862
Stop Loss 97.665
Target 98.913
Risk-Reward ~1:5
Trade Direction Long (Buy)
Confirmation Needed Pullback to support zone

DXY (U.S. Dollar Index) – Bearish MomentumPrice is giving us signs of Bearish Momentum while respecting the larger descending channel structure, having recently tapped the upper trend line with a strong rejection.
Expecting:
A lower time frame correction to confirm continuation.
Targeting 90% if price breaks impulsively to the downside.
If price taps into our area of interest, we might expect a potential bullish reversal, depending on price action and correction quality.
Let price do the work, wait for the correction before entering short.

DXYU.S Dollar Index
- Bearish Channel as an corrective pattern in Short Time Frame
- Fair Value Gap
- Order Block
- Change of Characteristics
- Completed " 123 " Impulsive Waves

DXY update (29/09/2025)The upper rail of the descending parallel channel channel is waiting to be confirmed.
What matters is the fib target and bottom rail intersection. But most importantly is the bottom rail intersection.
Looks like it will be an aggressive dump.
Not financial advice

DXY outlook for the current week (WC29/09/25)DXY key levels to look out for this week, taking into consideration of manufacturing PMI, ADP & NFP
DXY We looking for the dollar to be bullish as its still in a bullish momentum resulting in buying opportunities|1H TIMEFRAME

Dollar Faces Major Golden Ratio CorrectionRecent GDP data puts the dollar into uptrend(rise from 3.3% to 3.8% ) reaching around 98.7 and hit a Major Fibonacci 0.618 Correction and Multi-month highs.
The Dollar can be expected to correct at the 0.5 ratio (around 97 ) of the recent trend along with the trendline. If the dollar sentiment is to follow the rate cuts, we will see the dollar to the downside and stocks, crypto and commodities to the upside.
The Fed has recently announce a possibility of two more rate cuts happening this year Q4 of 2025. The cut is stays at 25 bps rather than the expected 50 bps . Some investors say it is not enough to bring positivity to the market.
Traders, what are your thoughts?

Bearish drop?The US Dollar Index (DXY) is reacting off the pivot which aligns with the 61.8% Fibonacci retracement and could drop to the 1st support which acts as a multi-swing low support.
Pivot: 98.63
1st Support: 96.61
1st Resistance: 100.19
Disclaimer:
The above opinions given constitute general market commentary, and do not constitute the opinion or advice of IC Markets or any form of personal or investment advice.
Any opinions, news, research, analyses, prices, other information, or links to third-party sites contained on this website are provided on an "as-is" basis, are intended only to be informative, is not an advice nor a recommendation, nor research, or a record of our trading prices, or an offer of, or solicitation for a transaction in any financial instrument and thus should not be treated as such. The information provided does not involve any specific investment objectives, financial situation and needs of any specific person who may receive it. Please be aware, that past performance is not a reliable indicator of future performance and/or results. Past Performance or Forward-looking scenarios based upon the reasonable beliefs of the third-party provider are not a guarantee of future performance. Actual results may differ materially from those anticipated in forward-looking or past performance statements. IC Markets makes no representation or warranty and assumes no liability as to the accuracy or completeness of the information provided, nor any loss arising from any investment based on a recommendation, forecast or any information supplied by any third-party.

DxyI want to see dxy to drop in price till mid of this week, in order to activate sell bias in most of Usd major pair and some cryptos

DXY to come lower then go long Clear demand zone labelled.
Clear potential FVGs need filling
Clear liquidty to target

DXY DOLLAR INDEX What is the DXY?
The DXY (U.S. Dollar Index) is a weighted index that measures the value of the United States dollar (USD) relative to a basket of six major foreign currencies: the euro (EUR), Japanese yen (JPY), British pound (GBP), Canadian dollar (CAD), Swedish krona (SEK), and Swiss franc (CHF). The euro has the largest weight in the index, around 57.6%, making it the most influential currency in the DXY.
The DXY provides a broad gauge of the USD’s international value and is frequently used by traders and analysts to assess dollar strength.
Correlation of DXY with US10Y (U.S. 10-Year Treasury Yield)
The U.S. 10-year Treasury yield (US10Y) and the DXY often have a positive correlation.
Higher US10Y usually signals stronger U.S. economic growth and/or expectations of higher Federal Reserve interest rates, making U.S. Treasury securities more attractive to investors. This leads to increased demand for USD, causing the DXY to strengthen.
Rising yields increase the return on dollar-denominated assets, attracting capital inflows and boosting the dollar’s value relative to other currencies.
Conversely, when US10Y falls, it often indicates weaker economic sentiment or looser monetary policy, which tends to weaken the dollar and lower the DXY.
Strength of the U.S. Dollar and DXY Relationship
The DXY directly reflects the strength or weakness of the U.S. dollar in the global forex market.
A rising DXY means the USD is strengthening against other major currencies, indicating increased purchasing power and greater global dollar demand.
A falling DXY implies the USD is weakening, reducing its relative value versus other currencies.
The DXY is impacted by the interest rate differentials, economic growth expectations, geopolitical events, and risk sentiment affecting capital flows in and out of the U.S.
The DXY is a key barometer for the dollar’s relative strength, and its movement often aligns with changes in US10Y due to the economic and yield attractiveness
IF THE INDEX CORRECTS IN THIS WEEKLY CANDLE EXPECT A LONG POSITION .
WATCH EURUSD,AUDUSD,GBPUSD,USDJPY.
#DXY #US10Y

dxy xau opportunity dxy looking like a long and xau will short itself to the shitter fyi thats about it cuh look at the bearish fvg and break of trend neckline that is showed with my painting skills

DXY - FROM THE WEEKLY CHART TO THE H4 CHART - WHAT TO EXPECTThe DXY Index has been going up since Jerome Powell speech after FOMC on 17 September 2025 and has continued its bullish trend since then, looking at the weekly chart this may be headind to an important resistance in the 101.395 area if the index succesfully breaks the 100.040 level of resistance, data will dictate its next move
I expect the index to test the 97.700 - 97.500 level of support early in the week and raise gradually to 100.040
Once there we have the following options:
- Poor usd data = selloff of the index on the way to the previous lows
- Strong usd data = break of the 100.040 level of resistance and the index reaching the weekly resistance 101.395
BE REACTIVE AND NOT PREDICTIVE

US Dollar Flexes, Look For on 99.05Sunday War Map –
A weekly candle this strong leaves a mark. The dollar printed a 96.77 low to 98.18 high—a full-bodied bullish bar that demands respect.
Macro
This week is stacked with U.S. data that can shake the pullback narrative:
Tue 30 Sep – JOLTS & Consumer Confidence: first look at hiring demand and household mood.
Wed 1 Oct – ISM Manufacturing PMI: factory pulse and price pressures.
Thu 2 Oct – Durable Goods & Trade Data: capital-expenditure clues.
Fri 3 Oct – Non-Farm Payrolls & Hourly Earnings: the heavyweight. A hot jobs print could delay the December Fed-cut story (futures still price ~70% odds).
Technical Targets
Expect an early-week pullback as traders digest that massive weekly bar.
Two liquidity pools we’ve tracked for months were cleared last week; two upside targets still in play 98.2 and 98.3 remain before the chart reaches a true “bearish-range discount.”
Keep eyes on the 99.05 volume node—a well-defined supply zone where cross-market reactions (EUR, gold, crypto) could spike.
The dollar controls the tempo. Wait for the market to come to your levels; don’t chase the last candle.

DXYDXY is in correction and can give us some more sideways before any push up.
Disclosure: We are part of Trade Nation's Influencer program and receive a monthly fee for using their TradingView charts in our analysis.

DXY outlook from 29th sept to 3rd oct 2025The DXY has shown signs of longs even when the FED cut rates. the last quarter may actually be bullish for the US dollar.
it has been forming large buy candles on the daily timeframe in the previous week. this may not be a sign that we are bullish but also the market has failed to close below the FVG on the weekly time frame from July ever since it traded into it.

DXYThe Dollar Index (DXY) is currently rising within a flat corrective structure. Wave C may complete around the 100 zone, which serves as a key resistance level. Once this area is reached, a strong bearish reversal could follow. Traders should be cautious of potential exhaustion in the upward move and prepare for selling opportunities once confirmation appears.

Dollar Index Holding Up But GBPUSD Might Change That...Dollar = Relative Game, Not Absolute
Dollar Index isn’t just the USD — it’s USD vs a basket (mainly EUR, JPY, GBP).
If the Fed cuts but ECB, BOE, and BOJ are also leaning dovish, the relative advantage doesn’t change; USD stays steady.
The dollar has been consolidating because macro signals are mixed (Fed easing vs US resilience, inflation uncertainty, global growth divergence), and the euro/yen/GBP balance out.
The market is waiting for a clear catalyst — usually a Fed decision, inflation report, or geopolitical shock to break the range.

$DXY longsFor next week I’ll be focusing on dollar longs since we got a 4H swing trend BOS and a lot of descending highs left open.
Favoring positions on #EURUSD and #GBPUSD.
Will keep you updated. #FOREX

DXYThe U.S. Dollar Index (DXY) maintains a bearish bias after breaking key support levels. Markets are pricing in a less aggressive Fed, mixed economic data, and rising risk appetite, all of which limit demand for the USD as a safe haven.
🔑 Key Factors
Monetary policy: The Fed no longer shows the hawkish tone of 2022–2023; rate cuts are expected in the coming quarters, reducing the dollar’s appeal.
Macro data: Inflation is more under control and signs of economic cooling → fewer arguments to keep rates high.
Market sentiment: Flows into stocks and crypto reflect greater risk appetite, reducing USD demand.
External factors: The ECB and BoJ are showing signs of tightening → the interest rate differential with the U.S. narrows, cutting the dollar’s advantage.
