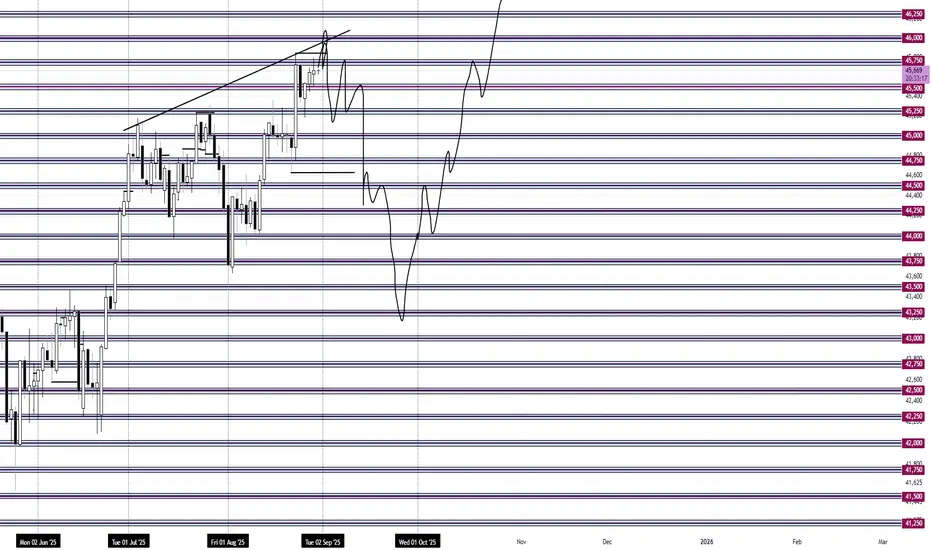
September Gameplan Down Month To Sweep Lows B/O ATHsSeptember I am going to look for bearish trades in line with these three peak wedge formations.
I am looking for 46,000 to possibly be the high of month
What I am seeing is a build up before the break out of all time highs. I believe the market will make one more dip down to the 43,000 area before the breakout.
The biggest clue was August 22nd's exhaustion bar.
Another huge clue is the start of September is a holiday at the top of the wedge and the start of a new month. New Month, New Timing Cycle.
How I will be playing September:
I will limit myself up to only 10 trades
One trade per Daily Candle when Initiating a trade
120 tick stops
480 tick targets
4 to 1
Hold overnight until stop or target is hit
Aim for a 40% win rate
4 wins 4*4=16
6 losses 6*1=-6
Net +10R
DJIAM2025 trade ideas
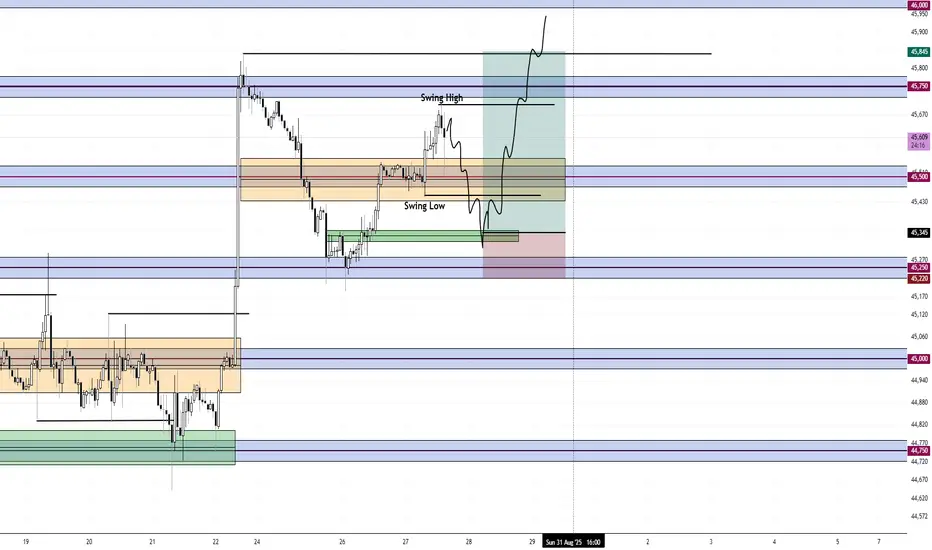
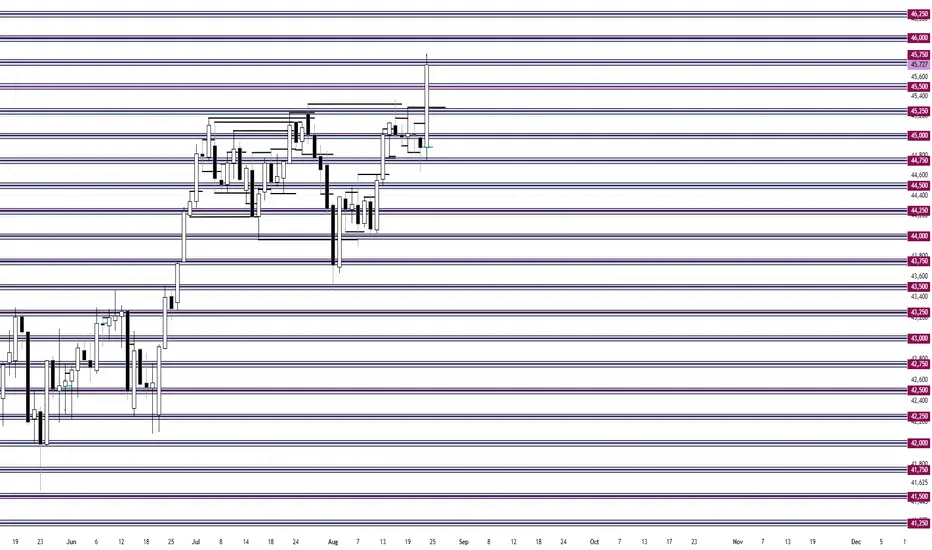
Mean Reversion Support at 250. Long 4 to 1Price is mean reverting around 500, this much is plain obvious. I will look for a support entry near 250 area.
125 tick stop
500 tick target
4 to 1 Risk Reward
The orange box is the middle of the range. I.E. the slaughterhouse.
Swing highs and lows formed near the middle get taken
I am expecting the break of the highs and for price to hit 46,000
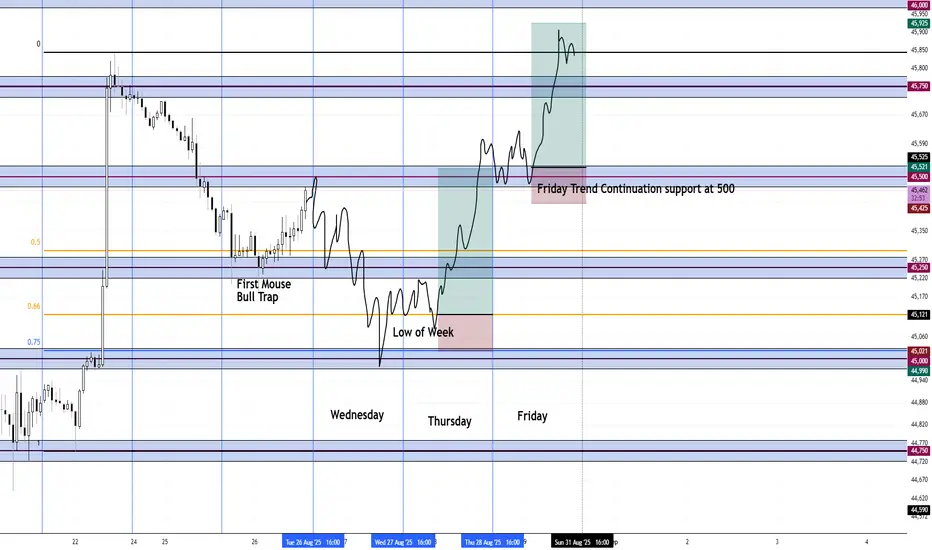
Pullback into 45,000 Long 3 bars down plus gaps
I am looking for a pullback into the 75% retracement area that also coincides with 45,000. Round numbers being double zeros.
I am expecting Wednesday to also be a down day.
The trade Long, I am expecting it to be on Thursday with Friday being another Long continuation day to finish the month out strong.
These are my two trade Ideas for both 4 to 1 opportunities.
Thursday low of week
Friday trend continuation
I am looking for the following price action circled in green to be the order flow needed to fuel the move back up. Creep lower into 45,000 getting shorts chasing down low for the reversal.
Big moves take time to setup and so I will be waiting.
selling pressure or lack or buying pressure presents breakout ?* looking at this pattern and pivot points we see a reduction of power from buyers, unable to push the market higher, while sellers then are logically stronger.
* buyers are currently holding the price point in the purple line marked, but they are less able to defend it with every attempt to break
what do I think will happen next?
* a break of the purple line and
a push downward by sellers seems likely simply by looking at the narrative shown by price.
* we have hidden bear divergence and we have a break of obv uprend showing sellers power increasing

Daytrading Risk Management Strategy Hold Until CloseAfter reviewing my past 500 trades, the absolute most profitable trade management is to hold until market close. If you study the daily chart, most days will close near the highs/lows of the bar.
By only using just a stop loss and no profit target, one can capture monster moves.
One trade per day, win or loss.
Wins will be small 1-2R wins or giant 3-8R wins
Losses will be small half R losses or simple 1R losses
5-10% of the trades should make up 90% of profits.
Most trading months offer around 8-10 really great setups on Dow Jones. The other 10-12 days should be on the sidelines in cash, waiting.
To really stay in the game, simple 1 or 2R wins WILL NOT cut it.
One has to pay for:
Small Losses
Commissions
Fees
Taxes
Spreads
End of Day Hold Until Close Trade Management maximizes profits and routinely produces 30-40R gains per month.
Go through your own past trades and see if holding until 4pm EST would have yielded substantially more profits vs what you have achieved with your current management. I know I did and I am floored.
Some Examples:
These are all trades that could have been taken. My point is if just using a simple 2 to 1, the profit would have been SUBSTANTIALLY LESS than Hold till Close.
Creeping Trend Into 750. Thursday Long Opportunity. My gameplan Thursday is to see how this creeping trend plays out. I am looking for the creeping trend to layer down into 750 near the lows of these 8 Hour candles.
Price is mean reverting around the 1000 level
Creeping trends resolve themselves in one of two ways. They capitulate and blow off in the direction of the trend or they reverse
Below I have outlined my entry criteria and I will see how price behaves at my level. If Long, I am targeting that swing high for roughly 380 ticks.
I will give an example of a creeping trend:
Another example:

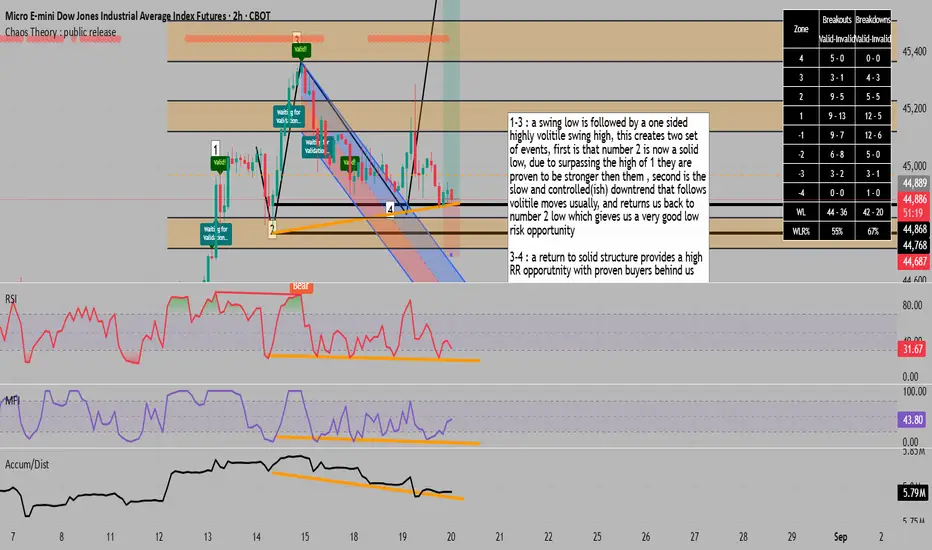
a return to solid solid structure affords =BUYers a cheap entry 1-3 : a swing low is followed by a one sided highly volitile swing high, this creates two set of events, first is that number 2 is now a solid low, due to surpassing the high of 1 they are proven to be stronger then them , second is the slow and controlled(ish) downtrend that follows volitile moves usually, and returns us back to number 2 low which gieves us a very good low risk opportunity
3-4 : a return to solid structure provides a high RR opporutnity with proven buyers behind us
* what do I think will happen ?
* if the current bar goes higher than the previous, making a higher high in the lower fractal structure, I would like to see the next leg up
* if we fail to do so and continue down, I could see us having a decently volitile run down to the support at the higher fractal structure
* as far as divergence goes : we have hidden divergence on all 3 of
RSI, MFI and accumulation/distribution indicators
* MFI and RSI are also oversold which is a good indication here as price action is not too volitile, so its a good signal
* using the chaos theory indicator we can see that over the past 2,500 bars, if price closes above a zone we have a 55% chance it will go to the next zone on that way, this is better than a coin flip but not by much, it does give us a chance to break even once we pass one of the zones , because if price comes back down we have a 67% chance of coming back to the genesis of the trade, which I don't particularily like.
downtrend resumption opportunity presents itself * price returns to vwap and previous support, which might be support turned resistance
* what do I think will happen next ?
* if it pulls back from the vwap which price does like to do alot and pushes below the micro downtrend, we could see a continuation to the downside from here
* vpoc behind us if price pushes below
with those orders then being sell orders
logically

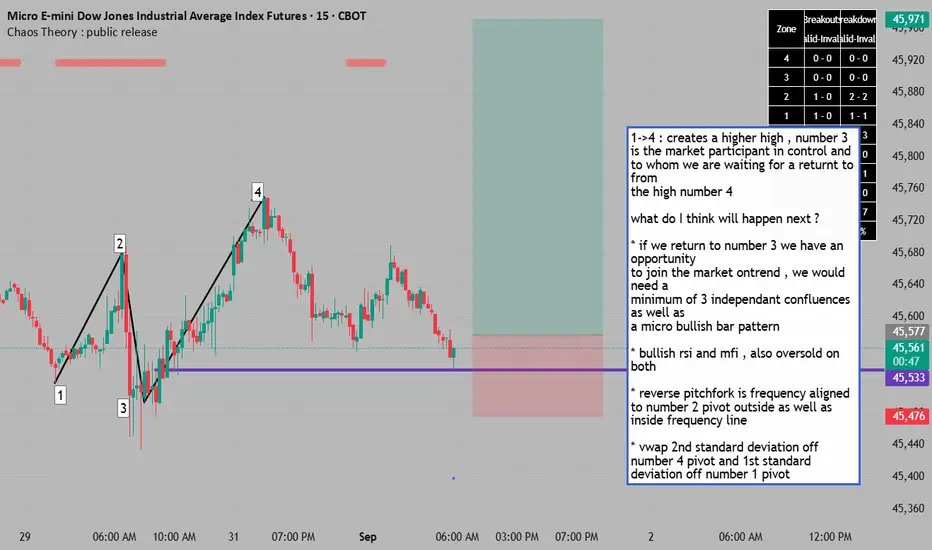
return to major buyers presents an on trend continuation entry1->4 : creates a higher high , number 3
is the market participant in control and
to whom we are waiting for a returnt to from
the high number 4
what do I think will happen next ?
* if we return to number 3 we have an opportunity
to join the market ontrend , we would need a
minimum of 3 independant confluences as well as
a micro bullish bar pattern
* bullish rsi and mfi , also oversold on both
* reverse pitchfork is frequency aligned to number 2 pivot outside as well as inside frequency line
* vwap 2nd standard deviation off number 4 pivot and 1st standard deviation off number 1 pivot
DOW JONES-MARKET PREDICTION-Sept 1st-LONGSThe month of August created a new high, looking for Sept to continue the Trend, a new resistance level may be created and the market trades to the sellside.

US30/Dow Jones Dow Jones (US30) showing signs of exhaustion. Defensive sectors can’t hold the weight of rising yields, softening industrials, and fading consumer strength. Lower highs + weak momentum = cracks forming. This isn’t just noise — it’s a warning.

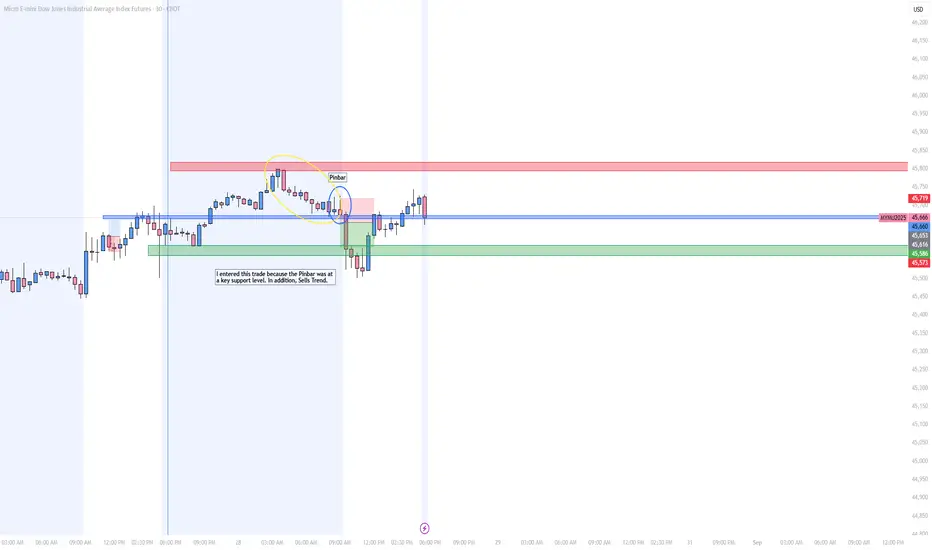
08/28 Sell How to Use Pin Bars.Well as you can see the trend was bearish so
I was looking for sells. In addition, the pin bar formed at a key level and I entered after it broke the support level.
1. Variation: Yellow ( Trend): The trend is bearish so look for sells
2. Wick Rejecting the Upside: Pin Bar in Blue. I needed this wick to put my SL and confirm the upside is being rejected
3. I entered after it broke with a lot of power.
Key Notes: Pay attention to demand and supply levels and specific set ups in those areas.
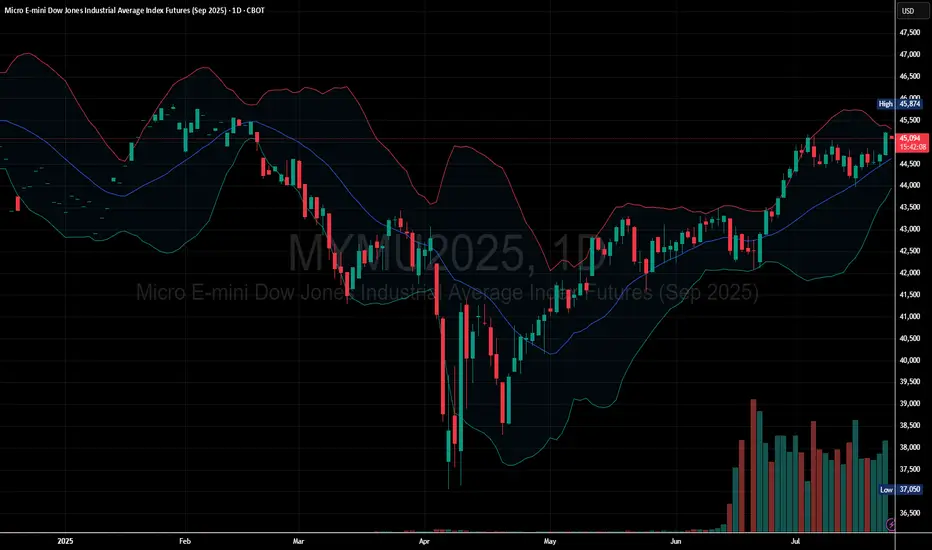
Buyers Dominate as Dow Micro Futures Push Higher
Price Above Moving Average: The current price is trading above the midline of the Bollinger Bands, showing bullish momentum.
Bands Expanding Upward: The Bollinger Bands are sloping upward, indicating increasing volatility in the direction of the trend.
Price near Upper Band: Price is near or hugging the upper band, which often signals strong bullish continuation.
Immediate Support: Around the middle Bollinger Band (~44,500 zone).
Next Resistance: Near recent highs around 45,100 – 45,200 area. If broken, this could trigger a breakout continuation.
DJIA – U.S. Stock Market Corrects UpwardTrend: Upward correction after rejection from 45,220.0.
Current price: 44,794.0.
⸻
Bullish scenario
• Entry: BUY STOP 45,280.0
• Target: 46,480.0
• Stop: 44,800.0
Bearish scenario
• Entry: SELL STOP 44,190.0
• Target: 42,880.0
• Stop: 44,800.0
⸻
Key levels
Support: 44,190.0, 42,880.0
Resistance: 45,280.0, 46,480.0
Indicators
• EMA (Alligator): still pointing upward, but narrow range.
• AO histogram: correctional bars just below zero.
⸻
📌 Breakout above 45,280.0 → continuation to 46,480.0. Failure and close below 44,190.0 → decline toward 42,880.0.

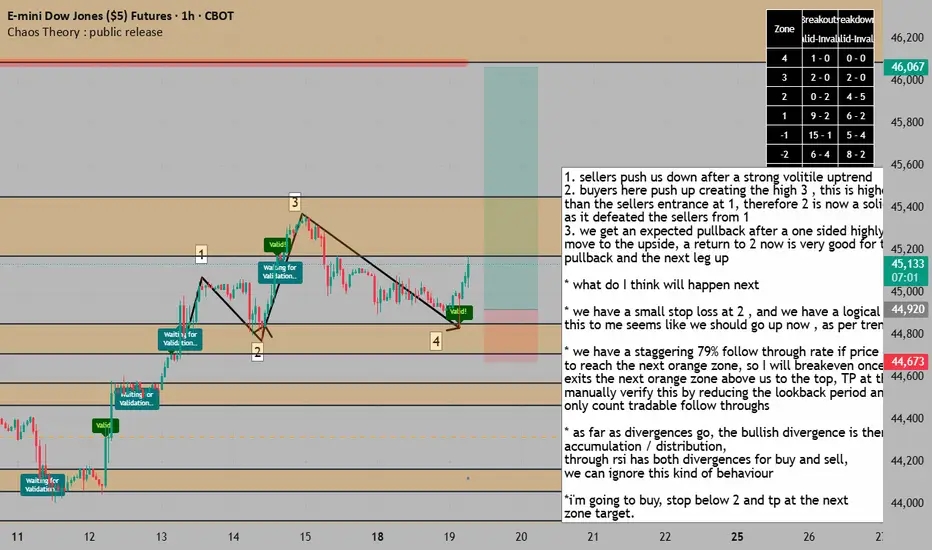
a return to solid support with bullish activity = BUY 1. sellers push us down after a strong volitile uptrend
2. buyers here push up creating the high 3 , this is higher
than the sellers entrance at 1, therefore 2 is now a solid low,
as it defeated the sellers from 1
3. we get an expected pullback after a one sided highly volitile
move to the upside, a return to 2 now is very good for the end of the
pullback and the next leg up
* what do I think will happen next
* we have a small stop loss at 2 , and we have a logical pullback at 3 ,
this to me seems like we should go up now , as per trend.
* we have a staggering 79% follow through rate if price closes on one side,
to reach the next orange zone, so I will breakeven once price
exits the next orange zone above us to the top, TP at that target. You can
manually verify this by reducing the lookback period and counting. we only count tradable follow throughs
* as far as divergences go, the bullish divergence is there for mfi and accumulation / distribution,
through rsi has both divergences for buy and sell,
we can ignore this kind of behaviour
*i'm going to buy, stop below 2 and tp at the next
zone target.
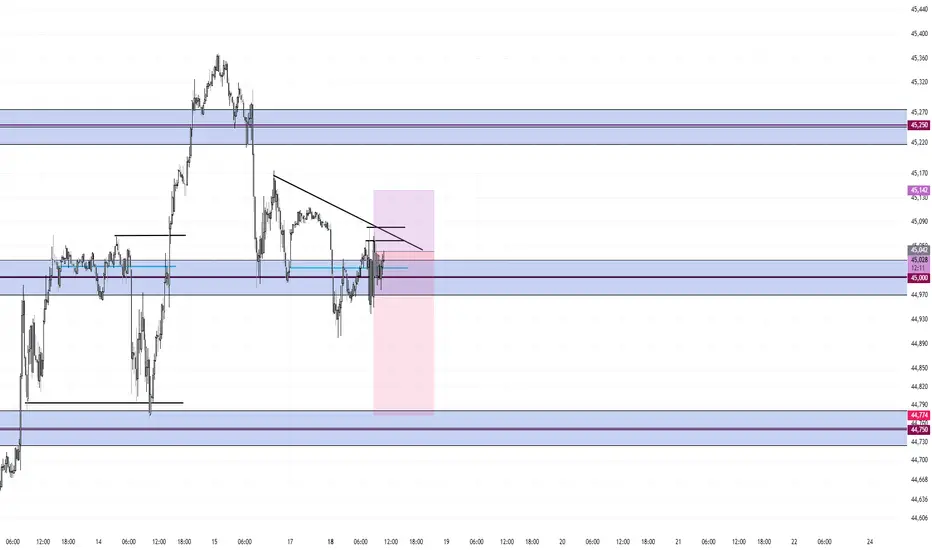
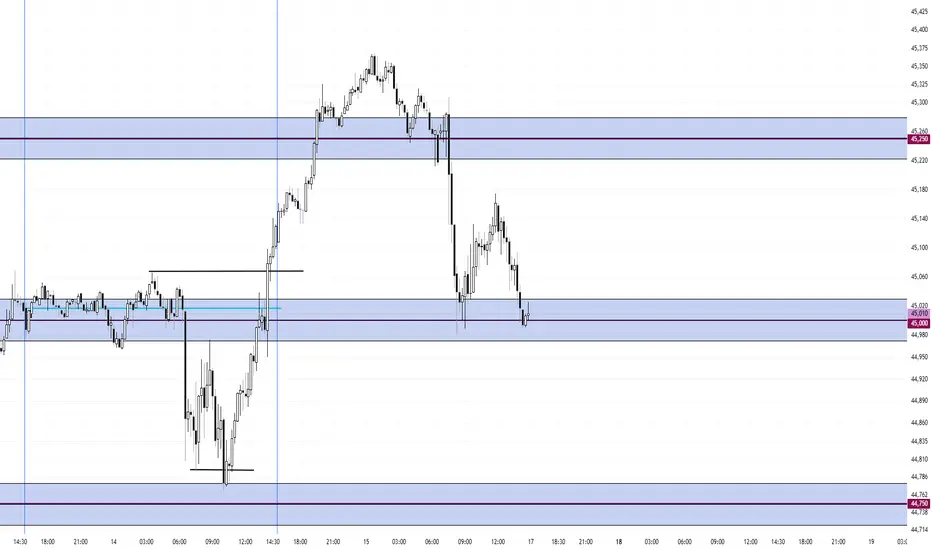
Mean Reversion Around 00's Short Down to 750I am short at 45,042 after the close of a fat green bar. My bias is down and so I sell into bull bars.
Price is currently mean reverting around 45,000 with the peak formation high above 250. I am looking for price to go down to the next level at 750.
I am using a 100 tick stop and a 265 tick target
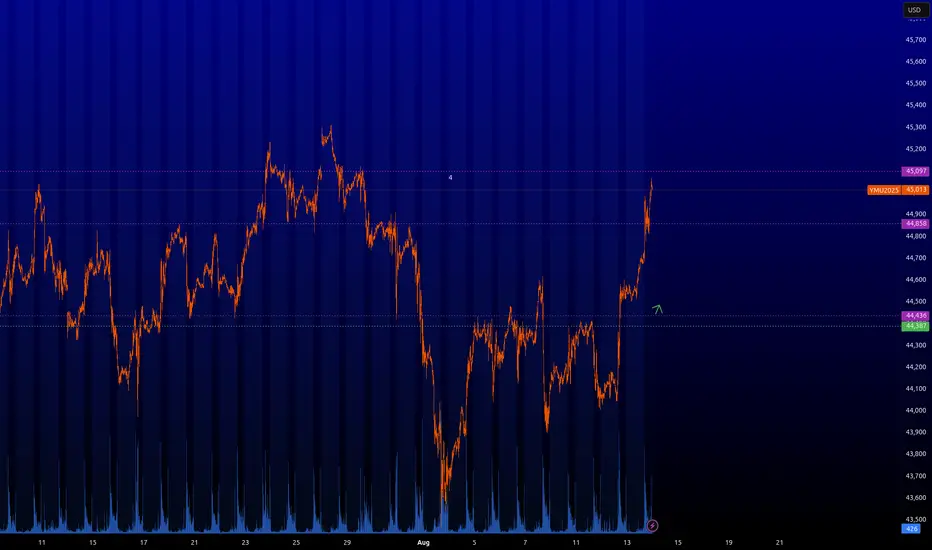
YM-DOW JONES-PREMARKET ANALYSIS-WEEKLY SELLMarket reacted off of higher time frame resistance, taking out previous week of July 28th liquidity, expecting sell off for the upcoming week.

Weekly Outlook. Index Triad. $ES $NQ $YM. 17.08.2025, SundayCME_MINI:ES1!
CME_MINI:NQ1!
CBOT_MINI:YM1!
Looking for a Weekly Power of Three on NQ ES and YM. A push down towards discount levels and again a massive push up towards new All Time Highs

Setup Saturday Backtesting Templates Today I will be going over a setup that I am finding and am liking. It is a mean reversion; Low of the Day Buy Setup to take out the High of Day.
I want to trade like Mcdonald's with each setup being a cookie cutter formula. It is either there, or it isn't. I don't want to guess direction or trade movement. I want a simple setup that repeats itself regularly.
I am going over my playbook of setups and simplifying my entire process to 3-5 buys and 3-5 sells.
Today's setup is LOD Range Back to HOD:
This setup has a certain behavior it follows for each of the "sections" of the setup
1. Opening of the Daily Candle
2. Formation of the Initial High of Day
3. The Dump
4. Setting up of the Low of Day
5. The Entry
6. The Pump
7. Where to Place Stop
8. Where to Place Target
I have given multiple examples of the same setup with minor variations and across different instruments. This is a New York setup that occurs roughly an hour or two after it NY opens. This is not something that occurs in Asia or London.
In Summary:
This is a range trade, mean reversion that takes place late in the NY session. It requires the entire day to setup and has specific parts that behave the same. Look for the initial high of day to form and the dump prior to NY. Wait until NY puts in the Low of Day and enter with small doji candles. Target the High of Day.
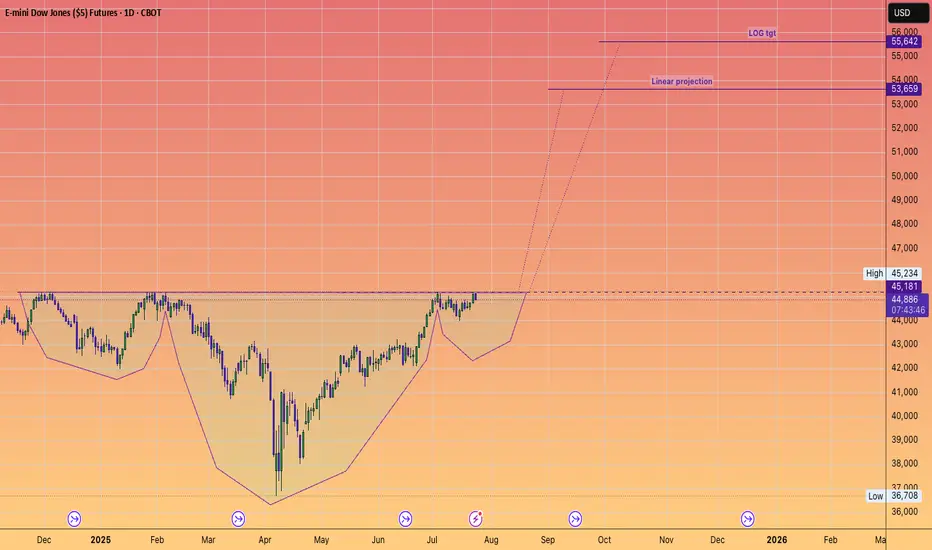
DOW JONES to 55,642#InverseHead&Shoulders
Projects record new highs.
Another stepping stone to our long held forecast of 64,000
Why?
Because AI will significantly contribute to an EXPANDING #GDP
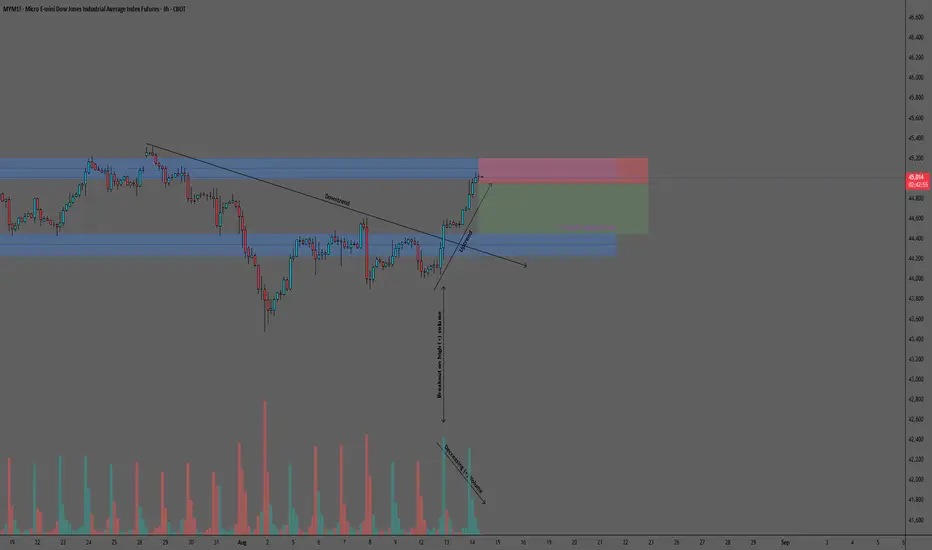
MYM (Micro Dow Jones Index Futures) Trade Setup – 3H TimeframeMYM: Bearish Setup at Major Resistance with Fading Bullish Momentum
MYM has recently broken above the 44,230–44,450 support-turned-resistance zone and the downtrend line originating from its July 28, 2025 all-time high. This bullish move, triggered in part by the August 12 major news release, extended into the 45,000–45,200 resistance area—a historically strong supply zone.
The 3-hour chart highlights that, while the breakout was fueled by strong initial volume, the subsequent advance toward resistance has been accompanied by gradually declining positive volume. This pattern suggests waning buying pressure and a potential shift in control toward sellers at current levels.
Illustrative Setup: A Sell Stop order at 44,960 positions the entry just below the psychological 45,000 mark, aiming to capture a reversal from the current resistance zone. A Stop Loss at 45,200 is placed above the upper boundary of resistance, providing a clear invalidation point for the bearish thesis. The Take Profit target at 44,450 aligns with the top of the nearest support zone (44,230–44,450), offering an attractive 2.13:1 reward-risk ratio.
Key considerations: The confluence of a major resistance zone and fading bullish volume provides multiple technical factors supporting a pullback scenario. However, given the psychological weight of the 45,000 level, some consolidation may occur before any decisive move. Traders should closely monitor price behavior at resistance for confirmation and remain mindful of broader market sentiment.
This analysis is provided solely for educational and entertainment purposes and does not constitute any form of financial or investment advice. Always manage your risk and trade responsibly.
YM : Long levelThe level has been activated, so you can buy it. I have slightly edited it since last time. It is best to scalp or pip it; I cannot promise any significant movement. Be careful when trading on news or at market close/open.
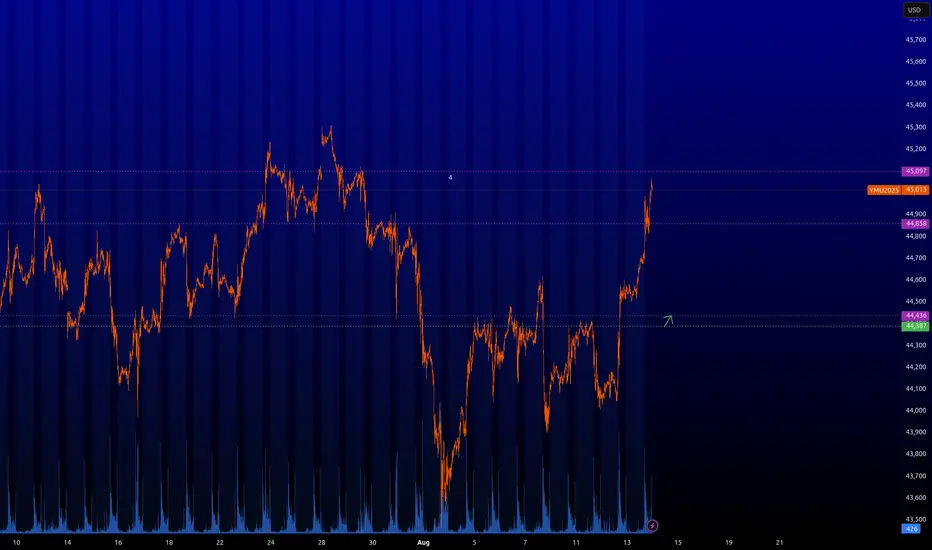
YM : Long levelThe level has been activated, so you can buy it. I have slightly edited it since last time. It is best to scalp or pip it; I cannot promise any significant movement. Be careful when trading on news or at market close/open.