BKG LongPrice going into attractive buying zone
Major catalyst - chancellor announces more support for first time buyers (5% mortgages should become more common)
Price decline has been part of a broader market correction (no specific company / industry news that provides clear rationale for the stock to be
Next report date
—
Report period
—
EPS estimate
—
Revenue estimate
—
0.95 USD
489.28 M USD
3.18 B USD
About Berkeley Group Holdings plc
Sector
Industry
CEO
Richard James Stearn
Website
Headquarters
Cobham
Founded
2004
ISIN
US08425P3029
FIGI
BBG000JT7H73
Berkeley Group Holdings Plc engages in the development of residential and mixed-use properties. It operates through the following brands: Berkeley, St. James, St. George, St. Edward, St. Joseph, and St. William. The company was founded by Anthony William Pidgley and Jim Farrer in 1976 and is headquartered in Cobham, the United Kingdom.
Related stocks


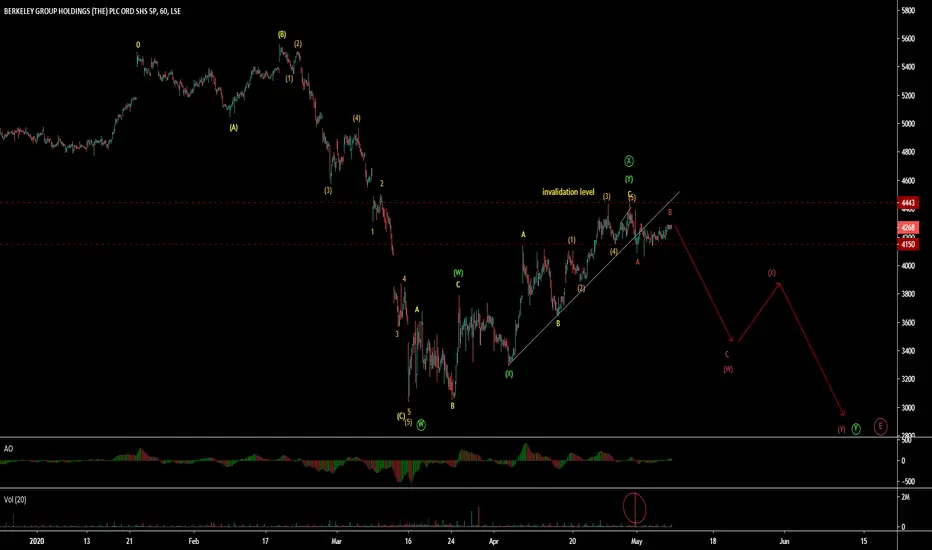
Berkeley Group Holdings PLC (BKG - LSE) - WXY wave patternBerkeley Group Holdings PLC (BKG - LSE) is in WXY complex correction pattern. W is elongated zigzag followed by X wave as double three correction, which is over. Y wave down is in progress which dropped with large volume. Wave B is about to over.

BKG Consolidation Buy RR 5:1Berkeley group holdings has formed a new resistance level @ 3837 and is consolidating in the range of 3717 - 3837, this is tight consolidation which will lead to momentum upwards once it breaks resistance.
My game plan would be the following:
Trigger Price: 3837
TP: 4344
SL: 3717
RR: 5:1

BKG Inverse Head & Shoulders BuyBKG Has formed an inverse head and shoulders pattern with a resistance of 3751. There's also been some tight consolidation leading to a breakout, which is over the 50 day SMA. 14 day SMA was acting as resistance but is now support and the 7 day SMA is making a bullish move and almost taking over the

Berkeley Group Pulls BackThis stock is featuring for the first time on our TradingView blogs.
Current setup: Price is currently performing a pullback.
Conclusion: We should wait for price to find support and head back to the upside. Long trades can be considered after a break of the resistance level. Stay patient and let


Berkeley Group - bearish break from rising wedge, bearish div. Bearish break from the rising wedge pattern coupled with a bearish RSI divergence suggests the share price could test the 50-DMA support at 3171 in the next few days.

Levels ahead of earnings #BKG #FTSE #UKshareThe 3000 level has been imports and if earnings are good look for a break, if not we are down to the 2900 value area at least

See all ideas
Summarizing what the indicators are suggesting.
Neutral
SellBuy
Strong sellStrong buy
Strong sellSellNeutralBuyStrong buy
Neutral
SellBuy
Strong sellStrong buy
Strong sellSellNeutralBuyStrong buy
Neutral
SellBuy
Strong sellStrong buy
Strong sellSellNeutralBuyStrong buy
An aggregate view of professional's ratings.
Neutral
SellBuy
Strong sellStrong buy
Strong sellSellNeutralBuyStrong buy
Neutral
SellBuy
Strong sellStrong buy
Strong sellSellNeutralBuyStrong buy
Neutral
SellBuy
Strong sellStrong buy
Strong sellSellNeutralBuyStrong buy
Displays a symbol's price movements over previous years to identify recurring trends.