Indra Secures 100% of Spanish Defense CreditsIon Jauregui – Analyst at ActivTrades
The Indra Group (AIR.MC) has become the major player in the Spanish defense sector by securing the entirety of the new €4.7 billion loans that the Ministry of Industry and Tourism will allocate to ten Special Modernization Programs (PEM). These funds, granted a
1.22 USD
300.21 M USD
5.24 B USD
About Indra Sistemas, S.A. Class A
Sector
Industry
CEO
Jose Vicente de los Mozos
Website
Headquarters
Alcobendas
Founded
1992
ISIN
US45579R1068
FIGI
BBG000DGKNS6
Indra Sistemas SA operates as a holding company, which engages in providing information technology products and services. It operates through the following business segments: Defence, Air Traffic, and Mobility. The Defence segment provides development of radars, air defense, and on-board systems for air and naval platforms. The Air Traffic segment offers programs to air traffic managements in Europe. The Mobility segment deals with the development of ticketing solutions, railway management systems and program for urban and interurban traffic management. The company was founded in 1992 and is headquartered in Alcobendas, Spain.
Related stocks
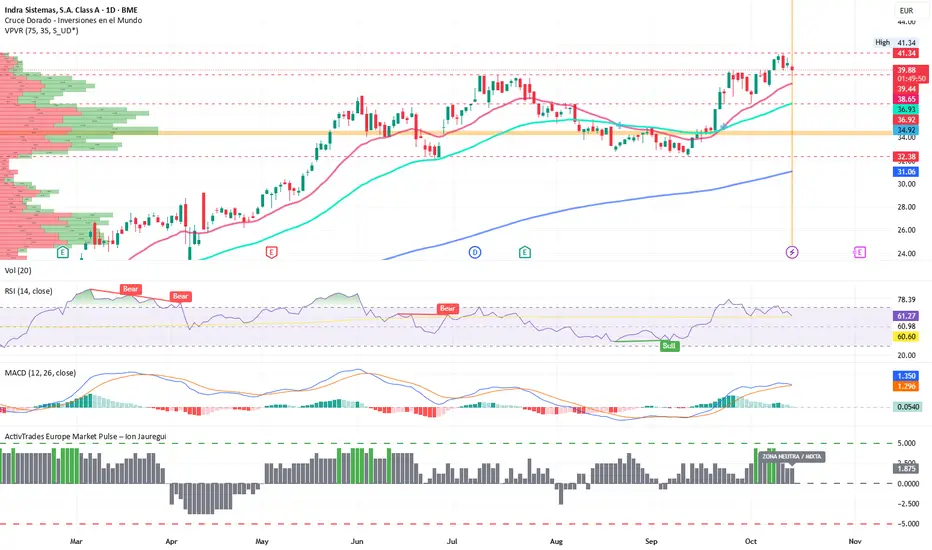
Indra future predictionOn this chart, we can see a stock with bull trading behavior.
The next resistance appears to be at 11,025, so we can gain up to 15%.
We crossed the MMA200 positively, and the MM20 and MM50 are moving up, significantly apart keeping their distance.
However we are far away from the MM20 moving avera

Indra: A Head and Shoulders may drag the stock price to 6.41€My previous analysis told to enter IDR when it reached 6.81-7€ level. However, the shape of a Head & Shoulders pattern has been confirmed today in H4 graph and we might experience further losses on the stock price, up to 6.41€ (lower bound of the slightly bearish channel it is forming).

Indra: Seizing sideways momentum call opportunity?Indra is moving inside a lateral channel with a slight bearish trend. In the last days there have been good news about projects that are being signed (i.e. Defense, Ireland) but it looks like global pandemic situation is making investors undecisive whether to hold positions on the stock or withdraw.


See all ideas
Summarizing what the indicators are suggesting.
Oscillators
Neutral
SellBuy
Strong sellStrong buy
Strong sellSellNeutralBuyStrong buy
Oscillators
Neutral
SellBuy
Strong sellStrong buy
Strong sellSellNeutralBuyStrong buy
Summary
Neutral
SellBuy
Strong sellStrong buy
Strong sellSellNeutralBuyStrong buy
Summary
Neutral
SellBuy
Strong sellStrong buy
Strong sellSellNeutralBuyStrong buy
Summary
Neutral
SellBuy
Strong sellStrong buy
Strong sellSellNeutralBuyStrong buy
Moving Averages
Neutral
SellBuy
Strong sellStrong buy
Strong sellSellNeutralBuyStrong buy
Moving Averages
Neutral
SellBuy
Strong sellStrong buy
Strong sellSellNeutralBuyStrong buy
Displays a symbol's price movements over previous years to identify recurring trends.