SBIN Analysis for 04th Dec '25: IntraSwing & WEEKLY Levels
Published on Request of Follower.
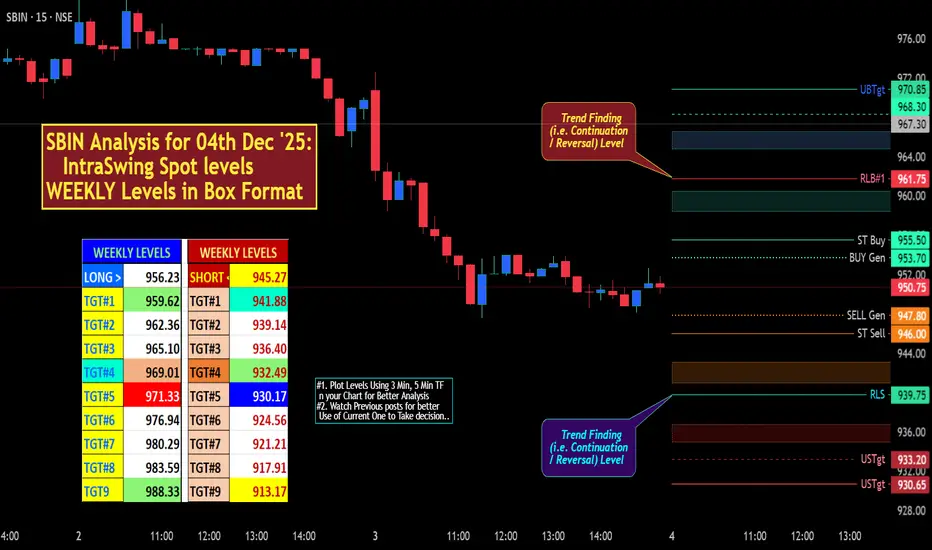
SBIN Analysis for 04th Dec '25: IntraSwing Spot levels
WEEKLY Levels in Box Format . Can also used in Short to Medium Term Level
Weekly Level Screen Shot:
[ Level Interpretation / description:
L#1: If the candle crossed & stays above the “Buy Gen”, it is treated / considered as Bullish bias.
L#2: Possibility / Probability of REVERSAL near RLB#1 & UBTgt
L#3: If the candle stays above “Sell Gen” but below “Buy Gen”, it is treated / considered as Sidewise. Aggressive Traders can take Long position near “Sell Gen” either retesting or crossed from Below & vice-versa i.e. can take Short position near “Buy Gen” either retesting or crossed downward from Above.
L#4: If the candle crossed & stays below the “Sell Gen”, it is treated / considered a Bearish bias.
L#5: Possibility / Probability of REVERSAL near RLS#1 & USTgt
HZB (Buy side) & HZS (Sell side) => Hurdle Zone,
*** Specialty of “HZB#1, HZB#2 HZS#1 & HZS#2” is Sidewise (behaviour in Nature)
Rest Plotted and Mentioned on Chart
Color code Used:
Green =. Positive bias.
Red =. Negative bias.
RED in Between Green means Trend Finder / Momentum Change
/ CYCLE Change and Vice Versa.
Notice One thing: HOW LEVELS are Working.
Use any Momentum Indicator / Oscillator or as you "USED to" to Take entry.
⚠️ DISCLAIMER:
The information, views, and ideas shared here are purely for educational and informational purposes only. They are not intended as investment advice or a recommendation to buy, sell, or hold any financial instruments. I am not a SEBI-registered financial adviser.
Trading and investing in the stock market involves risk, and you should do your own research and analysis. You are solely responsible for any decisions made based on this research.
"As HARD EARNED MONEY IS YOUR's, So DECISION SHOULD HAVE TO BE YOUR's".
Do comment if Helpful .
Trade ideas
SBIN - 1043 / 1139SBIN is flying high. Most of us will be expecting this is the limit. Its not done yet.
The best levels are 1043 (90% chance).
If you want to hold further the next resistance level is 1139. the stock will show some retracement after the level of 1139.

State Bank of India Ltd for 6th Nov #SBIN State Bank of India Ltd for 6th Nov #SBIN
Resistance 960 Watching above 961 for upside momentum.
Support area 950-953 Below 950 gnoring upside momentum for intraday
Watching below 950 for downside movement...
Above 960 ignoring downside move for intraday
Charts for Educational purposes only.
Please follow strict stop loss and risk reward if you follow the level.
Thanks,
V Trade Point

State Bank of India Ltd for 5th Nov #SBINState Bank of India Ltd for 5th Nov #SBIN
Resistance 960 Watching above 961 for upside momentum.
Support area 950-953 Below 950 gnoring upside momentum for intraday
Watching below 950 for downside movement...
Above 960 ignoring downside move for intraday
Charts for Educational purposes only.
Please follow strict stop loss and risk reward if you follow the level.
Thanks,
V Trade Point

State Bank of India Ltd for 4th Nov #SBIN State Bank of India Ltd for 4th Nov #SBIN
Resistance 950-953 Watching above 953 for upside momentum.
Support area 940 Below 940 gnoring upside momentum for intraday
Watching below 939 for downside movement...
Above 950 ignoring downside move for intraday
Charts for Educational purposes only.
Please follow strict stop loss and risk reward if you follow the level.
Thanks,
V Trade Poin

SBINNSE:SBIN
Note :
1. One should go long with a Stop Loss, below the Trendline or the Previous Swing Low.
2. Risk :Reward ratio should be minimum 1:2.
3. Plan your trade as per the Money Management and Risk Appetite.
Disclaimer :
>You are responsible for your profits and loss.
>The idea shared here is purely for Educational purpose.
>Follow back, for more ideas and their notifications on your email.
>Support and Like incase the idea works for you.

STATE BANK OF INDIA.....Buy There are two reasons to buy 1.its broken out of a flag pattern...so Hence I calculated the first leg of the flag and arrived at the tgt mentioned on the chart...2.Another reason to buy is simple...Its hit blue skies ..meaning new unchartered territory..So buy with day close stoploss below the previous two days bars..

State Bank of India Ltd for 28th Oct #SBIN State Bank of India Ltd for 28th Oct #SBIN
Resistance 925-927 Watching above 927 for upside momentum.
Support area 910 Below 920 gnoring upside momentum for intraday
Watching below 908 for downside movement...
Above 920 ignoring downside move for intraday
Charts for Educational purposes only.
Please follow strict stop loss and risk reward if you follow the level.
Thanks,
V Trade Point

State Bank of India Ltd for 27th Oct #SBINState Bank of India Ltd for 27th Oct #SBIN
Resistance 910 Watching above 911 for upside momentum.
Support area 897-900 Below 900 gnoring upside momentum for intraday
Watching below 896 for downside movement...
Above 910 ignoring downside move for intraday
Charts for Educational purposes only.
Please follow strict stop loss and risk reward if you follow the level.
Thanks,
V Trade Point

State Bank of India Ltd for 23rd Oct #SBIN State Bank of India Ltd for 23rd Oct #SBIN
Resistance 910-913 Watching above 913 for upside momentum.
Support area 900 Below 900 gnoring upside momentum for intraday
Watching below 898 for downside movement...
Above 910 ignoring downside move for intraday
Charts for Educational purposes only.
Please follow strict stop loss and risk reward if you follow the level.
Thanks,
V Trade Point

State Bank of India Ltd for 15th Oct #SBINState Bank of India Ltd for 15th Oct #SBIN
Resistance 885 Watching above 886 for upside momentum.
Support area 870 Below 875 gnoring upside momentum for intraday
Watching below 869 for downside movement...
Above 875 ignoring downside move for intraday
Charts for Educational purposes only.
Please follow strict stop loss and risk reward if you follow the level.
Thanks,
V Trade Point

State Bank of India Ltd for 14th Oct #SBINState Bank of India Ltd for 14th Oct #SBIN
Resistance 885 Watching above 886 for upside momentum.
Support area 870 Below 875 gnoring upside momentum for intraday
Watching below 869 for downside movement...
Above 875 ignoring downside move for intraday
Charts for Educational purposes only.
Please follow strict stop loss and risk reward if you follow the level.
Thanks,
V Trade Point

State Bank of India Ltd for 13th Oct #SBIN State Bank of India Ltd for 13th Oct #SBIN
Resistance 885 Watching above 886 for upside momentum.
Support area 870 Below 875 gnoring upside momentum for intraday
Watching below 869 for downside movement...
Above 875 ignoring downside move for intraday
Charts for Educational purposes only.
Please follow strict stop loss and risk reward if you follow the level.
Thanks,
V Trade Point

Stste Bank of India The weekly chart of State Bank of India (SBIN) shown here indicates a strong bullish setup emerging after a period of consolidation. The stock is currently trading at ₹880.65, approaching a major resistance zone near ₹920, last tested during previous rallies.
Key Technical Observations
Resistance and Breakout Level
The stock faces a horizontal resistance at approximately ₹920.00, which has been tested multiple times in the past year but not decisively breached.
A breakout above this level could open room for a potential rally towards the next major target near ₹1,080-1,100 as indicated by the arrow and line on the chart.
Support ZonesStrong support is visible around ₹760 and further down at ₹745.75, with these levels holding as demand zones during prior corrections.
Volume and StructureThe recent upward move is backed by increasing volume, indicating market participation and accumulation at current levels.

Amazing breakout on WEEKLY Timeframe - SBINCheckout an amazing breakout happened in the stock in Weekly timeframe, macroscopically seen in Daily timeframe. Having a great favor that the stock might be bullish expecting a staggering returns of minimum 25% TGT. IMPORTANT BREAKOUT LEVELS ARE ALWAYS RESPECTED!
NOTE for learners: Place the breakout levels as per the chart shared and track it yourself to get amazed!!
#No complicated chart patterns
#No big big indicators
#No Excel sheet or number magics
TRADE IDEA: WAIT FOR THE STOCK TO BREAKOUT IN WEEKLY TIMEFRAME ABOVE THIS LEVEL.
Checkout an amazing breakout happened in the stock in Weekly timeframe.
Breakouts happening in longer timeframe is way more powerful than the breakouts seen in Daily timeframe. You can blindly invest once the weekly candle closes above the breakout line and stay invested forever. Also these stocks breakouts are lifelong predictions, it means technically these breakouts happen giving more returns in the longer runs. Hence, even when the scrip makes a loss of 10% / 20% / 30% / 50%, the stock will regain and turn around. Once they again enter the same breakout level, they will flyyyyyyyyyyyy like a ROCKET if held in the portfolio in the longer run.
Time makes money, GREEDY & EGO will not make money.
Also, magically these breakouts tend to prove that the companies turn around and fundamentally becoming strong. Also the magic happens when more diversification is done in various sectors under various scripts with equal money invested in each N500 scripts.
The real deal is when to purchase and where to purchase the stock. That is where Breakout study comes into play.
LET'S PUMP IN SOME MONEY AND REVOLUTIONIZE THE NATION'S ECONOMY!

#SBIN 23rd Aug - 50 Points Swing? 762 or 895?Date: 23-08-2025
#SBIN - Current Price: 816.25
Pivot Point: 829
Support: 815
Resistance: 842
Upside Targets:
--------------------------------
| Target | Price |
---------------------------------
| 🎯 Target 1 | 854 |
| 🎯 Target 2 | 866 |
| 🎯 Target 3 | 881 |
| 🎯 Target 4 | 895 |
Downside Targets:
| 🎯 Target 1 | 803 |
| 🎯 Target 2 | 791 |
| 🎯 Target 3 | 777 |
| 🎯 Target 4 | 762 |
#TradingView #Nifty #BankNifty #DJI #NDQ #SENSEX #DAX #USOIL #GOLD #SILVER
#BHEL #HUDCO #LT #LTF #ABB #DIXON #SIEMENS #BALKRISIND #MRF #DIVISLAB
#MARUTI #HAL #SHREECEM #JSWSTEEL #MPHASIS #NATIONALUM #BALRAMCHIN #TRIVENI
#USDINR #EURUSD #USDJPY #NIFTY_MID_SELECT #CNXFINANCE #SBIN
#SOLANA #ETHEREUM #BTCUSD #MATICUSDT #XRPUSDT #PEPEUSDT #SHIBUSDT
#Crypto #Bitcoin #BTC #CryptoTA #TradingView #PivotPoints #SupportResistance

SBIN Chart Breakout – Momentum AheadSBIN Double Breakout Alert
On the 4H timeframe, SBIN has given a parallel channel breakout.
Additionally, it has also confirmed a broadening pattern breakout.
Sustaining above the ₹850–₹860 level may open the path for higher prices ahead.
Thank you!

Amazing breakout on WEEKLY Timeframe - SBINCheckout an amazing breakout happened in the stock in Weekly timeframe, macroscopically seen in Daily timeframe. Having a great favor that the stock might be bullish expecting a staggering returns of minimum 25% TGT. IMPORTANT BREAKOUT LEVELS ARE ALWAYS RESPECTED!
NOTE for learners: Place the breakout levels as per the chart shared and track it yourself to get amazed!!
#No complicated chart patterns
#No big big indicators
#No Excel sheet or number magics
TRADE IDEA: WAIT FOR THE STOCK TO BREAKOUT IN WEEKLY TIMEFRAME ABOVE THIS LEVEL.
Checkout an amazing breakout happened in the stock in Weekly timeframe.
Breakouts happening in longer timeframe is way more powerful than the breakouts seen in Daily timeframe. You can blindly invest once the weekly candle closes above the breakout line and stay invested forever. Also these stocks breakouts are lifelong predictions, it means technically these breakouts happen giving more returns in the longer runs. Hence, even when the scrip makes a loss of 10% / 20% / 30% / 50%, the stock will regain and turn around. Once they again enter the same breakout level, they will flyyyyyyyyyyyy like a ROCKET if held in the portfolio in the longer run.
Time makes money, GREEDY & EGO will not make money.
Also, magically these breakouts tend to prove that the companies turn around and fundamentally becoming strong. Also the magic happens when more diversification is done in various sectors under various scripts with equal money invested in each N500 scripts.
The real deal is when to purchase and where to purchase the stock. That is where Breakout study comes into play.
LET'S PUMP IN SOME MONEY AND REVOLUTIONIZE THE NATION'S ECONOMY!

State Bank of India Ltd for 18th Sept #SBIN State Bank of India Ltd for 18th Sept #SBIN
Resistance 860 Watching above 861 for upside momentum.
Support area 850 Below 850 gnoring upside momentum for intraday
Watching below 846 for downside movement...
Above 860 ignoring downside move for intraday
Charts for Educational purposes only.
Please follow strict stop loss and risk reward if you follow the level.
Thanks,
V Trade Point

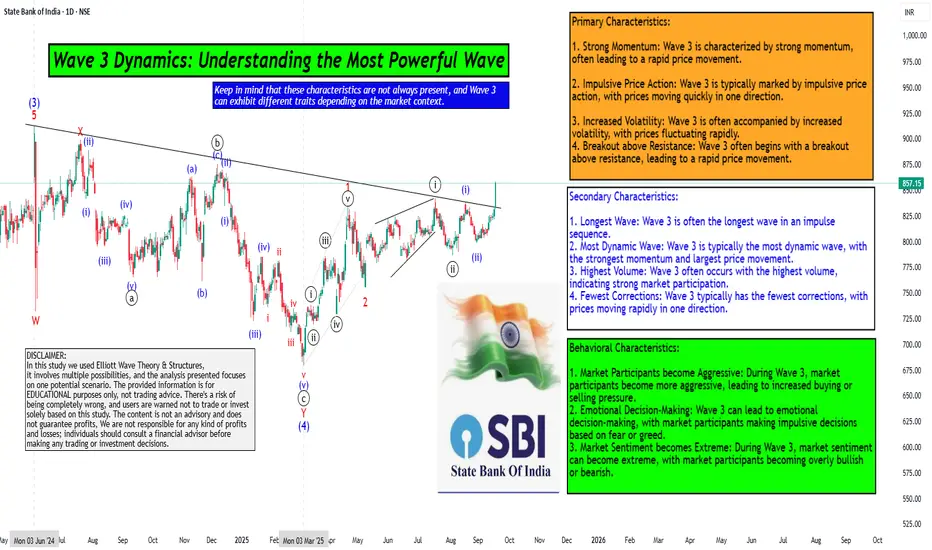
Wave 3 Dynamics: Understanding the Most Powerful WaveHello Friends, Welcome to RK_Chaarts,
For Learning and Practicing chart Analyzing, Today we are trying to Analyse the State Bank of India (SBIN) chart from an Elliott Wave perspective, we can see that the intermediate-degree Wave (3) completed at the June 2024 high. This was followed by a complex correction that ended at the March 2025 low, marking the completion of Wave (4).
We are currently unfolding Wave (5), which will complete the higher-degree Wave ((3)) of Primary degree in black. Within Wave (5), we have five minor-degree subdivisions, which we can see unfolding.
The first minor-degree Wave 1 completed at the 22nd April 2025 high, followed by a Wave 2 correction that ended at the May 9, 2025 low. We are currently in Wave 3, which is a dynamic wave with strong momentum.
Within Wave 3, we have five minute-degree subdivisions, which are unfolding. The first two subdivisions are complete, and we are currently in the third subdivision.
The characteristics of Wave ((iii)) of 3 are evident in the price action, with a strong breakout above the resistance trend line and good intensity of volumes. The Moving Convergence Divergence (MACD) is also positive, and the Relative Strength Index (RSI) is above 60, indicating strong momentum.
The daily Exponential moving averages (50 and 200) are also aligned in favor of the trend. All these parameters support our view, and we can see an inverted head-and-shoulders pattern or a double rounding bottom pattern unfolding.
Overall, the breakout looks promising, and we can expect further upside in SBIN as per Elliott wave theory.
Detailed wave counts on chart
Primary Characteristics:
1. Strong Momentum: Wave 3 is characterized by strong momentum, often leading to a rapid price movement.
2. Impulsive Price Action: Wave 3 is typically marked by impulsive price action, with prices moving quickly in one direction.
3. Increased Volatility: Wave 3 is often accompanied by increased volatility, with prices fluctuating rapidly.
4. Breakout above Resistance: Wave 3 often begins with a breakout above resistance, leading to a rapid price movement.
Secondary Characteristics:
1. Longest Wave: Wave 3 is often the longest wave in an impulse sequence.
2. Most Dynamic Wave: Wave 3 is typically the most dynamic wave, with the strongest momentum and largest price movement.
3. Highest Volume: Wave 3 often occurs with the highest volume, indicating strong market participation.
4. Fewest Corrections: Wave 3 typically has the fewest corrections, with prices moving rapidly in one direction.
Behavioral Characteristics:
1. Market Participants become Aggressive: During Wave 3, market participants become more aggressive, leading to increased buying or selling pressure.
2. Emotional Decision-Making: Wave 3 can lead to emotional decision-making, with market participants making impulsive decisions based on fear or greed.
3. Market Sentiment becomes Extreme: During Wave 3, market sentiment can become extreme, with market participants becoming overly bullish or bearish.
Keep in mind that these characteristics are not always present, and Wave 3 can exhibit different traits depending on the market context.
Here are some snapshots shared below to understand the concept & example
Largest wave among wave 1-3-5
Strong Momentum like 90 degree move, Vertical move, Rapid move & Dynamic move
Breakout with good volumes
Price trading above 50, 100 & 200 Day Exponential Moving Average
RSI Breakout on Daily
RSI Breakout on Weekly
MACD weekly
MACD Daily
Pattern Repeating
I am not Sebi registered analyst. My studies are for educational purpose only.
Please Consult your financial advisor before trading or investing.
I am not responsible for any kinds of your profits and your losses.
Most investors treat trading as a hobby because they have a full-time job doing something else.
However, If you treat trading like a business, it will pay you like a business.
If you treat like a hobby, hobbies don't pay, they cost you...!
Hope this post is helpful to community
Thanks
RK💕
Disclaimer and Risk Warning.
The analysis and discussion provided on in.tradingview.com is intended for educational purposes only and should not be relied upon for trading decisions. RK_Chaarts is not an investment adviser and the information provided here should not be taken as professional investment advice. Before buying or selling any investments, securities, or precious metals, it is recommended that you conduct your own due diligence. RK_Chaarts does not share in your profits and will not take responsibility for any losses you may incur. So Please Consult your financial advisor before trading or investing.

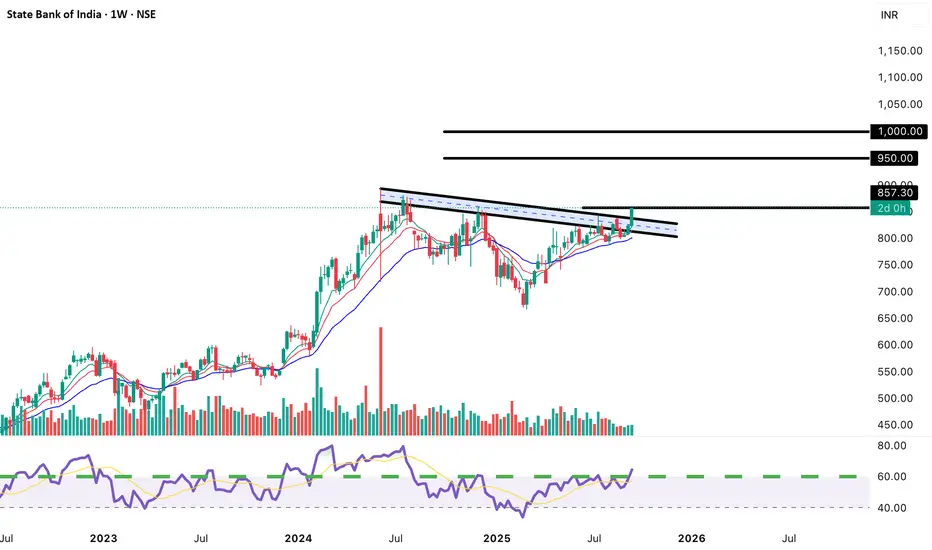
"SBIN Weekly Breakout: Target ₹950–₹1,000 with a Stop at ₹820"State Bank of India (SBIN) has broken above a multi-month resistance trendline on the weekly chart with strong bullish momentum and volume. The breakout is supported by a positive RSI and rising moving averages, confirming strength.
Buy Price: ₹857 (current close)
Target: ₹950–₹1,000
Stop-Loss: ₹820–₹830
Trade Plan: Buy on weekly close above resistance. Target the next psychological and technical resistance zone. Maintain tight stop-loss below breakout levels to manage risk.
Chart and technicals suggest a sustained move up if support holds!