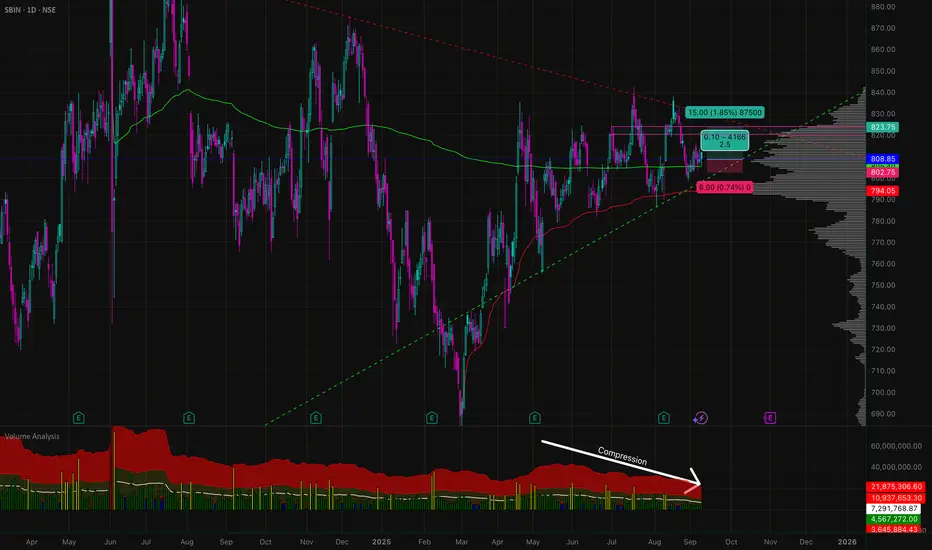
A nice 2.5:1 Risk:Reward available on a very stable security.It's State Bank of India. Can be considered relatively stable.
VSA Getting compressed. Ready to release.
Green VWAP from All time high of Jun 24.
Red VWAP from Swing low of March 25 since when the stock has stayed bullish.
With overall trend supporting, one can plan a simple 1 month position trade with 2.5:1 risk to reward ratio.
Only a study, not an advice.
Trade ideas
Public bank-SBINSBIN – Largest Public Sector Bank
On the chart from 2022, we observed a consolidation phase, after which SBIN moved up by almost 70%. From April 2024, it declined roughly 22%.
All public sector banks behaved in a similar manner, though the percentage returns varied.
Currently, the banks are again in a consolidation phase. From here, the move could be in either direction — we just need to observe what happens next and react accordingly.
Equity Finance is business of wait and observation .This is based on the weekly chart and is purely an observation.

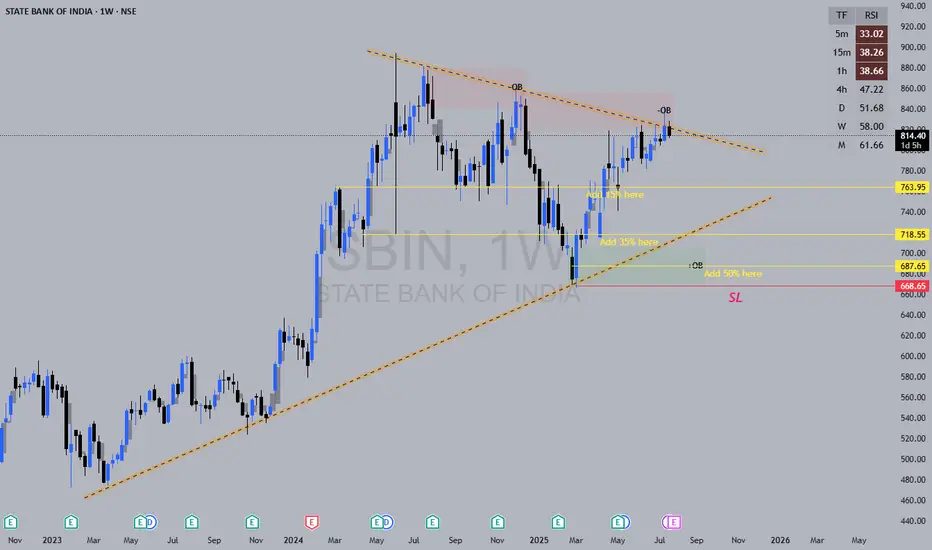
Weekly Analysis - Swing TradingHigh Beta Stocks Analysis – Coming Week
Based on Ichimoku Lag Span, RSI>60, SMA 9, and Fractals (Current Swing High and Low)
1. SBIN - Long
2. Asian Paints - Long
3. Muthoot Finance - Long
4. Tata Steel – Short Sell Futures or PE 150
5. Eternal LTD – Long
6. Kotak Mahindra Bank – Short Sell or PE 1950
7. Apollo Hospital – Long
8. Heromoto – Long after some pullback or near Fractal Support
9. Maruti Suzuki – Long
10. Mannapuram Finance
Kindly check last post to understand setup.

Continuation Inverse head and shoulder pattern Continuation Inverse head and shoulder pattern is trend continuation setup indicates price continue the previous trend

SBIN (Swing Trade) LONGThis stock has broken out of a trend line and looking good for a good upper move. Current CMP is 835, book your profit on 900 , SL will at last swing(805) .

SBIN , 1W , Bullish As the Pattern is Formed and given Breakout , enter after strong candle close in weekly Timeframe and put SL below Swing low . follow proper risk management
follow for more swing ideas like this

STATE BANK OF INDIA IN A BULLISH MOMENTUMThe technical setup suggests bullish momentum with Elliott Wave supporting continuation higher. Key upside levels are ₹850 and ₹880, as long as the price holds above trend support near ₹820-₹830. A failure below this zone would weaken the bullish outlook.

Importance of ATR(Average True Range)So idea here is to calculate risk.
understanding fear in the market ATR is an indication of volatility , not direction.
A smaller ATR range means low volatility.. tentatively market is consolidating.
A larger ATR range means the market is dealing with uncertainty so volatility has increased.
you can see the value of ATR on your chart.
the value of past ATR14period value is be greater than current ATR14 Period to take risk on a trades. it will help you reduce risk.

SBI - My Pick - No Financial Advice - VCP PatternAfter a recent upside rally SBI has retraced approx 8.5% from the resistance zone of 825-830, theafter second compression of 5% occurred. Thus I see sucessive Volatility contraction. Recent Golden Cross over clubbed with VCP is indication of good buying opportunity. Short to mid-term momentum is bullish, underpinned by strong moving averages and recent bullish crossover. My entry depends upon good bullish close with good volumes.

Buy above 817 fast target 873Everything mention about in my chart
buy price range cmp -811.85
stop loss - 797 day closing
fast target - 873
I am not sebi reg
is my own idea only

SBIN | Buy @LTP | SL below 776 | Targets 880, 970Disclaimer:
This is not financial advice. Please do your own research or consult with a financial advisor before making any investment decisions. Investments in stocks can be risky and may result in loss of capital.

SBIN - VCP formationThe sector has a whole is lagging the broader market, private banks and financial services have been the leaders. Position size should be in check. Wait for trendline breakout for an ideal entry. This is a long term play.

STATE BANK OF INDIA at Best Support !!This is the 4 hour Chart of STATE BANK OF INDIA.
SBIN is having good Support at 770 range.
SBIN is moving within an ascending channel, with a support zone in the range of 770–780.
If this level is Sustain ,then we may see higher prics in SBIN.
Thank You !!

SBIN has given a Spring SBIN 779 has given a Spring pattern for target 811.
Positive volume comparatively more.


SBI towards 650? Butterfly pattern to complete "W"SBI is on the verge to form Butterfly pattern it has potential to reach 650 target with following support.
720 / 700 / 680 / 650

SBIN Weekly Levels and reportLook at the Weekly Chart:
This will show you how SBIN’s price has moved each week.
Identify Support and Resistance:
Support is where the price usually doesn’t fall below (like a floor).
Resistance is where the price often doesn’t go higher than (like a ceiling).
Example: If SBIN’s price bounced off ₹590 a few times, that’s support. If the price keeps struggling around ₹640-650, that’s resistance.
Check for Fibonacci Levels (Optional):
You can use a tool that shows you Fibonacci retracement levels. It helps find where prices might bounce or reverse.
Key levels to watch for are 38.2%, 50%, and 61.8% retracements from a big move (up or down).
Draw Trendlines:
If SBIN has been moving up, draw a line connecting the lows to see where it might find support in the future.
If it’s in a downtrend, connect the highs to see where resistance might be.
Check the Moving Averages:
The 50-week and 200-week moving averages can show if the stock is generally moving up or down.
If SBIN is above the 50-week average, it might be in a bullish (up) trend.
If it’s below the 200-week average, it might be in a bearish (down) trend.
Look for Round Numbers:
Prices like ₹600, ₹650, ₹700 are often seen as psychological levels. Traders often watch these prices because they’re easy to remember.
Example:
If SBIN recently bounced off ₹590 or ₹600 multiple times, that’s support.
If it keeps facing resistance around ₹640 or ₹650, those are resistance levels.
Final Thoughts:
If SBIN’s price breaks above resistance (say ₹650), it might go higher.
If it falls below support (say ₹590), it might drop further.

Fake Break out Down Side. You Know What's Next ?#sbin has made a flag and pole pattern on the weekly timeframe, and formed a fake breakout also.

SBI Trading IdeaNSE:SBIN is movement. Once this crosses 792, its good to Buy and the Target would be 850

State Bank of India view for Intraday 20th May #SBIN State Bank of India view for Intraday 20th May #SBIN
Resistance 810 Watching above 811 for upside momentum.
Support area 780 Below 800 ignoring upside momentum for intraday
Watching below 778 for downside movement...
Above 800 ignoring downside move for intraday
Charts for Educational purposes only.
Please follow strict stop loss and risk reward if you follow the level.
Thanks,
V Trade Point

State Bank of India view for Intraday 15th May #SBIN State Bank of India view for Intraday 15th May #SBIN
Resistance 810 Watching above 811 for upside momentum.
Support area 780 Below 800 ignoring upside momentum for intraday
Watching below 778 for downside movement...
Above 790 ignoring downside move for intraday
Charts for Educational purposes only.
Please follow strict stop loss and risk reward if you follow the level.
Thanks,
V Trade Point

SBIN is above breakout levelSBIN just crossed breakout level of 792.25 and now in bullish zone. Expected to cross 850 level. Stop loss is 782.75 (Reversal level as mentioned on chart)
Note: This is not a buy/sell trade call. It is an analysis.
