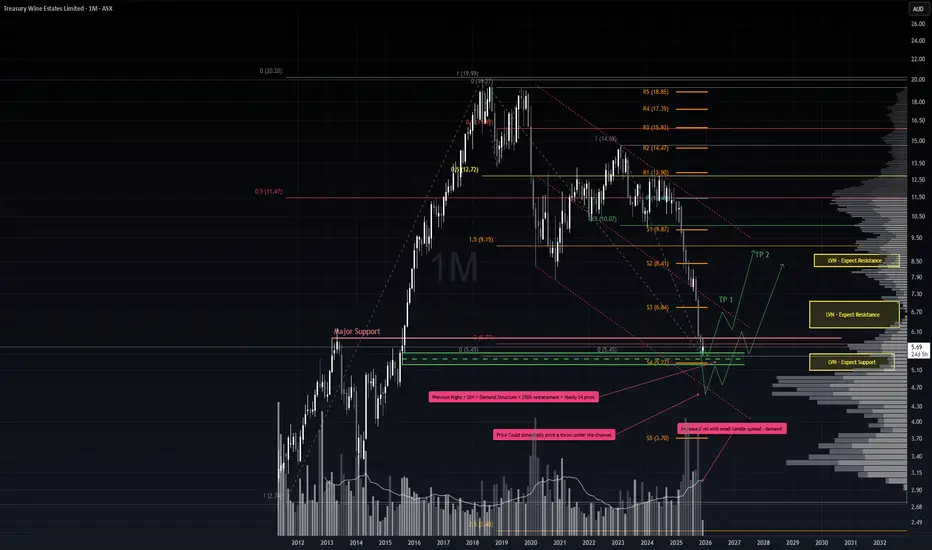
Relief Rally Incoming?It’s been a punishing stretch for TWE holders, but price action has now pulled back into a critical zone where a relief rally could emerge. The broader trend remains bearish, so any positioning here must respect that context.
Key Support Factors
1. 200% retracement from the 2018 double top.
2. Low Volume Node (LVN) zone, indicating limited price acceptance and potential for sharp moves.
3. Demand structure anchored by the August 2015 candle.
4. Historical tops acting as structural support.
5. November monthly candle showed notable demand — high volume on a narrow spread.
6. 11 consecutive weeks down in a single swing, aligning with Gann’s 7–10 bar exhaustion principle.
7. Proximity to the yearly S4 pivot, reinforcing the demand zone.
Trade Scenario 1 – Aggressive Entry
Setup: Despite no confirmed trend reversal, risk-tolerant traders could begin scaling in here, supported by the confluence of demand factors.
Stop Loss: 5.22 — just beneath the demand structure and S4 pivot.
Take Profit: Initial target at the midline (EQ) of the downward channel. If price breaks cleanly above, extend targets toward the upper bounds of the channel.
Trade Scenario 2 – Throw-Under Reversal
Setup: If the S4 pivot and demand structure fail, watch for a throw-under pattern whereby price dips below support but quickly reclaims the range.
Confirmation: A bullish hammer or doji on surging volume, ideally accompanied by negative sentiment, would strengthen the reversal case.
Take Profit: Similar roadmap to Scenario 1 — first target at the channel EQ, then potentially the upper boundary if momentum builds.
Summary
This is a high-risk, counter-trend play. The confluence of structural supports, exhaustion signals, and pivot proximity offers a tactical window for relief. However, discipline around stops and scaling is essential, as the long-term bear market backdrop remains intact.
* Note, price pathing is not time based, just the overall price movement
Trade ideas
Potential outside week and bearish potential for TWEEntry conditions:
(i) lower share price for ASX:TWE below the level of the potential outside week noted on 20th September.
Stop loss for the trade would be:
(i) above the swing high of 19th September (i.e.: above $11.56), once the trade has activated.

TWE.ASX - FUNCHARTS - Does Corn Really Lead Treasury Wines?Note: Funcharts are interesting charts I have found that offer a potentially unique perspective on a stock. Sometimes I’ll throw something out there that you might find controversial or wrong headed. If that’s the case your 2 cents worth is most welcome.
The blue line in the graph above is corn (futures) projected forward, now why on earth would corn lead the Treasury Wines share price? While I let you ponder the answer to that the correlation between a projected forward corn price and TWE has been relatively high through history at approximately 30%, simply scroll back through the chart and you can see for yourself that corn has a pretty good track record of leading TWE.
Now that we have a projection of sorts the next step would be to conjure up a trade based on this intermarket relationship (if it truly does indeed exist).
Let me draw your attention to the system on screen, it is a reverse of the Supertrend STRATEGY (Inputs: ATR Length, 3, Factor 1.5) where it buys the short term dips and sells the short term rallies. An analysis of performance shows that TWE is a very choppy stock. To see performance scroll down to the bottom of the chart and make sure Supertrend STRATEGY is showing. Now the next trick is to view the Performance Summary (not overview) where is breaks down the performance of long trades v short trades.
An analysis of long trades shows buying dips was highly profitable with a profit factor above 2 and a high percentage of winning trades. With this evidence the way I would trade TWE is to use Corn, or seasonal analysis or similar to obtain a bullish bias and then look to buy into a pull back on TWE. Once set I would then look to sell the position once the stock reached an overbought level. Stop Losses are a little difficult to set on a mean reversion strategy as theoretically the bigger the pull back the better the opportunity but I would suggest a fairly wide stop level of around 10-15% of the stock price as an emergency stop in case the trades really goes wrong.
The question you're obviously asking is should I get long now? In my opinion awaiting a pull back is probably the best strategy, you could use a stochastic or RSI indicator (or any oscillator) for that matter and look to enter during oversold zones and close out during an overbought period.

TWE not a current holder. But an inverse head and shoulders pattern.
Headwinds?
-Current China situation.
-purely a technical short/mid term trade.

TWE TestingRighto so what I want to follow here is the action on the 1d chart, atm I am waiting to see what happens. I will be back to add the bars in after some time. no entry here yet, I am waiting for - MACD cross down, price break down and the kijun to turn down. XJO is counter trend today on the 4hr so I need to keep in mind. Consider sentiment and use discretion as it develops

ASX - TWE australian wine producer, hit hard at the pandemic, and a 2nd whack with chinese wine tarriffs placed on some of our aussie exporter goods.
I am a shareholder, waiting to see the pivot by management into other asian and european markets.

Quick Scalp on TWESaw this stock on my scanner and for some reason traders really like it, it had no news today. So I thought I will jump in as well. It was B class trade for me, I prefer to see the stock above
both EMA’s but still a great trade.
1 min: great set up a 1 min chart great push then a pull back and go for the break out above, love these kind of trades. And this is a 6 Billion cap as well so it move nicely. Got in at $9.86 with 1000
shares, then yet again got way to early again, I leave so much on the table.
Spark: didn’t see this until 10.27am, saw that the sellers where thinning out with a pull back trade set up. I did say to my self once it breaks $9.85 that when I will go in, so I got in at $9.86 10.27am
then go out at 10.30am $9.92, then it went up another 5 ticks! So annoying.

Great risk/reward ratio pick - TWEBack in Aug when TWE announced great 3Q result, it went from $11.5> $13.12 in one single day. It was then severely impacted by the gradually intensifying tension between AUS and China, the stock price has then free fall all the way to ~$8 especially after Chinese gov announced applying tariffs on Australian wine exports.
However, it appears that $8 is already the rock bottom by looking at both the price action and the recent news the TWE is actually seeking other markets to expand (themarketherald.com.au).
I wouldnt be surprise the stock price could recover back to $10.63 (~20% gain from now) in short term, and towards $13 when the pandemic gradually smoothens across the globe with very limited downsize at $8 as cut loss and solid support.

TWE Fib support Seems like a good buy hope you like. If it breaks down gonna retest 9.20 then probably bounce. If it breaks out gonna see 10.50ish.

TWE - Is it ready to breakout?Ascending triangle formation in the TWE chart. High probabilty trade on the back of the market anticipating a positive close out of their class action dispute and potential market tailwinds with lockdowns easing. Waiting for the break out with bullish candle confirmation.

daily analysis of TREASURY WINE ESTATES Hi friends
the graph of this market shows with a very high probability a downtrend but at the same time you have to be vigilant of the change of the same market towards the opposite direction
please subscribe to receive more analysis
thank you

Dead Cat Bounce or is the bottom in for Treasury Wine $TWEIs this a dead cat bounce or is the bottom in for Treasury Wine $TWE ?
I went long this morning for a short term trade because I like the risk to reward here. We continue to hold if we can break the box area with good price action and volume.
TD sequential is showing a TD 9, MACD signals a buy and DMI is showing bears are running run of energy.

TWE | 4hr trend continuation characteristicsi am in on this. looking for a re-test of the top as illustrated.


$TWE trade set-up ASXLong trade setup today $TWE Treasury Wine Estates on the ASX. Layered buys for a total of 703 units 14.10 to 14.20. This is a stock I will invest in mid to long term swing trading S/R pivots along the way. Not financial advice, please dont copy my trades as there is a risk that price goes against us at any time and trading is risky.

TWE: a Bull Flag here?This chart was posted by a fellow trader at our recent ATAA meeting and caught my attention for the clean chart pattern it presented.
IMHO, TWE is consolidating in a classic-style Bull Flag under the psychological, whole-number $20 level.
The Flagpole here is about $15 so Technical Theory would suggest that any bullish breakout move might extend by a similar margin.
Thus, I'll be watching for any weekly breakout here and, if bullish, I'll be looking for a move up to the $35 level.

Treasury Wine Estate buy opportunity -11 Week horizontal range
-Would take stock to all-time high on an already amazing climb
-Declining volume into potential spike
80 basis points planned but will likely be 30-40 on initial tranche

TWE Simple AnalysisThis is my first published idea so be kind. Always appreciate feedback.
This is not financial advise, just my thoughts and opinions.
TWE is looking good after a brief period of consolidation around the 17 mark.
It has rising volume and is showing signs of a good move up early next week. Today the price moved well above the recent consolidation zone (see chart). Today's volume is still a little low for me to say it is a confirmed breakout.
All indicators showing an upward trend (see chart).
I will be keeping an eye on this one next week and if it continues it's move up with good volume I will be going long on TWE.
Happy hunting,
John
