Palladium Wave Analysis – 17 October 2025- Palladium reversed from long-term resistance level 1600.00
- Likely to fall to support level 1500.00
Palladium recently reversed down from the long-term resistance level 1600.00 (former strong support from 2020 and 2021, acting as resistance after it was broken at the start of 2023, as can be see
About Palladium - Cash
Palladium has several special properties as a commodity. One of the most interesting aspects for traders in futures contracts is that palladium, despite its status as one of the main internationally traded precious metal commodities, has not seen a significant rise in price, as opposed to other precious metals like gold or silver.
The market for palladium is large while the palladium price per ounce is currently comparatively low, which is an enticing combination for those involved in commodity trading. Palladium is also different to gold in terms of investment, in that prices of gold usually rise when the economy is in a slump. Palladium price charts will show that the opposite is true of the palladium price - it decreases when the economy is down.
More than 80% of all palladium in the world is mined in South Africa and Russia.

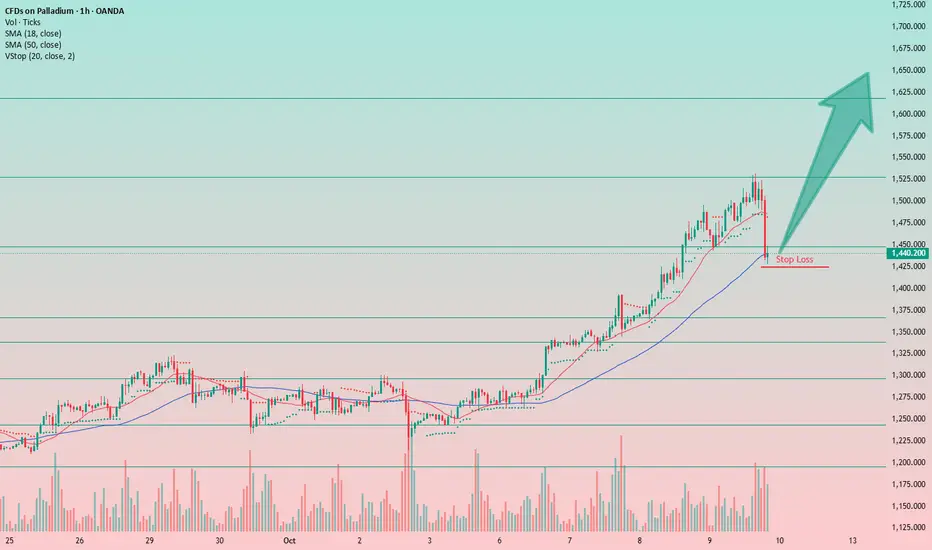
Palladium: Testing a Long from Current LevelsIt might be worth trying a long position on palladium from the current levels.
There’s a chance that the long-awaited correction has begun, and the downward move could deepen. However, the tight stop-loss at the level 1425 on this trade is encouraging — as is the accumulated profit, which allows for
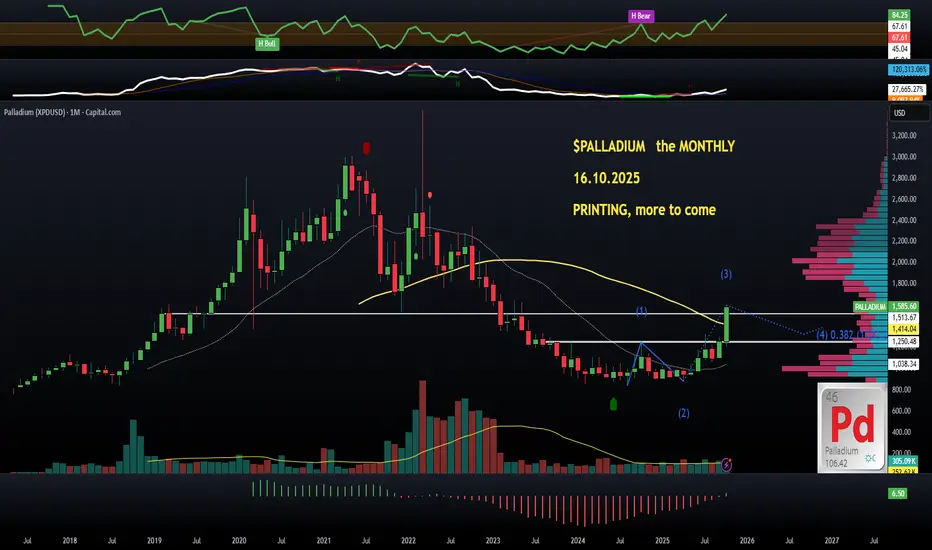
$PALLADIUM (monthly): PRINTING on WAVE 3, much MORE to comeOnly last month I published another one of my METALS trade, $PALLADIUM.
I couldn't resist, MONTHLY chart was enough for me to go in, it was $1207 then, 5 weeks ago, and approaching $1600 now.
I called the money wave, basically, that's what they call WAVE 3 in Elliot's Wave Theory. And it's not don
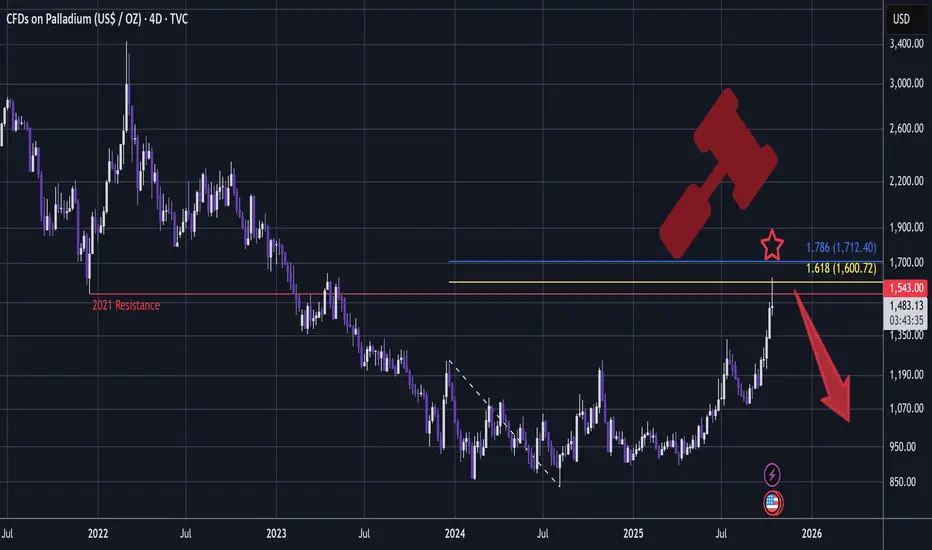
PALLADIUM - Short Setup, Bearish Rotation In MetalsA very bearish setup is developing:
Since the top, there is nowhere on the chart that has a whipsawing candle like this:
A very big Shooting Star!
This setup has my favourite conditions met:
- Whipsawing candle that sweeps liquidity through key resistance (2021)
- Tidy 1.618 Golden Window (1.6
PALLADIUM ( XPDUSD ) BULLISH BREAKOUTPalladium peaked on March 2022 @ 3400$ before sharply dropping to consolidate in the price range of 800$ - 1300$. The insiders have been accumulating the precious metal in this tight consolidation for the past two years. At its peak at $3400, Palladium was more expensive than Gold. Following the acc

Palladium to follow Gold & SilverPalladium after finding a bottom around 900$ is ramping up, trying to catch with gold and silver. First target 1600$, secondary target 2000$

Palladium - a precious metal in demandPalladium is a precious metal in demand.
Applications -
- Automotive sector for Catalytic converters and EV adoption.
- Geopolitical supply side pressure ( Russia ) and Recycling delays.
- Industrial use electronics, chemical catalysts, hydrogen storage , fuel cells.
- Healthcare - Dental Al

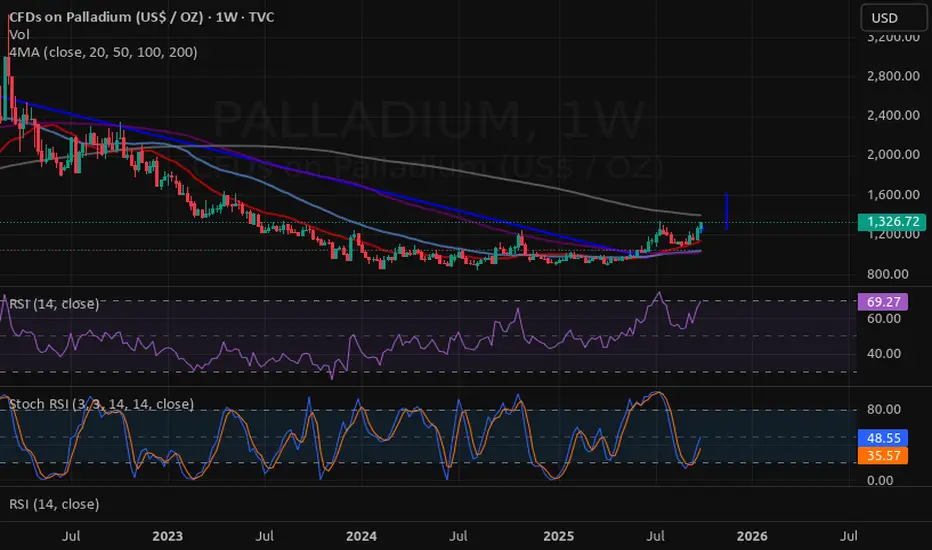
Palladium (XPDUSD) – Cup & Handle Breakout in Play?Palladium is showing a Cup & Handle pattern on the weekly chart – a strong bullish continuation setup. After a long rounded base (cup), price has pulled back slightly to form the handle, and now it’s testing the neckline zone.
🔑 Key Levels:
📍 Breakout Zone: 1,270 USD
🎯 Target: 1,680 USD (cup dept

“Palladium Double Bottom Thief Plan – Will $XPDUSD Steal 1350?”📝 TradingView Description (Thief Style, Polished, Stylish, Funny-Pro Vibe)
Asset: XPD/USD “Palladium vs U.S Dollar”
Market Map: Forex Metals – Swing/Day Trade Strategy
📊 Plan – Thief Strategy in Action
The bullish plan is confirmed with:
✅ Double bottom pullback & retest
✅ Triangular moving average

See all ideas
Displays a symbol's price movements over previous years to identify recurring trends.