PENDLEUSDT Bearish Scenario (Continuation Downtrend):
Rationale: A sharp drop at the end of the chart indicates weak buyers; if it breaks lower, bearish momentum will continue.
Entry: Short below ~2,469 USDT (breakdown with a bearish candle close and high volume).
Alternative: Short on a pullback to ~3,105 USD
Related pairs

PENDLE - LONG SET-UPBINANCE:PENDLEUSDT
Looking good to Long
Entry Between 2.150 - 2.560
SL Below 1.791
Target above 3.5$
Lev & Margin As Per Your Risk Capacity

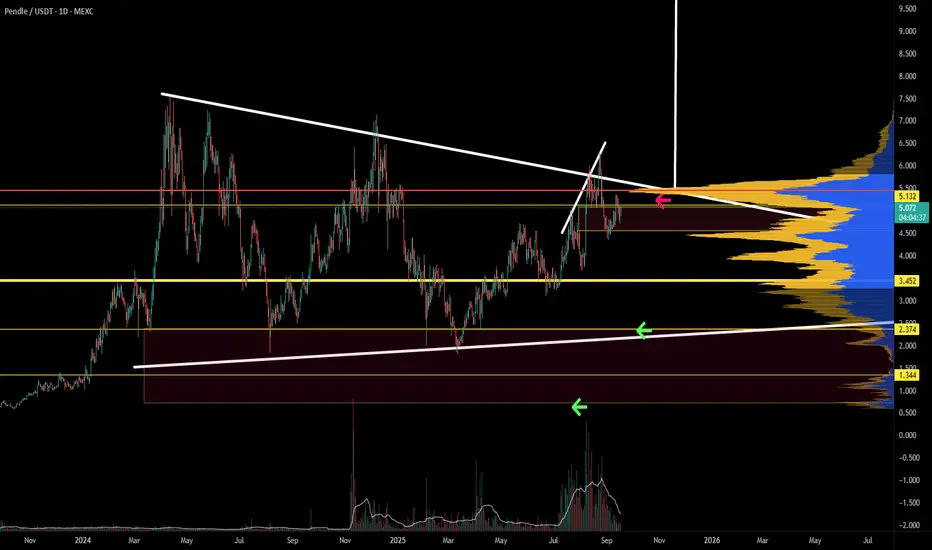
TradeCityPro | PENDLE: Near Breakout From Descending Trendline👋 Welcome to TradeCity Pro!
In this analysis, I want to review the PENDLE coin for you — one of the projects in the Ethereum ecosystem, currently ranked 93rd on CoinMarketCap with a market cap of $858.76 million.
📅 Daily Timeframe
On the daily timeframe, this coin has formed two trendlines. The mai

Pendle is at the top of the range...breakout?PENDLE could break out here. This issue with getting into fresh longs is that you are buying into resistance, tops. If it breaks resistance with volume, we likely seek an expansion into price discovery. If the price rejects, it is likely that the price revisits range lows. This is an inflection poin
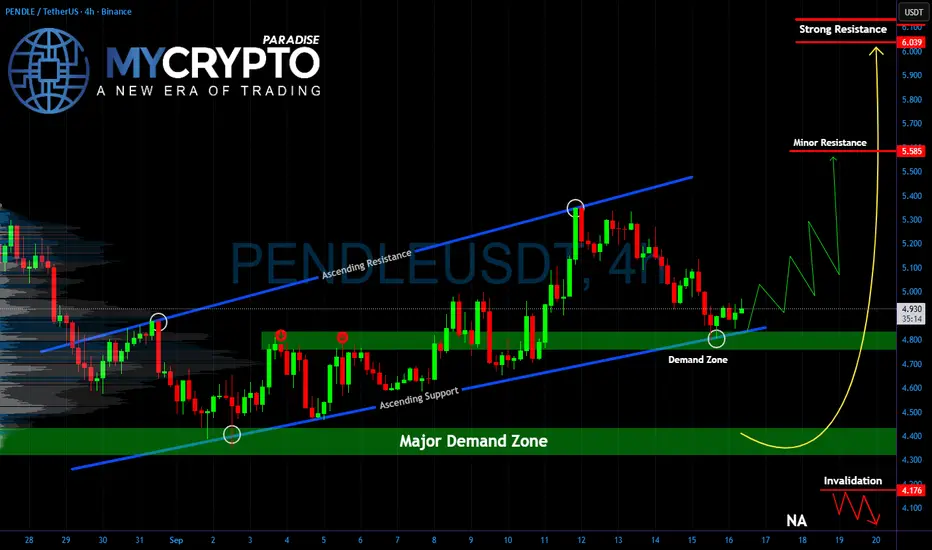
PENDLE At Critical Turning Point Before Explosive MoveYello Paradisers, can #PENDLEUSDT hold the line here, or is a painful flush waiting around the corner? After the recent selloff, the price has landed right inside a demand zone that previously triggered strong recoveries. This is the level where buyers need to step up, or the structure risks collaps
SHORT PENDLEDo you se triangle ? me i see a 1.2 reward trade to go liquidation south, this coin make x100 in less than two years its not healthy

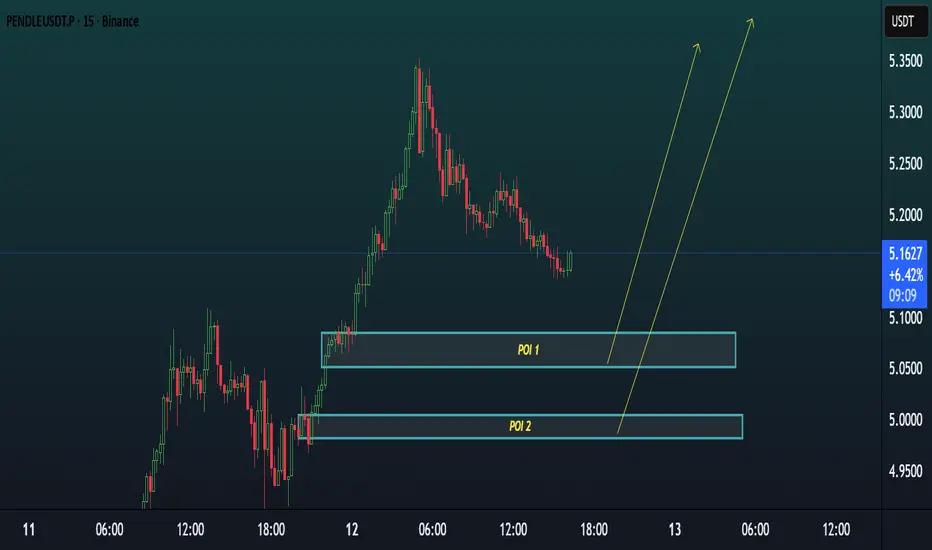
PENDLEUSDT TRADE POIsChart Analysis (15m)
Current Price: $5.145 (+7.48%)
Trend: Strong bullish momentum after a deep retracement.
📍
Points of Interest (POIs)
POI 1 (First Buy Zone): Around $5.05 – $5.10
Acts as the nearest demand zone.
Price may react here if it doesn’t drop too deep.
POI 2 (Second Buy Zone): Arou
pendleusdtGiven the current situation, it might be worth taking a risk. Let's manage risk, as we also have NFP on Friday

PENDLEUSDT Bullish Flag Points to $6.8–$7 BreakoutPENDLEUSDT has formed a bullish flag pattern on the chart — a consolidation structure that often precedes continuation to the upside.
Once price breaks out of this flag, a move toward the $6.8–$7 zone is expected. This range represents the next resistance area and potential profit target.

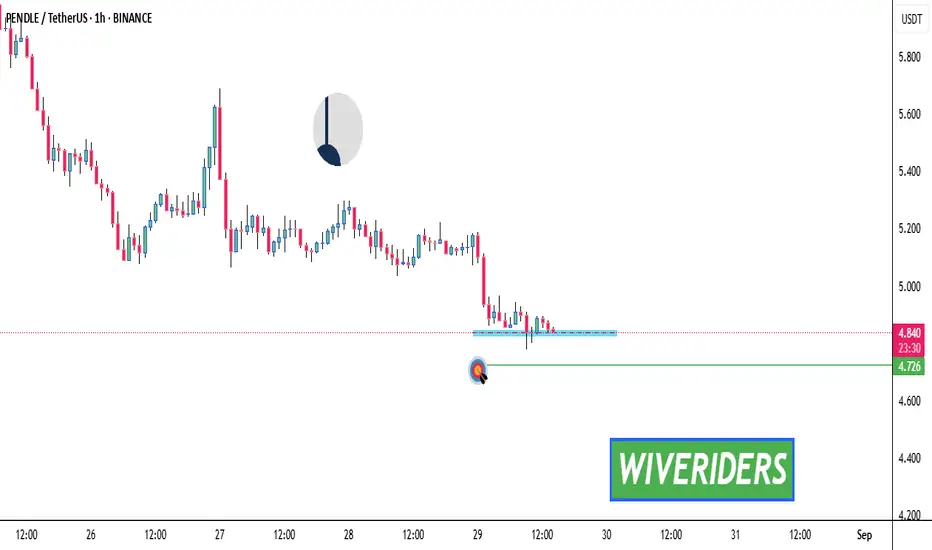
PENDLE Market Update📉 CRYPTOCAP:PENDLE Market Update
CRYPTOCAP:PENDLE is currently testing the blue support level 🔵
If this level breaks down, sellers could take control and drive price lower ❌
⚠️ Reminder: A confirmed breakdown of support often leads to sharper bearish momentum — stay cautious and always wait fo
See all ideas
Summarizing what the indicators are suggesting.
Oscillators
Neutral
SellBuy
Strong sellStrong buy
Strong sellSellNeutralBuyStrong buy
Oscillators
Neutral
SellBuy
Strong sellStrong buy
Strong sellSellNeutralBuyStrong buy
Summary
Neutral
SellBuy
Strong sellStrong buy
Strong sellSellNeutralBuyStrong buy
Summary
Neutral
SellBuy
Strong sellStrong buy
Strong sellSellNeutralBuyStrong buy
Summary
Neutral
SellBuy
Strong sellStrong buy
Strong sellSellNeutralBuyStrong buy
Moving Averages
Neutral
SellBuy
Strong sellStrong buy
Strong sellSellNeutralBuyStrong buy
Moving Averages
Neutral
SellBuy
Strong sellStrong buy
Strong sellSellNeutralBuyStrong buy
Displays a symbol's price movements over previous years to identify recurring trends.
Frequently Asked Questions
The current price of PENDLE / TetherUS (PENDLE) is 2.686 USDT — it has risen 0.61% in the past 24 hours. Try placing this info into the context by checking out what coins are also gaining and losing at the moment and seeing PENDLE price chart.
PENDLE / TetherUS price has fallen by −8.75% over the last week, its month performance shows a −40.72% decrease, and as for the last year, PENDLE / TetherUS has decreased by −48.94%. See more dynamics on PENDLE price chart.
Keep track of coins' changes with our Crypto Coins Heatmap.
Keep track of coins' changes with our Crypto Coins Heatmap.
PENDLE / TetherUS (PENDLE) reached its highest price on Apr 11, 2024 — it amounted to 7.538 USDT. Find more insights on the PENDLE price chart.
See the list of crypto gainers and choose what best fits your strategy.
See the list of crypto gainers and choose what best fits your strategy.
PENDLE / TetherUS (PENDLE) reached the lowest price of 0.465 USDT on Aug 17, 2023. View more PENDLE / TetherUS dynamics on the price chart.
See the list of crypto losers to find unexpected opportunities.
See the list of crypto losers to find unexpected opportunities.
The safest choice when buying PENDLE is to go to a well-known crypto exchange. Some of the popular names are Binance, Coinbase, Kraken. But you'll have to find a reliable broker and create an account first. You can trade PENDLE right from TradingView charts — just choose a broker and connect to your account.
Crypto markets are famous for their volatility, so one should study all the available stats before adding crypto assets to their portfolio. Very often it's technical analysis that comes in handy. We prepared technical ratings for PENDLE / TetherUS (PENDLE): today its technical analysis shows the sell signal, and according to the 1 week rating PENDLE shows the sell signal. And you'd better dig deeper and study 1 month rating too — it's sell. Find inspiration in PENDLE / TetherUS trading ideas and keep track of what's moving crypto markets with our crypto news feed.
PENDLE / TetherUS (PENDLE) is just as reliable as any other crypto asset — this corner of the world market is highly volatile. Today, for instance, PENDLE / TetherUS is estimated as 4.45% volatile. The only thing it means is that you must prepare and examine all available information before making a decision. And if you're not sure about PENDLE / TetherUS, you can find more inspiration in our curated watchlists.
You can discuss PENDLE / TetherUS (PENDLE) with other users in our public chats, Minds or in the comments to Ideas.