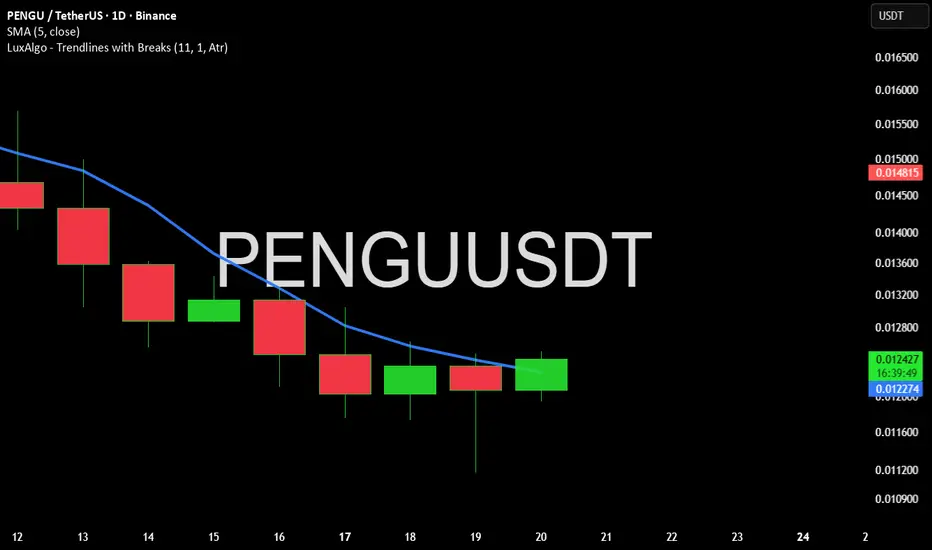
PENGU - BEARISH $PENGU - price analysis 🟥
Very bearish trend at the moment & no buy pressure📉
Price will likely continue to fall toward 0.00800$ lower key demand zone! 📉
Possible setup & key levels are in my charts.🐧
Not a financial advice.
Trade ideas

PENGU 0.012 i see bottom guys and i aped ina meme coin that was so popular among rich kids
perhaps i want to buy and brag it when it goes back to rick kids high price
PENGU/USDT: Critical Decision Point - Reclaim or Cascade?💡 Scenario Mapping
🚀 BULLISH Case: 3D frame :
If price holds above $0.012 and reclaims $0.0125:
Potential bounce toward the $0.025-0.028 range
Accumulation phase begins (blue box scenario)
Higher lows formation = trend reversal confirmation
⚡ Trading Gameplan
For Long-Term Holders:
Wait for confirmation: Break and retest of $0.0013 for long entry
Strong Buy: $0.0122
Stop Loss: Below $0.011
Avoid: Trading in current chop zone without clear direction ❌
____________________
🧠 The Bottom Line -
PENGU is at a crossroads. The chart shows a classic post-parabolic correction approaching historically significant support—typical behavior for meme/community tokens after initial hype. The next few weeks will determine if this is:
✅ A generational buying opportunity (if support holds)
❌ A falling knife (if support breaks)
GOOD LUCK --- * DYOR * - MANDATORY

Short trade
1Hr TF overview
PENGUUSDT.P — 1H Sell-Side Setup Breakdown
Date: Sun 16th Nov
Time: 2.00 am
Session: London Session AM
Direction: Sell-Side Trade
🔹Market Context & Narrative
The price is currently rotating within a multi-session distribution range, with repeated failures to sustain a buyside structure above 0.01330–0.01345.
The broader flow is bearish, supported by:
A continuous lower-high structure formed during the London to NY sessions. Multiple FVG inefficiencies filled and rejected (clear displacement candles prior)
Mid-range liquidity above Friday's 0.01335 area is acting as a consistent inducement.
🔹Smart Money Model Sequence
Inducement → FVG → Break of Structure (BOS) → Entry
🔹Sentiment & Narrative Summary
The chart shows a clear distribution, with each session presenting lower highs and reinforcing sell-side intent.

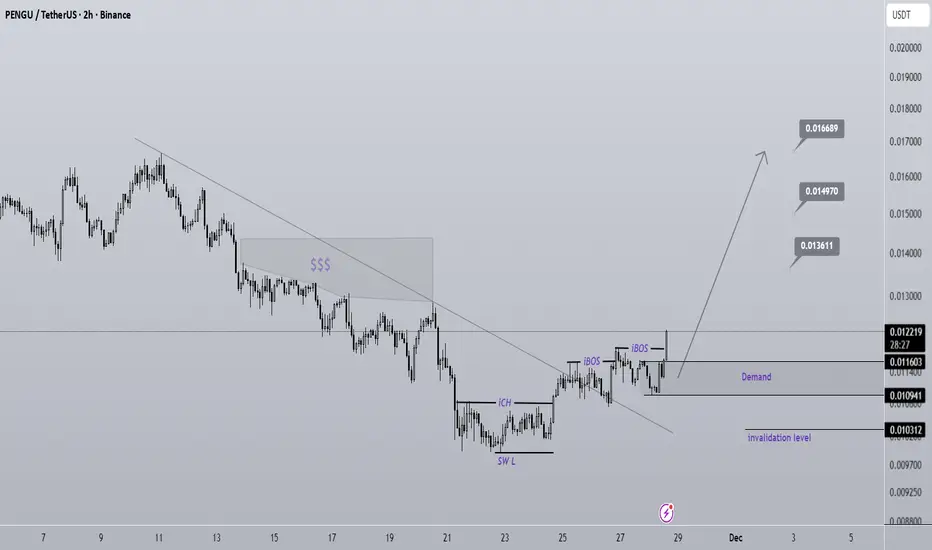
PENGU Looks Bullish (2H)Considering the iCH and the two iBOS, the lower timeframe structure has turned bullish, meaning we can look for buy/long positions within the small-timeframe order blocks.
We also have a liquidity pool on the chart that we expect to be swept soon.
The targets have been marked on the chart.
A 4-hour candle closing below the invalidation level will break this analysis.
Do not enter the position without capital management and stop setting
Comment if you have any questions
thank you
Long trade
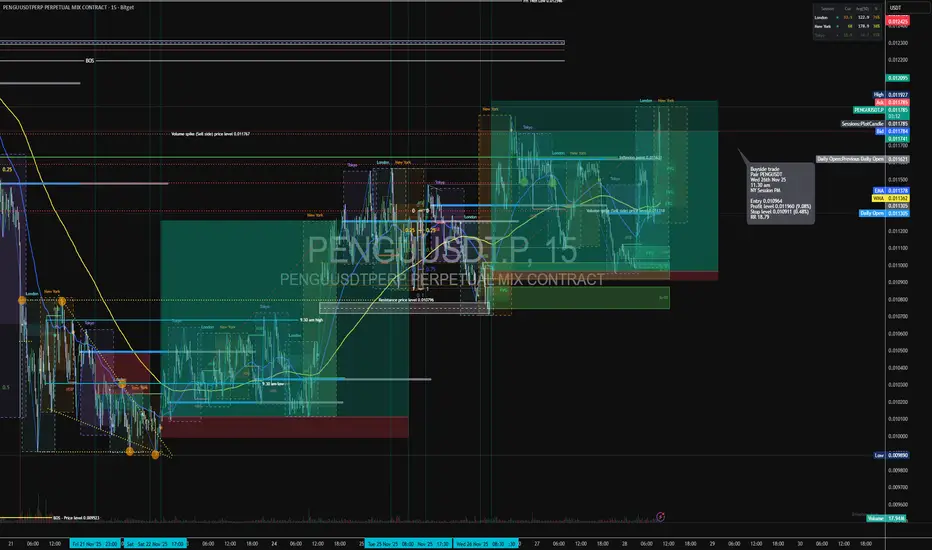
🟦 Trade Details
Direction: Buyside Trade
Pair: PENGUSDT
Date: Wed 26th Nov 25
Time: 11:30 am
Session: NY Session PM
🟩 Execution Metrics
Entry: 0.010964
Take Profit: 0.011960 (+9.08%)
Stop Loss: 0.010911 (–0.48%)
Risk-to-Reward: 18.79
🟧 Market Structure Context
Price respects session highs/lows across London → NY transitions.
Prior sell-side sweep brought price into a discount where buyers stepped in.
Clear BOS to the upside confirms bullish orderflow.
NY PM continuation aligns with earlier accumulation from London.
🟥 Liquidity Narrative
Liquidity engineered beneath 0.01090 levels.
Strong reaction from:
Volume spike (sell-side)
Session liquidity pools
Open-to-close inefficiencies
Final draw on liquidity targets:
The inefficiency above 0.01190
Session equal highs in premium
🟪 PD Arrays / POIs
Price retraced into:
FVG (discount zone)
PMD retracement alignment
NY PM bullish re-pricing zone
POI validated with rejection from previous Daily Open zone.
🟨 Entry Model
Entry taken on 15-minute confirmation after:
Micro BOS
Retest into discount FVG
Strong PM session displacement
Clear continuation model (ICT-style buyside draw)
🟫 Sentiment
Strong market interest, rising volatility into NY PM.
Volume confirming active accumulation.
Micro-cap rotational sentiment supportive of fast expansion moves.
🟩 Outcome
A high-probability, high-RR continuation trade.
Clean narrative: Sell-side sweep → Discount entry → BOS → Expansion to buyside inefficiency.
Long trade Pair: PENGUSDT
Direction: Buyside Trade
Date: Sat 22nd Nov 25
Time: 5.00 pm
Session: NY Session PM
Entry: 0.01012
Profit Target: 0.01269 (+25.38%)
Stop Level: 0.009922 (–1.88%)
RR: 21.39
15-Minute NY PM Session Reversal Model
1️⃣ Market Structure & Liquidity Story
A. Prior Trend: Sell-Side Delivery (sweep)
PENGUSDT has been in a bearish delivery sequence characterised by:
Multiple bearish FVGs in premium zones
A macro BOS below 0.009953
Redistribution ranges across London, New York, and Tokyo sessions
A clear downward algorithmic draw toward external liquidity.
B. Sell-Side Liquidity Pool Formation
Multiple lows seemed engineered between:
London session lows
NY lows at 0.00986
Tokyo lows at 0.00990
These repeated bounces form a liquidity shelf
(a perfect target for manipulation).
C. Price sharply wicks below: 0.0098 to 0.00979, the 3.30 am low
This sweep is validated by: Volume increase, Instant displacement upward
Rejection wick reclaiming the range. Removal of weak shorts
We assume this to be a manipulative SMC “STOP-RUN”
D. Bullish BOS (Break of Structure)
After the sweep: A strong displacement breaks the micro bearish structure
New York PM high at 0.009935 - broken. The structure flips bullish for the first time in 24 hours
Showing a CHoCH → BOS confirmation needed for entry requirement.
2️⃣ Institutional PD Arrays (Entry Model)
A. Breaker Block + Demand Zone
The entry zone (0.01000–0.01012) is built upon:
A breaker block formed after the failed bearish continuation
15M demand anchored to the sweep wick
Alignment with the daily open reclaim
🔹 Technical Context
Model Type:
Manipulation (Sell-Side Sweep) → CHoCH → BOS → Discount Re-entry → Expansion
Narrative Sequence:
Market builds sell-side liquidity under multi-session lows
A sharp stop run / sell-side sweep clears all liquidity at 0.00979
Bullish displacement prints a BOS
Price retraces neatly into: Breaker block, Bullish Fair Value Gap, Discount of previous range
NY PM session (high-probability expansion)
We anticipate the price to expand upward towards:
Internal liquidity
Premium inefficiencies
0.01269 target (FVG completion)
Sentiment:
"Fear-driven liquidity purge → bullish accumulation → aggressive expansion."
Cycle Position:
Micro accumulation inside intraday markdown → transition into buyside delivery.

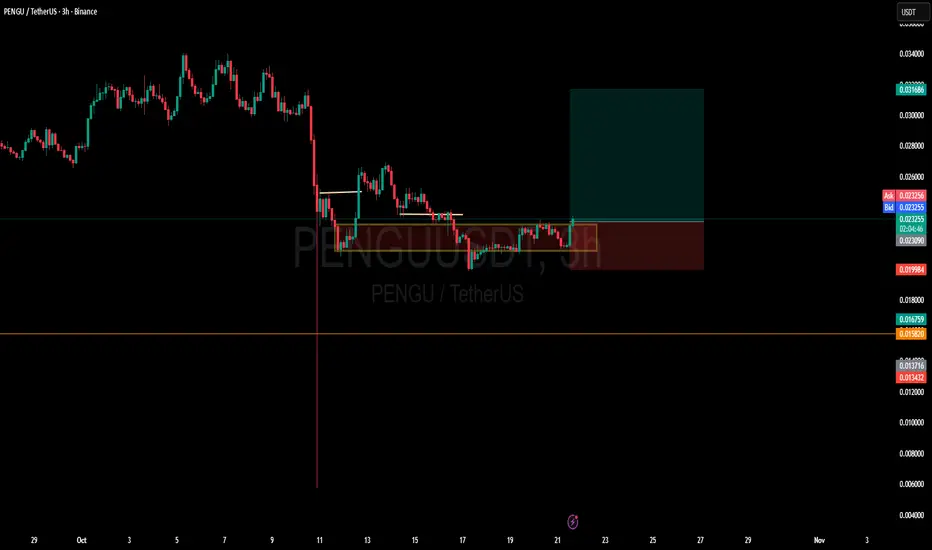
Short trade Trade Journal Entry #2 — Sell-Side Trade
Pair: PENGUUSDT.P
Date: Fri 21st Nov 25
Time: 11:00 pm
Session: Tokyo PM
Direction: Sell-Side
Timeframe: 15-min
🔹 Trade Details
Entry: 0.010486
Profit Target: 0.007730 (+24.57%)
Stop Loss: 0.012479 (–3.31%)
Risk-Reward Ratio: RR 10.63
15min TF overview
🔹 Technical Context
Model: Distribution → Sweep of Buyside Liquidity → Bearish BOS →
FVG/OB Stack → Sell-Side Continuation
Price swept liquidity above redistribution highs (0.01185 / 0.01195).
Final mitigation at inflexion point 0.011631, followed by a strong bearish displacement,
which caused major structure breaks at 0.009953. Multiple bearish. FVGs show continuous institutional selling. Internal low at 0.009744, External liquidity at 0.0088726 and Swing low 0.0082786.
🔹 Narrative / Sentiment
The market shifted decisively to bearish sentiment following the distribution of premiums.
Liquidity was taken from above highs → confirming intent to reprice lower. Tokyo session algorithm favoured sell-side continuation. Sentiment: "Distribution → Stop-Run → Breakdown → Sell-Side Target Delivery."
Trade Journal Entry #1 — Buyside Trade (Completed)
Pair: PENGUUSDT.P
Date: Wed 19th Nov 25
Time: 3:19 pm
Session: LND → NY PM
Direction: Buyside
Timeframe: 15-min
🔹 Trade Details
Entry: 0.011728
Profit Target: 0.012234 (+3.96%)
Stop Loss: 0.011634 (–1.13%)
Risk-Reward Ratio: RR 3.84
Outcome: Target Hit
Trade Duration: 3 hrs 45 mins
🔹 Technical Context
Model: Accumulation → Sweep of Sell-Side Liquidity → Bullish BOS → Re-entry via Discount
FVG. Price swept Tokyo lows beneath the yellow liquidity zone. Observed reaction produced a clean displacement candle breaking upward structure (BOS). A bullish FVG formed and provided the optimal entry on retracement. Observing the bullish OB underpinned the structure along with the daily Open bias, which supported upward continuation.
🔹 Narrative / Sentiment
The market was positioned to run buyside liquidity resting above intraday highs. Accumulation beneath the daily open signalled clear bullish intent. The volume expansion confirmed institutional buying. Sentiment: "Accumulation → Intent → Execution → Target Delivery."

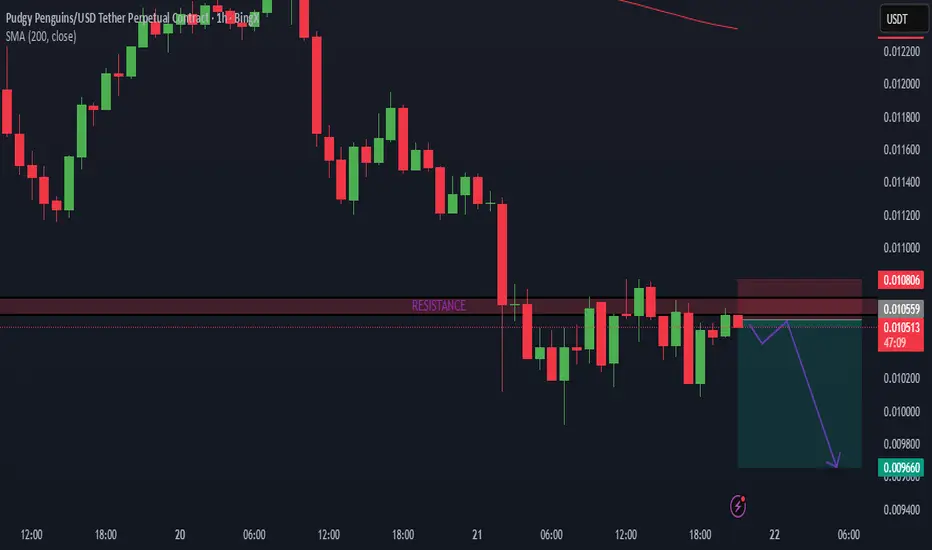
Bearish continuationPENGU has created a range between 0.0101 and 0.0107 and has been staying there for a few hours. The top of the range is serving as resistance and is still not broken so with the bearish pressure we have ssen recently price should just bounce from it and continue down.
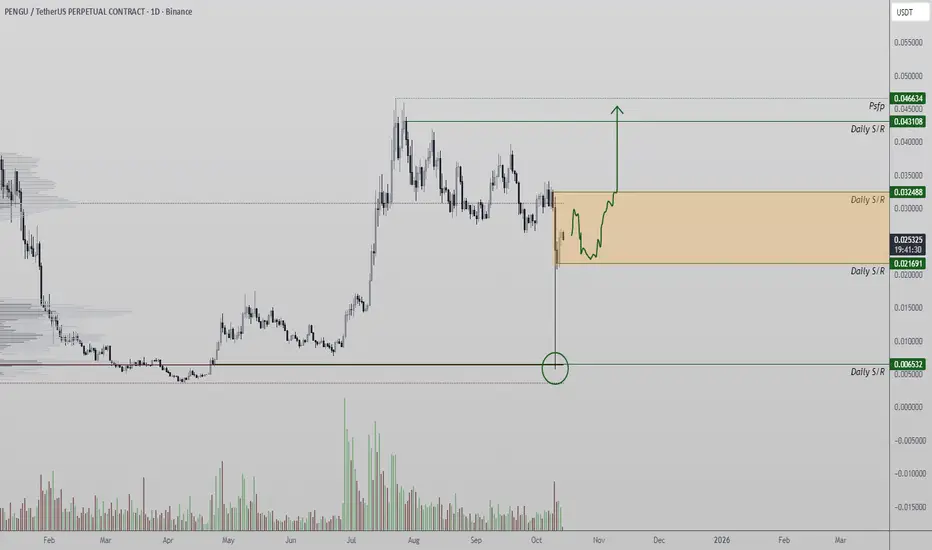
Pengu high potential 35%gain awaits toward 0.03070$Hi the support and resistances on the chart are based on the previous data and weekly candlesticks if BINANCE:PENGUUSDT holds this last support the potential of 35% gain is logical toward 0.03070$

PENGU Tests Key Confluence Zone, Bullish Reaction ?PENGU price action is currently trading at the Point of Control (POC), an area that aligns with both the 0.618 Fibonacci retracement and a previous daily support, forming a high-confluence region on the chart.
This zone represents a technically significant area where a potential reversal or relief bounce could emerge if bullish volume begins to increase.
- Confluence Zone: The POC, 0.618 Fibonacci, and daily support overlap to form a key inflection
point.
- Volume Watch: A spike in bullish volume could confirm the start of a reversal from this region.
For now, further consolidation around the current level would be constructive, allowing price to form a bottoming structure on lower timeframes. While this has not yet materialized, holding the POC keeps the probability of a short-term bounce alive.
PENGU remains in a critical decision area, where either a confirmed reversal or deeper continuation will be determined in the coming sessions.
BTC QuantSignals V3 Crypto 2025-11-09BTC QuantSignals V3 Crypto 2025-11-09
BTC Crypto Signal | 2025-11-09
• Direction: NEUTRAL | Confidence: 68%
• Timeframe: 15M
• Entry Range: $103500.00
• Target 1: $105586.35
• Stop Loss: $102800.00
• Volume vs Avg: 1.0×
• Recent Move: +1.31%
• ⚠️ MODERATE RISK WARNING: Consider reducing position size due to moderate confidence level.
⚖️ Compliance: Educational crypto commentary for QS Premium. Not financial advice.
🚀 QS V3 ELITE CRYPTO ANALYSIS
Generated: 2025-11-09 07:32:08 UTC
Instrument: BTC ($103516.028483)
Trend: BULLISH
Confidence: 65.0%
Timeframe: 15M
Model: QS + Katy AI
Strictness: MEDIUM
🎯 TRADE RECOMMENDATION
Direction: LONG
Confidence: 68%
Conviction Level: MEDIUM
Leverage: 3x
🧠 ANALYSIS SUMMARY
Katy AI Signal: Sideways trend with 65% confidence, but current market momentum shows +1.31% bullish move with technical breakout patterns suggesting upward continuation
Technical Analysis: Price above key EMA levels, RSI at 58 showing room for upward movement, volume supporting recent bullish breakout from consolidation zone
News Sentiment: Neutral impact from recent weekly reports with no major catalysts, allowing technical factors to dominate price action
Options Flow: Institutional put/call ratio shows slight bullish bias with increased call buying activity for near-term expirations
Risk Level: MODERATE - Katy's sideways prediction creates uncertainty but technical momentum favors longs
💰 TRADE SETUP
Entry Price: $103450.00 - $103550.00
Take Profit 1: $105586.35 (2.1% gain)
Take Profit 2: $107200.00 (3.6% gain)
Stop Loss: $102800.00 (0.7% loss)
Position Size: 4% of capital (adjusted for leverage and Katy's reduced confidence)
⚡ COMPETITIVE EDGE
Why This Trade: Technical breakout pattern combined with institutional options flow supports upward momentum despite Katy's neutral bias
Timing Advantage: Capturing the early stages of a potential
Image
QS Analyst
APP
— 7:32 AM
bullish continuation move with tight risk management
Risk Mitigation: Tight stop loss below recent support with position sizing reflecting Katy's reduced confidence
Leverage Strategy: Conservative 3x leverage to account for Katy's sideways prediction while capturing upside potential
🚨 IMPORTANT NOTES
⚠️ MODERATE RISK - Katy AI predicts sideways movement but technical momentum suggests bullish continuation. Reduced position size recommended.
⚠️ KATY CONFLICT EXPLANATION
Katy predicted sideways trend with 65% confidence over 120-minute horizon
Override justified due to strong technical breakout signals and momentum indicators showing bullish continuation
Specific factors: Recent +1.31% move breaking above key resistance, RSI momentum supporting further upside, institutional call buying activity
Additional risk: Position requires tighter stop loss and reduced sizing to account for Katy's neutral bias
📊 TRADE DETAILS 📊
🎯 Instrument: BTC
🔀 Direction: LONG 📈
💵 Entry Price: 103500.00
🎯 Profit Target: 105586.35
🛑 Stop Loss: 102800.00
📏 Size: 4.0
📈 Confidence: 68%
⏰ Entry Timing: N/A
🕒 Signal Time: 2025-11-09 10:32:05 EST
⚠️ MODERATE RISK WARNING: Consider reducing position size due to moderate confidence level.
---
QS V3 Crypto Strategy System - Professional cryptocurrency trading with Katy AI intelligence and 24/7 market analysis.

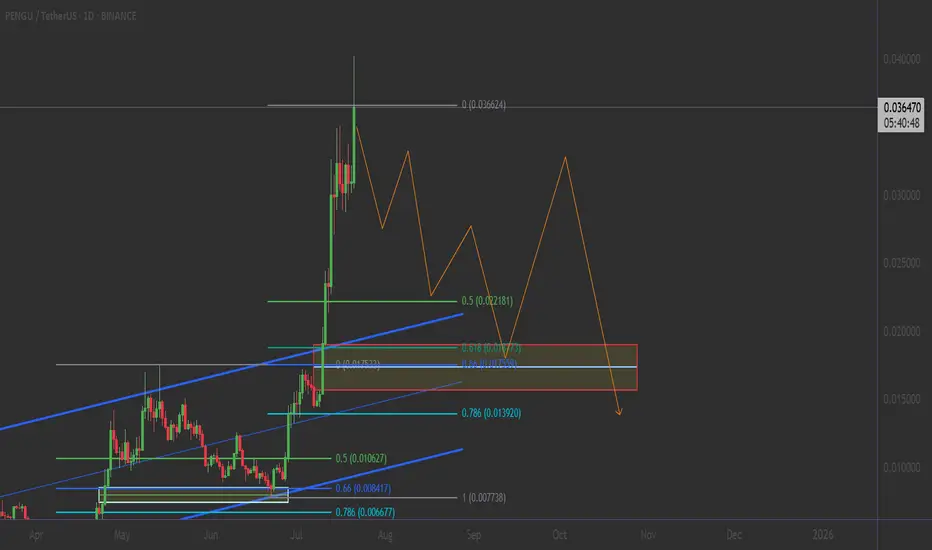
PENGU/USDT: THE ULTIMATE FIBONACCI RETRACEMENT PLAY💎 THE GOLDEN SETUP: 5-Point Technical Confluence
1️⃣ FIBONACCI MASTERCLASS IN ACTION
0.5 Fib Level: $0.021181 (HELD PERFECTLY) ✅
0.618 Golden Ratio: $0.017920 (Strong Support Zone)
0.786 Deep Retracement: $0.013920 (Ultimate Backstop)
Current Position: Trading above 0.5 Fib = BULLISH CONTROL
__________________
❌ BEARISH
Break below $0.029 (Channel support)
Failure to hold 0.5 Fib level ($0.021)
Volume declining on any pullback
PENGU / USDT : Bullish continuation setup / Target 10-15%Pengu / USDT is showing strength to continue its bullish momentum after the recent pullback.
Price is approaching key support zones that could trigger a 10–15% short-term move if held successfully. Watch these levels closely for confirmation.
Manage risk wisely and avoid early entries.

PENGU bear market started for it#PENGU / USDT
Price lost 6 months uptrend line which is breakdown bullish structure
As result this could be just the beginning of bearish market for it in the coming weeks
Invalidation: price will turn bullish if ONLY able to breakout and hold above red zone marked in my chart
Note : price wont drop as straight line it moves like waves

PENGU Approaches Point of Control — Weakness PersistsPENGU price action continues to trend lower, maintaining a bearish market structure characterized by consecutive lower lows and lower highs. The market now approaches the Point of Control (POC) of its broader trading range — a key level where previous high-volume activity occurred and where short-term reactions are often observed.
While a temporary bounce from this region is possible, overall momentum remains weak. The lack of sustained bullish confirmation suggests that risk continues to outweigh potential upside, and any failure to hold the POC could lead to an accelerated decline toward lower supports.
Key Points:
- Bearish Trend: Price continues to form lower highs and lower lows across timeframes.
- Critical Level: The Point of Control serves as an immediate inflection zone.
- Downside Target: Losing POC opens the path to daily support at $0.006.
From a technical standpoint, the market remains vulnerable as long as price stays below prior swing highs.
What to Expect:
If the POC fails to hold, expect further downside toward $0.006. A strong reaction from this level could, however, trigger a short-term bounce before broader weakness resumes.

PENGUUSDT.P - November 1, 2025PENGUUSDT.P is showing a series of higher lows supported by an ascending trendline, indicating sustained bullish pressure. The planned long setup targets the $0.019059 profit level, with a stop placed near $0.0177738 for clear risk management. A break above the breakeven zone would confirm bullish continuation toward the upper resistance, maintaining a constructive bias while price holds above trendline support.

PENGUUSDT : BUY LIMITHello friends
Given the good growth we had and the entry of buyers, now that the price is correcting, there is a good opportunity to buy with risk and capital management and in steps at the specified supports and move with it to the specified targets.
*Trade safely with us*

PENGUUSDT.P - October 30, 2025Bullish Bias: PENGUUSDT.P is consolidating near the $0.019 support zone, showing potential accumulation after a prolonged downtrend. A breakout above $0.0269 would confirm bullish momentum and open room toward $0.0325 as the next resistance.
Bearish Bias: Price remains in a clear downtrend with lower highs and lows, and sustained weakness below $0.019 would likely trigger continuation toward the $0.009 region. Until a confirmed breakout occurs, momentum favors sellers.
The token is currently in a volatility squeeze, indicating that a big move in either direction is coming anytime soon.

PENG positioned for the NORTHCan we have a shift in structures and then position for a better buy. This is just an effort towards creating a learning of trendline, support and resistance, supply and demand zone
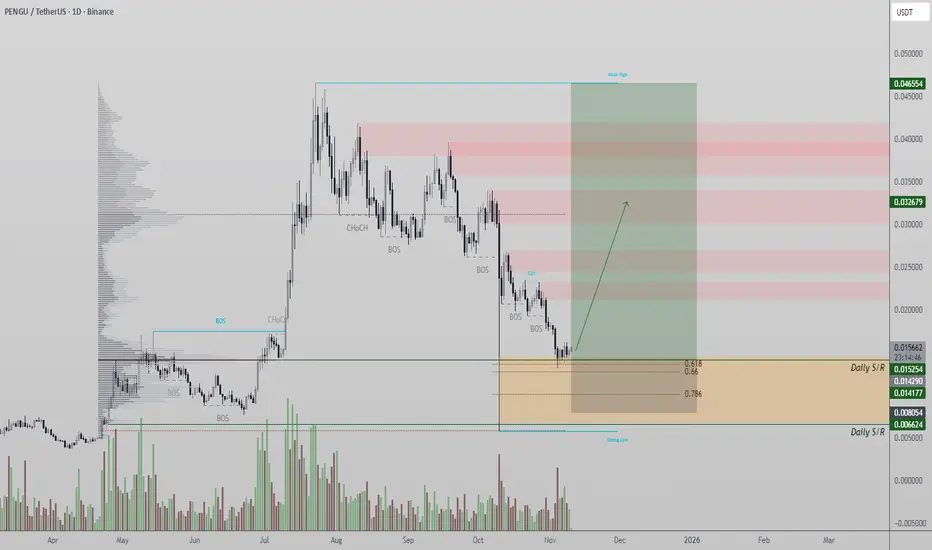
Pengu Holding Key Support Zone for Potential RotationPengu price action has shown strong volatility as it rebounded sharply from the daily support region, signaling active buyer presence at lower levels. This reaction highlights the importance of the 0.02 support zone, where structural demand is concentrated.
Key Technical Points:
- Support: 0.02 daily level holding firm
- Resistance: 0.065 local value area high
- Structure: Range-bound consolidation forming
Price is currently consolidating between the daily support and the local value area high, creating a neutral-to-bullish structure. A clean daily close above the 0.065 resistance could trigger continuation toward higher targets, reclaiming momentum for bulls.
However, any failure to maintain structure above the 0.02 base would expose the chart to a deeper pullback into prior demand zones. Volume remains moderate, suggesting the next impulsive move will likely determine short-term direction.
PENGU USDT ABOUT TO EXPLODE AFTER THE CRASHPENGU usdt has successfully retested the trendline it broke previously and really looks in a great position to fly. Stick together penguins......
