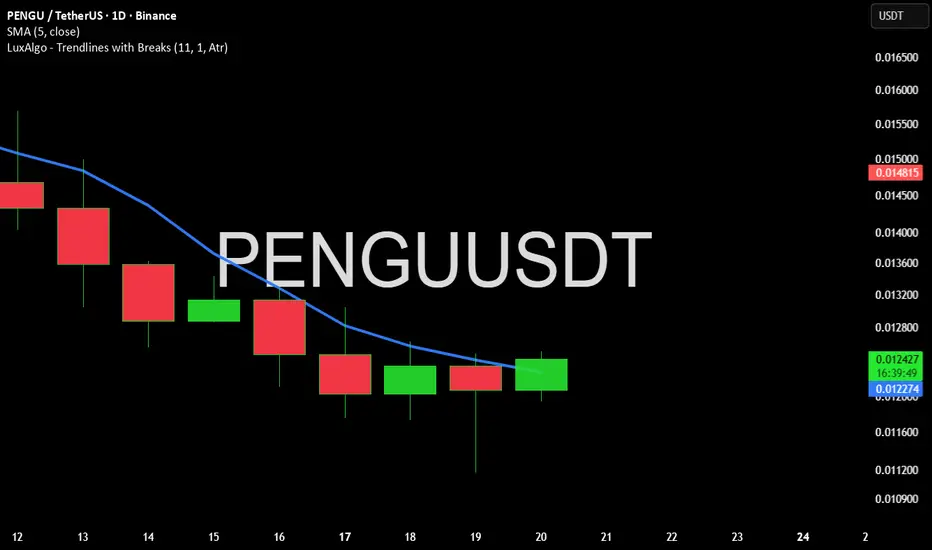
PENGU - BEARISH $PENGU - price analysis 🟥
Very bearish trend at the moment & no buy pressure📉
Price will likely continue to fall toward 0.00800$ lower key demand zone! 📉
Possible setup & key levels are in my charts.🐧
Not a financial advice.

PENGU 0.012 i see bottom guys and i aped ina meme coin that was so popular among rich kids
perhaps i want to buy and brag it when it goes back to rick kids high price
PENGU/USDT: Critical Decision Point - Reclaim or Cascade?💡 Scenario Mapping
🚀 BULLISH Case: 3D frame :
If price holds above $0.012 and reclaims $0.0125:
Potential bounce toward the $0.025-0.028 range
Accumulation phase begins (blue box scenario)
Higher lows formation = trend reversal confirmation
⚡ Trading Gameplan
For Long-Term Holders:
Wait for conf

Short trade
1Hr TF overview
PENGUUSDT.P — 1H Sell-Side Setup Breakdown
Date: Sun 16th Nov
Time: 2.00 am
Session: London Session AM
Direction: Sell-Side Trade
🔹Market Context & Narrative
The price is currently rotating within a multi-session distribution range, with repeated failures to sustain a buyside st

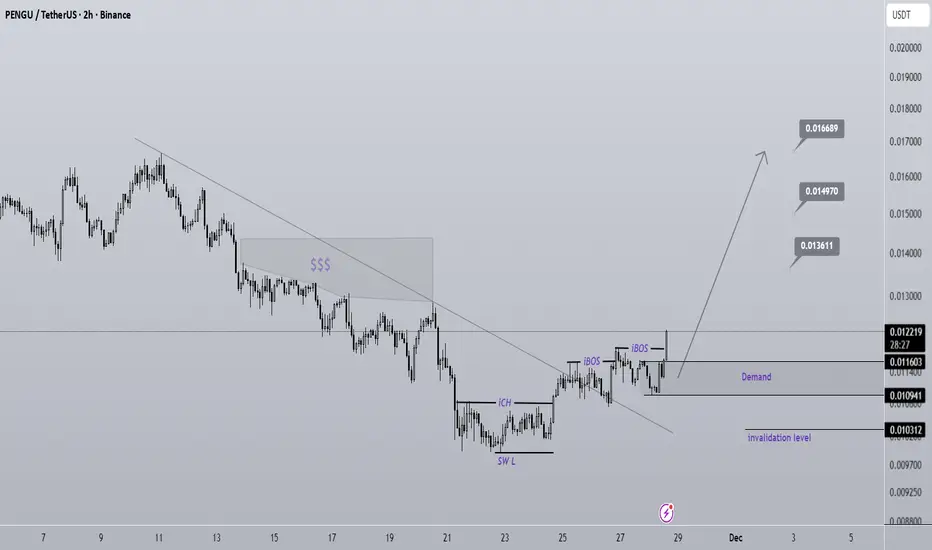
PENGU Looks Bullish (2H)Considering the iCH and the two iBOS, the lower timeframe structure has turned bullish, meaning we can look for buy/long positions within the small-timeframe order blocks.
We also have a liquidity pool on the chart that we expect to be swept soon.
The targets have been marked on the chart.
A 4-ho
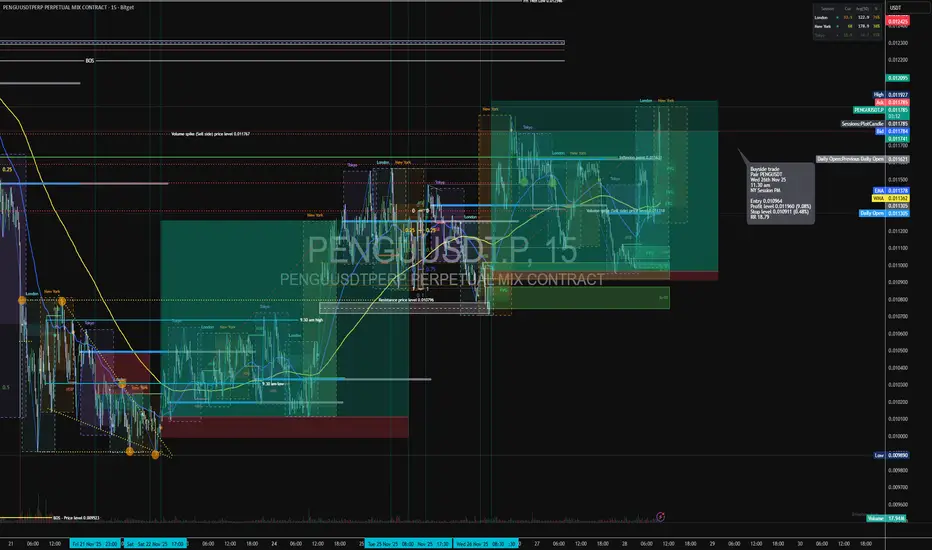
Long trade
🟦 Trade Details
Direction: Buyside Trade
Pair: PENGUSDT
Date: Wed 26th Nov 25
Time: 11:30 am
Session: NY Session PM
🟩 Execution Metrics
Entry: 0.010964
Take Profit: 0.011960 (+9.08%)
Stop Loss: 0.010911 (–0.48%)
Risk-to-Reward: 18.79
🟧 Market Structure Context
Price respects session highs/lows a
Long trade Pair: PENGUSDT
Direction: Buyside Trade
Date: Sat 22nd Nov 25
Time: 5.00 pm
Session: NY Session PM
Entry: 0.01012
Profit Target: 0.01269 (+25.38%)
Stop Level: 0.009922 (–1.88%)
RR: 21.39
15-Minute NY PM Session Reversal Model
1️⃣ Market Structure & Liquidity Story
A. Prior Trend: Sell-Side Delive

Short trade Trade Journal Entry #2 — Sell-Side Trade
Pair: PENGUUSDT.P
Date: Fri 21st Nov 25
Time: 11:00 pm
Session: Tokyo PM
Direction: Sell-Side
Timeframe: 15-min
🔹 Trade Details
Entry: 0.010486
Profit Target: 0.007730 (+24.57%)
Stop Loss: 0.012479 (–3.31%)
Risk-Reward Ratio: RR 10.63
15min TF overview

See all ideas
Summarizing what the indicators are suggesting.
Oscillators
Neutral
SellBuy
Strong sellStrong buy
Strong sellSellNeutralBuyStrong buy
Oscillators
Neutral
SellBuy
Strong sellStrong buy
Strong sellSellNeutralBuyStrong buy
Summary
Neutral
SellBuy
Strong sellStrong buy
Strong sellSellNeutralBuyStrong buy
Summary
Neutral
SellBuy
Strong sellStrong buy
Strong sellSellNeutralBuyStrong buy
Summary
Neutral
SellBuy
Strong sellStrong buy
Strong sellSellNeutralBuyStrong buy
Moving Averages
Neutral
SellBuy
Strong sellStrong buy
Strong sellSellNeutralBuyStrong buy
Moving Averages
Neutral
SellBuy
Strong sellStrong buy
Strong sellSellNeutralBuyStrong buy
Displays a symbol's price movements over previous years to identify recurring trends.