Lingrid | PEPEUSDT Breakdown from Range May Spark SellingBINANCE:PEPEUSDT perfectly played out my previous trading idea . Price has lost its consolidation range and continues to print lower highs under a descending trendline, confirming bearish control. The breakdown below the range support signals trend continuation rather than exhaustion, with sellers
Related pairs

PEPE — is it time to buy? Right now, in my view, it’s the best time for spot buying in the market. And one of the assets I’m actively accumulating is PEPE.
Why? Just a couple of months ago I wrote that it’s an outdated and useless asset, and now I’m buying it. How did that happen?
✅ The price is now at its lowest levels i

PEPE: Weekly Downtrend; Breakout or Fade?PEPE bounced from the demand zone and is pushing into the weekly downtrend line. Plan is to wait for a clean breakout, then ride momentum higher instead of guessing the reversal early.
Entry (long):
👉 Anywhere inside / just above the grey box, around 0.00000034–0.00000038.
Stop‑loss:
❌ Below the d

NLDN | PEPEUSDT SHORT/SELLING PEPEUSDT 📉4H
SHORT
Entry 0.00427
SL 0.00406
TP 0.00365
Should you find this analysis insightful, I invite you to like or leave a comment. Constructive feedback and suggestions are greatly appreciated. For further analyses, please follow me at @ydnldn.

PEPEFull Elliott Wave cycle is completed on PEPE
But is it going to start a new one? For me is a question
Reversal and some bounce will happen for sure
Lets look how it will be structured
Probably I will like to see Wave 1 as Leading Diagonal

NLDN | BONKUSDT BONKUSDT 📉4H
SHORT
Entry 0.00427
SL 0.00406
TP 0.00365
Should you find this analysis insightful, I invite you to like or leave a comment. Constructive feedback and suggestions are greatly appreciated. For further analyses, please follow me at @ydnldn.

PEPE Roadmap (3D)If we want to see what PEPE is doing on higher timeframes, we need to analyze it on larger timeframes.
It appears that Wave A of the new cycle will end within the green zone, and the price will enter a retracement for Wave B.
Wave B has two targets, which we have marked on the chart.
Let’s see wh

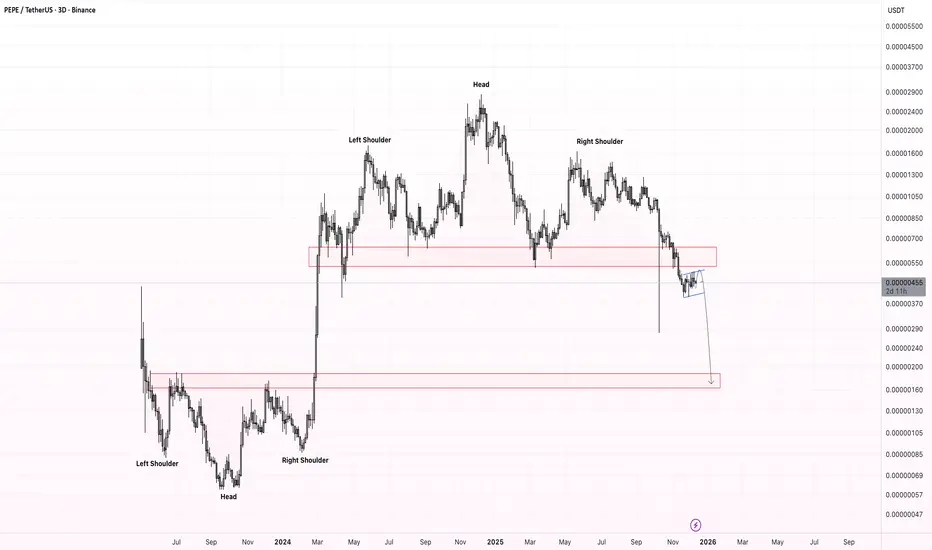
PEPE: Bearish Structure After Major Reversal PatternInitially, PEPE showed a powerful impulsive rally formed through an inverse Head and Shoulders reversal pattern. However, at the top a clear Head and Shoulders pattern has appeared, signaling a potential macro reversal.
Locally, the price is forming a bearish flag , which supports the continua
PEPE Falling Wedge at Long-Term Support ZonePEPE is forming a clear falling wedge structure after a prolonged downtrend. Price action is compressing between converging downward trendlines, showing a slowdown in bearish momentum as sellers lose strength near the lower boundary.
The recent liquidity sweep below support followed by consolidatio

Pepe Gann Fann Bottom LevelDoing a quick up and down gann on Pepe shows us the best possible entry:
0.033 to 0.034 as a possible bottom not he weekly.
The move would then takes us to 1/1 of the red downward facing gann for next breakout and TP

See all ideas
Summarizing what the indicators are suggesting.
Oscillators
Neutral
SellBuy
Strong sellStrong buy
Strong sellSellNeutralBuyStrong buy
Oscillators
Neutral
SellBuy
Strong sellStrong buy
Strong sellSellNeutralBuyStrong buy
Summary
Neutral
SellBuy
Strong sellStrong buy
Strong sellSellNeutralBuyStrong buy
Summary
Neutral
SellBuy
Strong sellStrong buy
Strong sellSellNeutralBuyStrong buy
Summary
Neutral
SellBuy
Strong sellStrong buy
Strong sellSellNeutralBuyStrong buy
Moving Averages
Neutral
SellBuy
Strong sellStrong buy
Strong sellSellNeutralBuyStrong buy
Moving Averages
Neutral
SellBuy
Strong sellStrong buy
Strong sellSellNeutralBuyStrong buy
Displays a symbol's price movements over previous years to identify recurring trends.
Frequently Asked Questions
The current price of PEPE / TetherUS (PEPE) is 0.00000385 USDT — it has fallen −1.00% in the past 24 hours. Try placing this info into the context by checking out what coins are also gaining and losing at the moment and seeing PEPE price chart.
PEPE / TetherUS price has fallen by −2.21% over the last week, its month performance shows a −3.40% decrease, and as for the last year, PEPE / TetherUS has decreased by −79.16%. See more dynamics on PEPE price chart.
Keep track of coins' changes with our Crypto Coins Heatmap.
Keep track of coins' changes with our Crypto Coins Heatmap.
PEPE / TetherUS (PEPE) reached its highest price on Dec 9, 2024 — it amounted to 0.00002836 USDT. Find more insights on the PEPE price chart.
See the list of crypto gainers and choose what best fits your strategy.
See the list of crypto gainers and choose what best fits your strategy.
PEPE / TetherUS (PEPE) reached the lowest price of 0.00000060 USDT on Sep 17, 2023. View more PEPE / TetherUS dynamics on the price chart.
See the list of crypto losers to find unexpected opportunities.
See the list of crypto losers to find unexpected opportunities.
The safest choice when buying PEPE is to go to a well-known crypto exchange. Some of the popular names are Binance, Coinbase, Kraken. But you'll have to find a reliable broker and create an account first. You can trade PEPE right from TradingView charts — just choose a broker and connect to your account.
Crypto markets are famous for their volatility, so one should study all the available stats before adding crypto assets to their portfolio. Very often it's technical analysis that comes in handy. We prepared technical ratings for PEPE / TetherUS (PEPE): today its technical analysis shows the sell signal, and according to the 1 week rating PEPE shows the sell signal. And you'd better dig deeper and study 1 month rating too — it's sell. Find inspiration in PEPE / TetherUS trading ideas and keep track of what's moving crypto markets with our crypto news feed.
PEPE / TetherUS (PEPE) is just as reliable as any other crypto asset — this corner of the world market is highly volatile. Today, for instance, PEPE / TetherUS is estimated as 3.12% volatile. The only thing it means is that you must prepare and examine all available information before making a decision. And if you're not sure about PEPE / TetherUS, you can find more inspiration in our curated watchlists.
You can discuss PEPE / TetherUS (PEPE) with other users in our public chats, Minds or in the comments to Ideas.