US NAS 100Preferably suitable for scalping and accurate as long as you watch carefully the price action with the drawn areas.
With your likes and comments, you give me enough energy to provide the best analysis on an ongoing basis.
And if you needed any analysis that was not on the page, you can ask me with a comment or a personal message.
Enjoy Trading ;)
NAS100 trade ideas

NAS100 Long Idea: Bullish Retest of Flipped SupportHello TradingView Community,
This is a technical analysis of a potential long opportunity on the US 100 Cash CFD (NAS100) on the 15-minute timeframe.
Technical Analysis:
The index is currently in a clear uptrend, as indicated by the series of higher highs and higher lows. We can identify a key horizontal level at approximately 24,413.4. This level previously acted as a significant resistance point, where the price was rejected multiple times.
Recently, the price has successfully broken out above this resistance and is now pulling back to retest it from above. This is a classic "resistance-turned-support" pattern, which often suggests that buyers are stepping in to defend the new support level, leading to a potential continuation of the uptrend.
Trade Setup:
The long position tool on the chart outlines a potential trade plan based on this bullish scenario:
Entry: Approximately 24,413.4 (at the retest of the new support).
Stop Loss: 24,170.3 (placed below the support structure to invalidate the idea if the level fails to hold).
Take Profit: 25,156.5 (targeting a new higher high in the current trend).
This setup provides a structured plan with a favorable risk-to-reward ratio for a potential move higher.
Disclaimer: This analysis is for educational and discussion purposes only and should not be considered as financial advice. Trading CFDs and indices involves a high level of risk. Please conduct your own research and manage your risk appropriately.

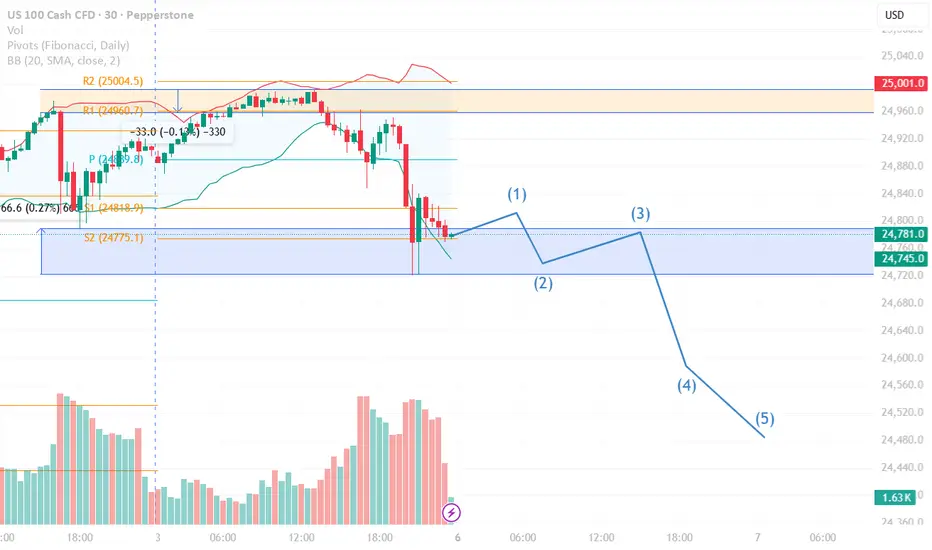
US100: Strong resistance sell setup on the 30-minute chart
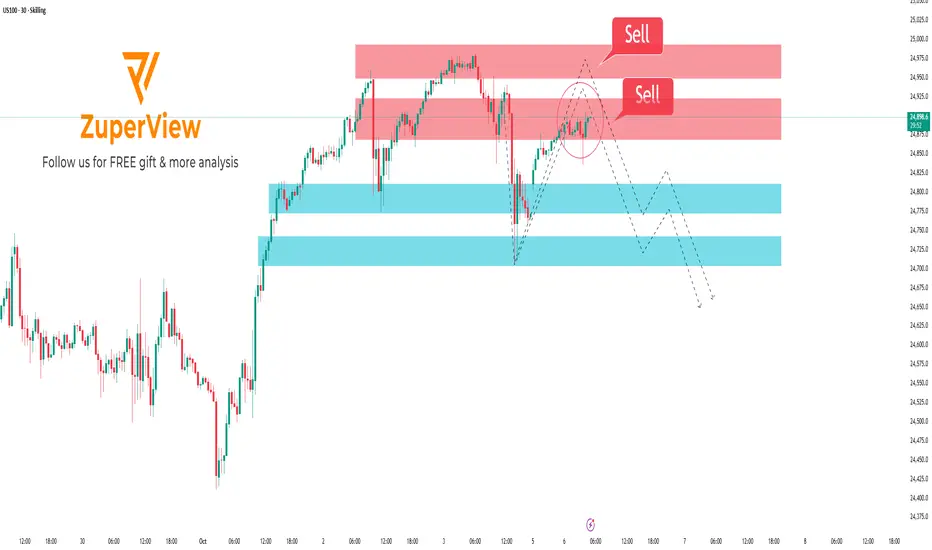
📈 SKILLING:US100 — Technical Analysis: Sell Setup Near Strong Resistance
🔍 Technical Analysis:
• Currently, US100 price is approaching a significant resistance zone (highlighted in red). This area has acted as a strong ceiling in recent sessions, where sellers tend to emerge.
• The price has rallied back after a sharp decline but is showing signs of slowing momentum as it nears this resistance. This often leads to a rejection rather than a clean breakout, especially on a 30-minute timeframe.
• Below, the light blue zones represent key support levels, which could serve as realistic targets if sellers regain control. These zones are important areas where buyers previously stepped in, creating potential bounce points.
• The drawn dashed lines illustrate a possible price path: a test of the resistance level, failure to break higher, followed by a pullback and continuation of the downward trend.
• For confirmation of the sell setup, traders should look for reversal candlestick patterns such as rejection wicks (long upper shadows), bearish engulfing candles, or pin bars at the resistance zone. These signals help validate that sellers are gaining dominance.
• Volume and momentum indicators should also be monitored for divergence or weakening bullish pressure near resistance to strengthen the case for a sell.
📊 Trade Considerations:
• Entering a sell position should be done only after clear confirmation of price rejection at resistance.
• Setting a stop loss slightly above the resistance zone helps manage risk in case of a false breakout.
• Targets can be placed near the support zones (light blue areas), with partial profit-taking to lock gains while allowing some position to run if price reacts there.
📌 Summary:
The technical structure of US100 on the 30-minute chart suggests a high probability of price reversal from the strong resistance area. A cautious sell setup is favored, waiting for confirming price action signals to reduce risk. Proper risk management is essential to navigate potential volatility near this key level.
Please like and comment below to support our traders. Your reactions will motivate us to do more analysis in the future 🙏✨
Harry Andrew @ ZuperView
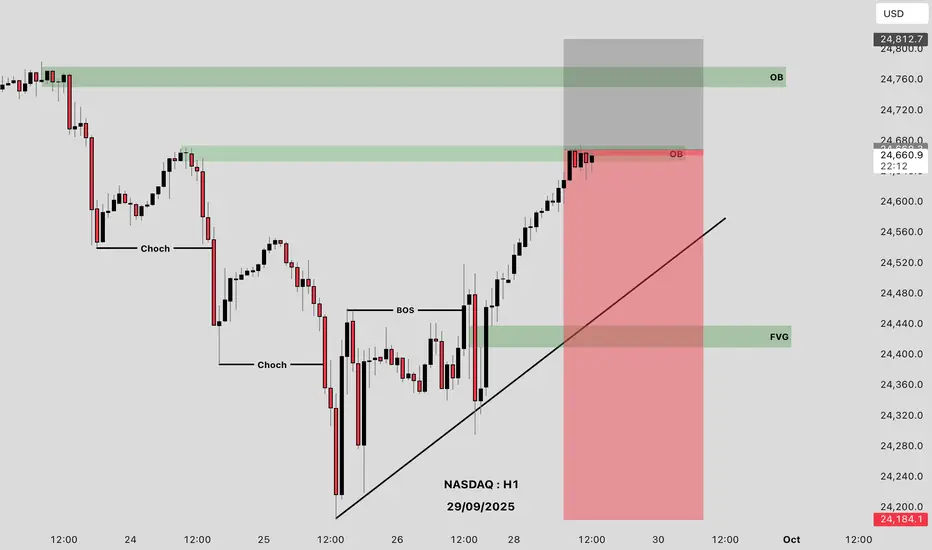
NASDAQ H1 OUTLOOKLets Nasdaq Sell
Reasons
Bearish Order Block
Who Is With Me Comment Your Opinion
Good Luck Guys
NAS100We have completed a major Wave 3, and we are now in a corrective Wave 4. The entry zone with targets has been identified, and the final target will be at the new historical highs of 25,200.

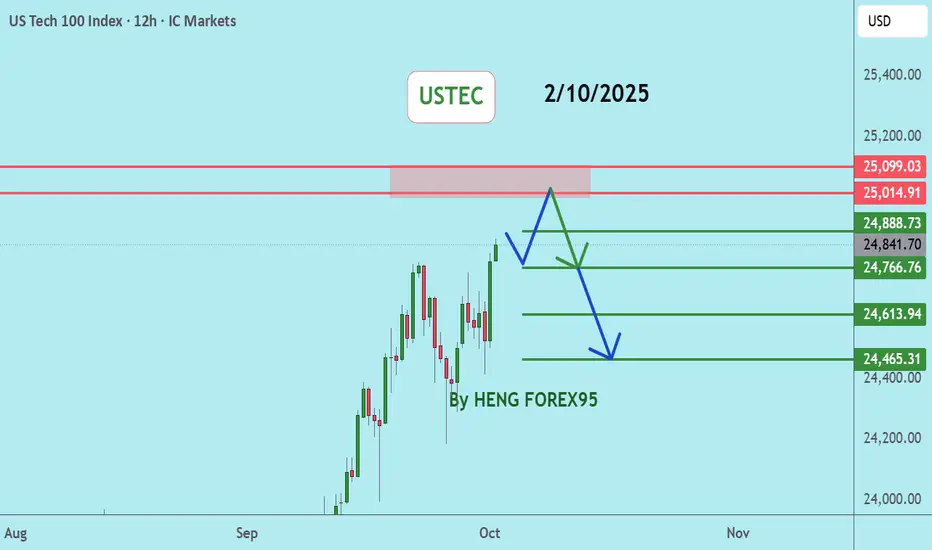
USTEC, NASDAQNasdaq price is still in a strong uptrend, there is a chance to test the 25014-25124 level. If the price cannot break through the 25124 level, it is expected that the price will have a chance to go down. Consider selling in the red zone.
🔥Trading futures, forex, CFDs and stocks carries a risk of loss.
Please consider carefully whether such trading is suitable for you.
>>GooD Luck 😊
❤️ Like and subscribe to never miss a new idea!
NAS100 - TRADER EDGE🎯 KEY PIVOT ZONE
SUPPLY ZONE: 24,580-24,620
➡️3 POC lines cluster with dense VRVP node creating resistance ceiling
➡️High-volume consolidation area with multiple rejections
➡️Price currently AT pivot zone - decision point
📊 PRICE TARGETS-
UPSIDE TARGETS ⬆️
T1: 24,680-24,710
T2: 24,740-24,780
DOWNSIDE TARGETS ⬇️
T1: 24,400-24,440
T2: 24,280-24,320
⚡💎⚡ EDGE - HIGHEST PROBABILITY PLAY
Short from 24,580-24,620 rejection targeting 24,400-24,440 then 24,280-24,320
🔍 PRE-ENTRY CONFIRMATION SIGNALS
✅ Price reaches 24,590+ with bearish rejection candlestick (long wick/engulfing)
✅ Lower high formation below 24,620 with momentum shift
✅ Volume spike on rejection candle confirming seller presence
📈 TRADE SETUP
🔴PRIMARY BIAS: BEARISH
Short Setup:
Entry: 24,590-24,610 after confirmations
Stop Loss: 24,655
🎯Target 1: 24,400-24,440
🎯Target 2: 24,280-24,320
Risk/Reward: 1:3.3 / 1:6.2
🔄 BIAS FLIP CONDITIONS
🟢TURNS BULLISH IF:
Clean break and 2H close above 24,630
Volume expansion on breakout (1.5x average)
Retest of 24,600-24,620 holds as support
Then Target:
🎯24,680-24,710
🎯24,740-24,780
⚠️ RISK MANAGEMENT
Max Risk: 60 points per contract
Position Size: Risk 1-2% account per trade
Time Stop: Only trade within NYSE's peak volume segments

US NAS100Preferably suitable for scalping and accurate as long as you watch carefully the price action with the drawn areas.
With your likes and comments, you give me enough energy to provide the best analysis on an ongoing basis.
And if you needed any analysis that was not on the page, you can ask me with a comment or a personal message.
Enjoy Trading ;)

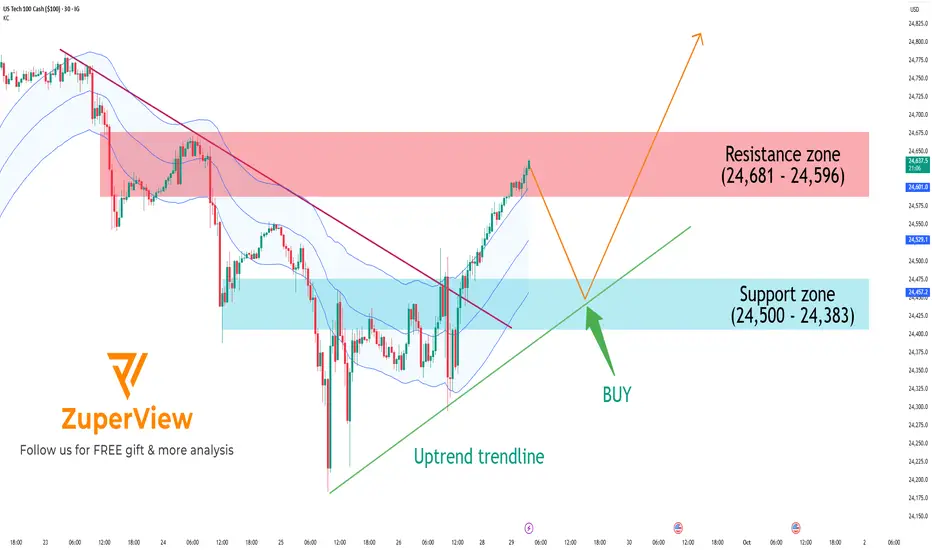
US100: Approaching resistance, pullback likely before breakoutThe IG:NASDAQ has shown a strong short-term recovery after breaking a major descending trendline. However, price is now testing a significant resistance zone, and a technical pullback is likely before the uptrend can continue.
📊 Technical Analysis: 30-minute Chart
📉 1. Overall Trend
Price has successfully broken above a descending trendline (red line), shifting market structure from bearish to bullish.
An uptrend line (green) is now acting as dynamic support.
Price is trading near the upper band of the Keltner Channel, indicating sustained bullish momentum.
🟥 2. Resistance Zone: 24,596 – 24,681
This zone has acted as a strong supply area in the past, causing multiple rejections.
Price is currently testing this area again → a rejection or short-term pullback is highly probable.
🟦 3. Support Zone: 24,383 – 24,500
This zone overlaps with previous consolidation and aligns with the uptrend line.
If a pullback occurs, this area could attract buyers and act as a launchpad for the next leg up.
🔁 Potential Trade Setups
✳️ Primary Scenario (preferred):
Price rejects at resistance → pulls back to support → bounces and resumes the uptrend
Wait for a pullback toward 24,500 – 24,383
Look for bullish price action (e.g., bullish engulfing, hammer) for entry
Enter long if support holds:
🎯 TP1: 24,650
🎯 TP2: 24,700+
🛑 SL: Below 24,350 (trendline invalidation)
🔻 Alternative Scenario (risk):
If price breaks below 24,383 and the uptrend line fails → short-term trend could shift sideways or bearish
Avoid long entries without a confirmed recovery
Re-evaluate trend structure if support fails
✅ Conclusion
A short-term uptrend is in place
However, price is now testing a major resistance zone, and a healthy pullback is likely
Please like and comment below to support our traders. Your reactions will motivate us to do more analysis in the future 🙏✨
US NAS100Preferably suitable for scalping and accurate as long as you watch carefully the price action with the drawn areas.
With your likes and comments, you give me enough energy to provide the best analysis on an ongoing basis.
And if you needed any analysis that was not on the page, you can ask me with a comment or a personal message.
Enjoy Trading ;)

Nas100 Trade Set Up Oct 3 2025If price inverts this 4h FVG i will wait for a retest back into it to take sells down to SSL or PDL
www.tradingview.com

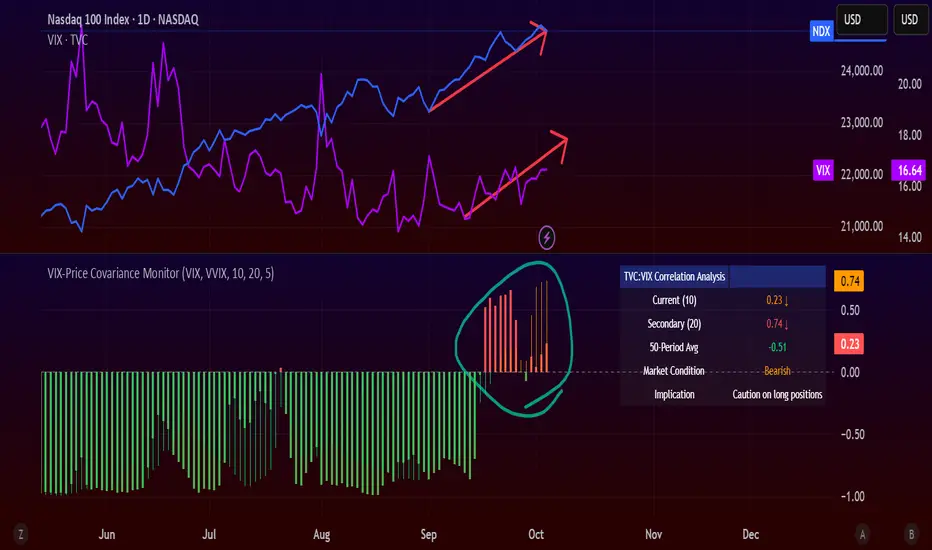
ALERT: VIX-NDX COVARIANCE HITS DANGER ZONEA few days ago, my custom VIX–Price Covariance Monitor started flashing red... and it hasn’t cooled off since.
Here’s what that means 👇
- The TVC:VIX (volatility index) and NASDAQ:NDX (Nasdaq 100) are now moving in the same direction.
That’s not normal.
Usually, when stocks rise, volatility falls.
But when both start climbing together — it means something under the surface is fracturing.
Half the times this correlation flips positive, the market corrects or worse, it crashes.
I’m not panic‑selling, but I’m definitely not buying either for now.
No new longs unless it’s a screaming opportunity.
In the meantime? Stacking cash and sitting tight.
This is time to play close attention to the market,
US100: Bullish Momentum Pauses at Resistance4H Technical Outlook
All-Time High Barrier
The all-time high overhead is a clear psychological resistance. Chasing longs directly into this level is not attractive from a risk/reward perspective. Only a confirmed breakout and acceptance above would open “uncharted territory” and establish fresh bullish momentum.
Zone 1: Overhead Supply / Yesterday’s High
This area marks an immediate supply pocket, coinciding with yesterday’s high. Price action has shown hesitation here, and buyers are struggling to establish acceptance above. As long as price remains capped under this zone, it serves as a short-term sell area. A clean breakout and consolidation above would invalidate the supply and potentially trigger continuation toward the all-time high at 24,754.
Zone 2: Key Intraday Demand / Yesterday’s Low
This zone represents the first meaningful demand layer below spot price. Yesterday’s low aligns with intraday consolidation, making it a pivot area where responsive buyers could step back in. If bulls defend this zone, it may form the base for another push higher. A decisive break below, however, would shift near-term control back to sellers and expose deeper liquidity pockets.
Zone 3: High-Impact Demand Area (4H structure)
This is a more significant demand zone where aggressive buyers previously absorbed heavy selling and initiated the latest upward leg. If tested again, it could attract strong dip-buying interest. Failure to hold this zone would represent a structural breakdown on the 4H chart and likely accelerate downside momentum toward lower liquidity pools.
The sentiment around the Nasdaq100 is cautious and slightly bearish at the moment. Macro risks dominate the narrative, with the looming U.S. government shutdown creating uncertainty and threatening to delay key economic data releases. At the same time, consumer confidence has weakened, signaling softer demand ahead, while interest rate policy remains uncertain.
On the positive side, the tech and AI boom continues to provide structural support, but valuations are stretched, and many traders are positioning defensively. Technically, the index is consolidating below resistance, with support levels in focus.
Overall, the market remains supported by long-term growth themes, but near-term sentiment is clouded by macro headwinds and the risk of a deeper pullback.

NAS100 -Head and Shoulders Formed. Price Sitting at the NecklinePrice had been climbing steadily and consistently till now. See my previous analysis:
Or click on the attached idea on my chart.
But momentum is starting to be fading.
And if we look closely, we could recognize a head and shoulders pattern. We have the first peak, the left shoulder. Then a taller peak, the head. And finally, a lower high, the right shoulder.
And right now, price is sitting right at that neckline. So the market is at decision point:
A strong break below would confirm the Head and Shoulders and trigger the reversal.
- If price will break below this neckline with momentum, the pattern is confirmed. And that would be our short signal anticipating a move down, towards 24.400.
- But if buyers step in here, the pattern could fail.
The target is measured from the head to the neckline, and projected below the breakout.
It’s a key moment and the next move will decide the outcome.

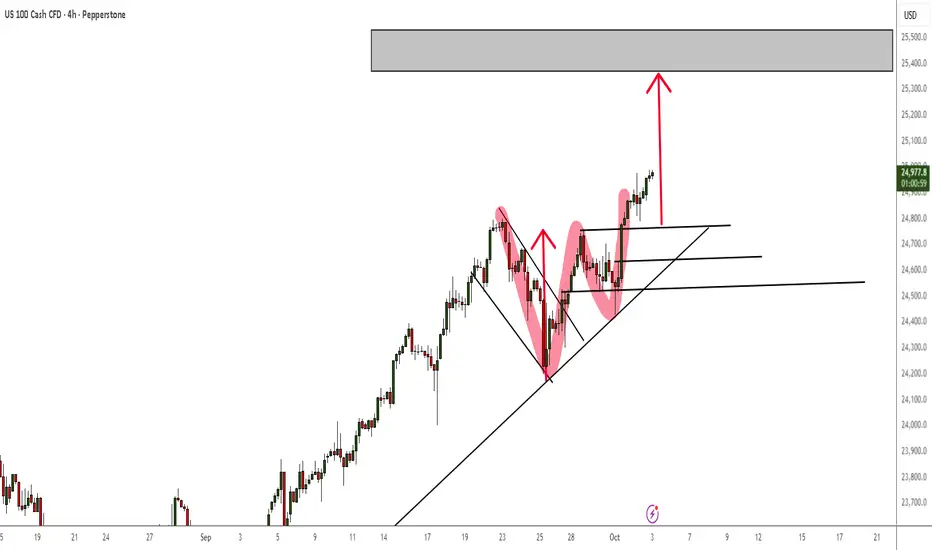
NASDAQ W Formation Bullish PatternNow that we have a confirmed double bottom rejection on the H4 TF, this means we can expect NQ to continue to rally to new ATHs for a bit longer than we all anticipated. Even if it first pulls back slightly to retest one of those lows.
You are better off as a buyer in this market.
US NAS100Preferably suitable for scalping and accurate as long as you watch carefully the price action with the drawn areas.
With your likes and comments, you give me enough energy to provide the best analysis on an ongoing basis.
And if you needed any analysis that was not on the page, you can ask me with a comment or a personal message.
Enjoy Trading ;)

US 100 Index – Upside Momentum to be Put to the TestThe US 100 registered its first down week of September when it closed at 24507 last Friday, a weekly loss of 0.4%. Hardly a collapse but a warning that no market moves in a straight line, especially one so sensitive to many of the key drivers that traders are focused on, namely AI and Federal Reserve (Fed) interest rate moves.
It seems that last week’s dip may have been driven by some profit taking into the end of what has been a strong third quarter performance for this technology heavy index (8%, July 1st to September 26th). That drop has already been unwound by yesterday’s 0.4% rally which has continued this morning to current levels around 24640 (0730 BST), as traders’ position for some key economic data on the US labour market, which could clear up whether the Fed has room to cut interest rates again when they meet next on October 29th.
While there is a US labour market data release scheduled for every day across the remainder of this week, the focus could be Friday’s Payrolls update, where traders are anticipating a modest gain of around 39k and the unemployment rate to remain at its current level of 4.3%. Any deviation from these expectations could impact the market’s pricing of around a 90% chance of an October Fed rate cut, and a 60% chance of another December rate cut, with knock on implications for the direction of the US 100 at the start of Q4.
One obstacle impacting Friday’s Payrolls could be the possibility for a US Federal government shutdown from October 1st, which could delay the release of the labour market data, creating an extra level of uncertainty into the end of the week. Congressional leaders met with President Trump at the White House yesterday and talks to avoid a shutdown are on-going, although the latest updates provided by Vice President Vance suggests that a funding agreement is still some way off.
It may be worthwhile monitoring progress on this throughout the day ahead, just in case an agreement isn’t reached, and it leads to some extra US 100 volatility.
Technical Update: Price Decline Finding Support
Price corrections are a natural part of a broader uptrend and often reflect a healthy reaction to recent upside extremes. Following last week’s sell-off in the US 100 index, traders may now be assessing whether the latest weakness is simply a limited pullback ahead of renewed attempts to extend what still appears to be a constructive trend, or the beginning of a more extended price decline.
While it’s impossible to confirm whether a renewed phase of strength is underway, last week’s initial weakness found support at lower levels. As the chart above shows, fresh upside attempts may now be emerging, suggesting the possibility of a resumption of the uptrend pattern.
While positive sentiment may still be evident, this week’s upcoming data releases could prove pivotal, with the potential to shift momentum and drive notable price moves across key assets and traders will be watching closely for confirmation, or disruption, of the current US 100 index trend.
As a result, it may be important to identify and then monitor key support and resistance levels in case an increased spell of volatility emerges.
Potential Support Levels:
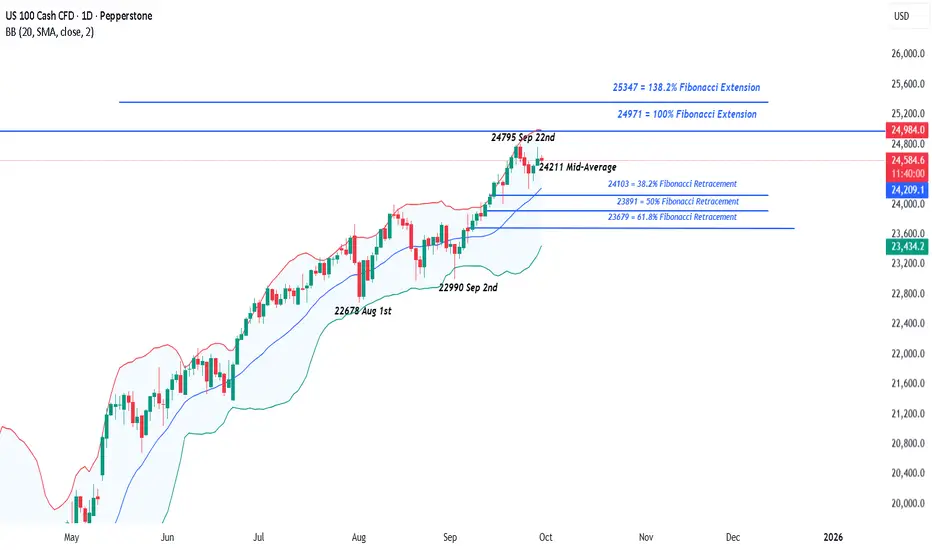
As the chart below shows, the latest price strength seen on Monday and into this morning, appears to be emerging from an initial support zone between 24211 and 24103. This range is marked by both the rising Bollinger mid-average and the 38.2% Fibonacci retracement of September’s advance.
A closing break below these levels wouldn’t confirm a downside shift but could pave the way for a test of 23891, the 50% retracement, and possibly even extend towards 23679, which is the 61.8% level.
Potential Resistance Levels:
After marking a new all-time high at 24795 on September 22nd, traders may now be monitoring this level as the initial resistance focus this week.
If the positive trend does remain, fresh attempts at price strength are possible. It could be worthwhile monitoring how the 24795 all-time high is defended on a closing basis, with successful breaks higher potentially leading to a further phase of price strength.
While a closing break above 24795 doesn’t guarantee further upside, it could trigger fresh attempts to push first towards 24971, the 100% Fibonacci extension, and potentially up to 25347, the 138.2% extension level.
The material provided here has not been prepared accordance with legal requirements designed to promote the independence of investment research and as such is considered to be a marketing communication. Whilst it is not subject to any prohibition on dealing ahead of the dissemination of investment research, we will not seek to take any advantage before providing it to our clients.
Pepperstone doesn’t represent that the material provided here is accurate, current or complete, and therefore shouldn’t be relied upon as such. The information, whether from a third party or not, isn’t to be considered as a recommendation; or an offer to buy or sell; or the solicitation of an offer to buy or sell any security, financial product or instrument; or to participate in any particular trading strategy. It does not take into account readers’ financial situation or investment objectives. We advise any readers of this content to seek their own advice. Without the approval of Pepperstone, reproduction or redistribution of this information isn’t permitted.
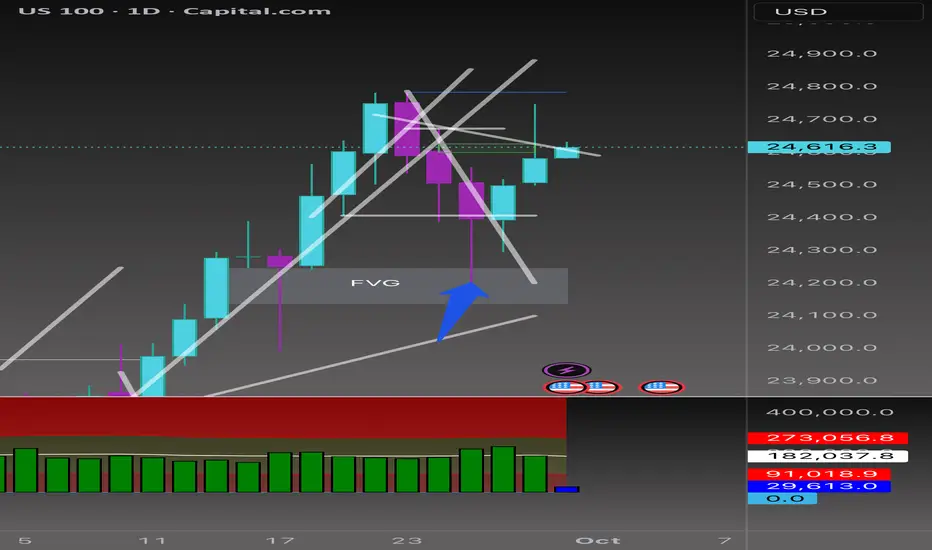
Beyond the Chart - NAS100 Through Technicals & FundamentalsCAPITALCOM:US100 The trendline I drew on the lower timeframe yesterday worked perfectly, and price is still respecting it. We did see a break, but right after that, a Bearish FVG and a Breaker Block formed. This trendline will remain my pilot line for analysis.
NASDAQ Daily Analysis 📊
On the daily chart, the FVG formed on Sep 15th has been revisited, but price couldn't hold in this zone and was quickly rejected. The trendline I've drawn is still active and guiding the move.
⚡️Volatility note: Daily volatility is starting to compress (blue print on my model), meaning the next breakout move could expand strongly. If price breaks above the trendline with momentum, buyers may look beyond 24,650 toward 24,720–24,800 before reevaluating. If rejection holds, compressed volatility could fuel an accelerated drop into the 24,520 → 24,440 FVG zone, and possibly 24,300.
🦖 If a bullish candle closes back above the trendline, I’ll be looking at 24,650 as a buy trigger. A confirmed break here could open the door toward 24,720 → 24,780 liquidity levels.
🐼 If sellers keep control below the trend, downside targets remain at the FVGs around 24,520 → 24,440, and potentially 24,300 (Discount PD Array).
⚡️ Bottom line:
Today’s US data (Chicago PMI, JOLTS, Consumer Confidence) + multiple FOMC speeches will likely decide direction.
📉 Hot data or hawkish tone → sellers push deeper.
📈 Softer numbers or dovish Fed comments → bulls may retest higher levels.
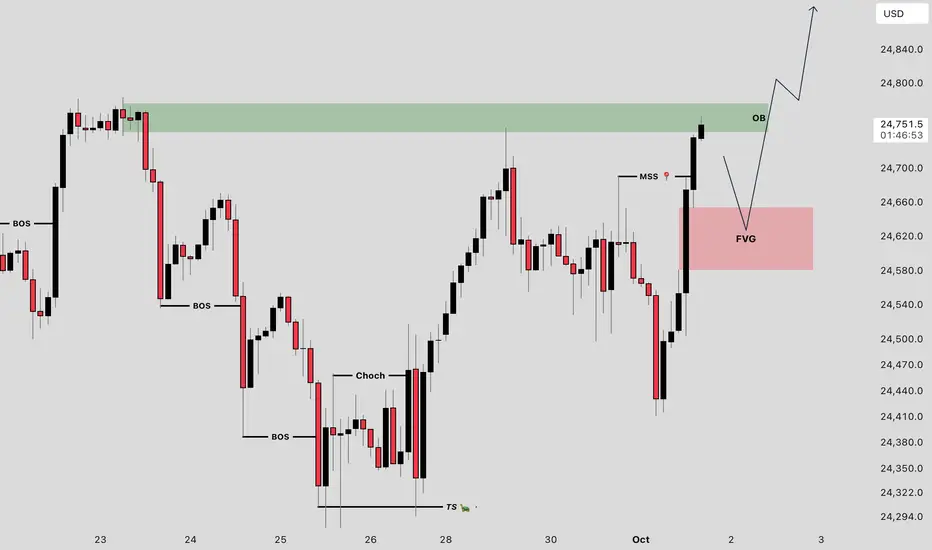
NASDAQ H2 OUTLOOK ! Sell NASDAQ At Ob
Buy NASDAQ At Fvg
These Two Setups We Have Now
Follow Us For More Trades
US NAS 100Preferably suitable for scalping and accurate as long as you watch carefully the price action with the drawn areas.
With your likes and comments, you give me enough energy to provide the best analysis on an ongoing basis.
And if you needed any analysis that was not on the page, you can ask me with a comment or a personal message.
Enjoy Trading ;)

Shutdown risk, Investors eye Jobs DataShutdown risk, Investors eye Jobs Data
U.S. stock index futures slipped on 30 September as investors awaited key labor reports and braced for possible delays in economic data due to a looming government shutdown. The risk-off shift follows Monday’s equity gains, with analysts warning this standoff could be more disruptive given the fragile economic backdrop.
Markets are focused on the Labor Department’s JOLTS report and consumer confidence data, while several Fed officials are set to speak. Earnings season and potential price hikes from companies will also draw attention as Q4 begins, historically a supportive period for stocks.
Budget negotiations remain deadlocked in Washington, raising the likelihood of a shutdown that could stall government services and key data releases. Wall Street futures eased from record highs, Treasury yields edged lower, and the dollar softened, while the yen and Aussie dollar gained.

US100 Technical Update – Supply Pressure at Highs, Demand Holds 1H Technical Zone Analysis
Zone 1: Major Supply / Rejection Zone
This area marks the upper extreme of the recent rally and represents a clear supply pocket where sellers previously stepped in aggressively. Until price reclaims and holds above 25,000, this zone should be treated as short-term resistance. A clean breakout and acceptance above could open the door to further upside continuation.
Zone 2: Intraday Resistance / Retest Level
This mid-level zone has acted as both support and resistance over recent sessions, making it an important pivot area. Price is currently testing into it from below; failure to clear this level may attract renewed selling pressure and confirm the zone as intraday resistance.
Zone 3: Key Demand / Short-Term Buy Zone
This is the most significant near-term support. Price reacted strongly from this level during the last sell-off, showing clear buyer absorption. As long as this demand zone holds, short-term market structure remains bullish. A decisive break below would likely trigger a deeper correction.
Sentiment and the most recent macro developments:
The US100 is holding near record highs, but the tone across markets has turned cautiously optimistic rather than euphoric. Investors continue to favor large-cap tech and AI-driven names, which remain the primary source of market strength. Falling bond yields and growing confidence that the Federal Reserve will be forced to cut rates sooner rather than later are also helping sustain upside momentum.
At the same time, recent economic data has shown clear signs of cooling. The ISM Services PMI dropped sharply to 50.0 in September, signaling that the U.S. service sector, which drives most of the economy, has essentially stalled. The employment component within the report fell further into contraction territory, confirming softness already seen in the ADP jobs report earlier in the week. Combined with an ongoing government shutdown that delays official data releases, investors are trading in an information vacuum, relying more on expectations and positioning than hard fundamentals.
Overall, sentiment on US100 remains bullish but fragile. The index is being lifted by liquidity, AI optimism, and rate-cut hopes rather than strong macro performance. This creates a market that can continue drifting higher in the short term, but is increasingly vulnerable to reversals if inflation surprises on the upside or if economic weakness deepens beyond what investors currently expect.
