US100 Free Signal! Sell!
Hello,Traders!
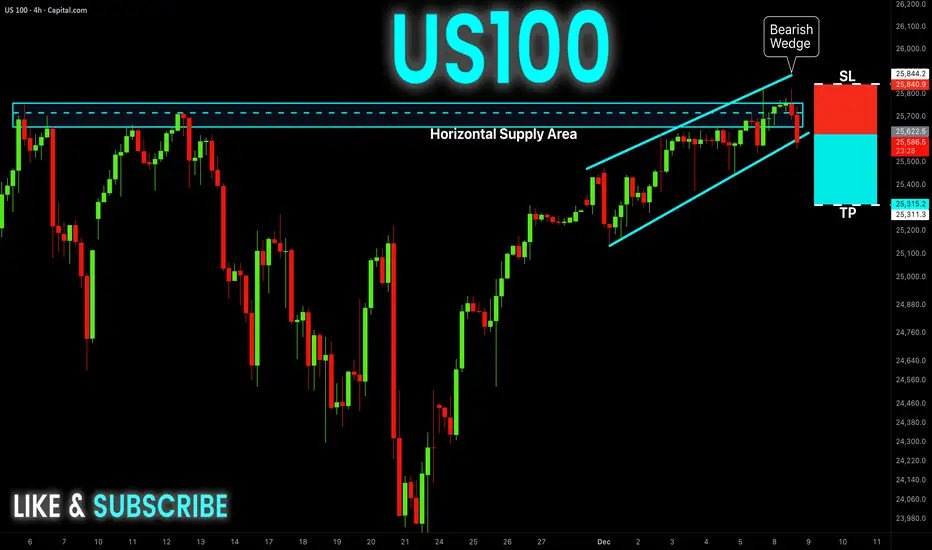
US100 has rejected a major supply zone while breaking down from a bearish wedge, sweeping buy-side liquidity before shifting order-flow bearish. This SMC structure signals distribution at premium and a move toward discount levels below.
--------------------
Stop Loss: 25840
Take Profit: 25315
Entry: 25622
Time Frame: 4H
--------------------
Sell!
Comment and subscribe to help us grow!
Check out other forecasts below too!
Disclosure: I am part of Trade Nation's Influencer program and receive a monthly fee for using their TradingView charts in my analysis.
Trade ideas

Bullish bias on NAS100This is what I think might happen over the course of next week. I identified a hidden OB at the 25200 area that might get mitigated before it produces the next leg up. Price might break through the OB and tap into the low volume node. The overall trend remains bullish and there is no reason to assume a reversal is incoming.
The formation of a HL would be very welcome before a potential christmas rally starts.
For now, alerts are set

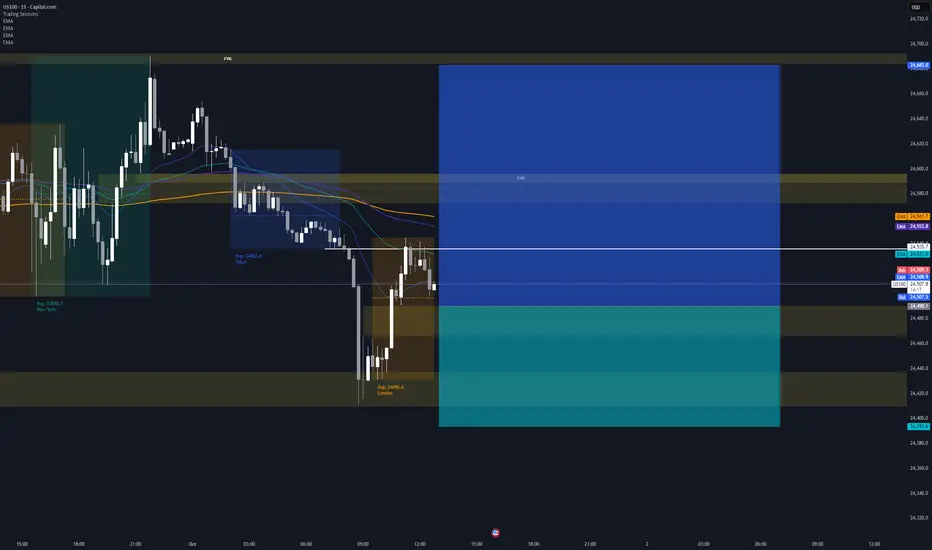
NAS Short/Long 05/12/2025Short DC1 on the M15 after tapping M15 break level, then rejecting back to H1 hold.
Closed the position once realised price was rejecting off M15 hold.
Long once above the daily open upon printing of AS4 on the M1

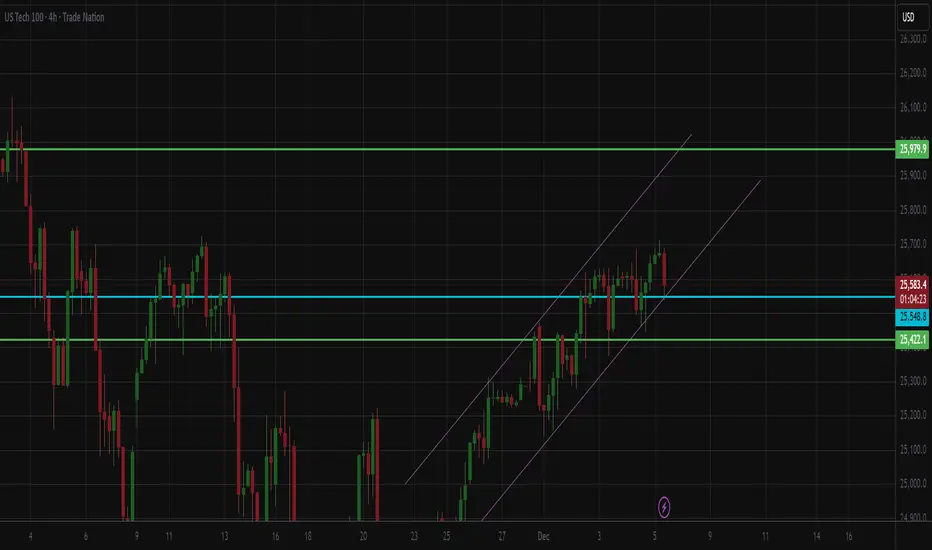
Buy Tech100 Futures for a swing long. Nasdaq is on the way UP and here is a pullback where you can enter for a 1:3 RR. I believe Tech100 is gunning for 26000, so I will be sitting on this position for the whole next week (hopefully). Probably adding to it if it moves in my favor with a clear bull signal.
NAS100 Trade Set Up Dec 5 2025Price has shifted to bearish structure and is targeting SSL and PDL but first i will wait for more internal structure on the 15m-5m to continue lower

Nasdaq shorts pendingOkay okay 👌🏽
$25k FLAT is what she’s hunting.
In a crucial handle as we speak and I am personally looking for some work into $26,970 early next week before bleeding this thing off into target..
Nothing more to say, keep it simple. Same goes for us30, she’s in the same boat for shorts 🩳 …
Tab up 650-690 and hopefully we can see her make a move upside to set it up?!
If not. Flip the script and play this in reverse.. ⏮️
Profile be up on next week. Watch people….
LFG 👽 🫶🏽

Nq longIf price goes back down, i'll likely take this trade. seems strong volume here, plus Japan likely to buy NQ too in their morning.
if price goes back all the way all time high, cancel this trade.

Nasdaq breakout around the corner?The Nasdaq is pushing higher as weaker US employment data boosts risk sentiment and fuels expectations that the Fed will move ahead with rate cuts. With softer labor figures reducing pressure on monetary policy, investors are rotating back into growth and tech names, supporting the broader index. The year-end rally narrative is strengthening as well, with many market participants positioning early for seasonal upside.
Lower Treasury yields are adding momentum, making equities relatively more attractive and encouraging capital to flow back into high-beta sectors. Corporate earnings remain solid in key industries, which helps stabilise sentiment after recent volatility. On top of that, easing geopolitical tensions and improved liquidity conditions are giving markets another tailwind. Market breadth has been expanding too, indicating that the upside is supported by more than just a handful of mega-caps.
From a technical perspective, the critical level to watch is the 25,700 zone. A clean break above this resistance could trigger further upside and potentially send the index toward its old all-time high. Until that breakout occurs, short-term pullbacks are still possible, but the broader setup continues to point toward a constructive outlook as long as the index holds above key support areas.
NAS100 – Riding the Channel: Will Price Respect the MidlinePrice continues to move cleanly inside the long-term ascending channel, with the midline acting as dynamic support throughout the past week. Each retest of the dashed median line has produced bullish continuation, but momentum is starting to flatten at the upper boundary.
Key Observations:
Price is currently hovering near the upper half of the channel, showing signs of exhaustion.
The dashed median line has been respected repeatedly — a key structure level to watch.
Bullish structure remains intact as long as price stays above the recent internal higher-low zones (highlighted in green).
MACD shows slowing momentum despite higher prices, signalling a possible pullback into channel support before continuation.
Levels to Watch:
Bullish continuation: If price holds above the midline, we could see another leg into the upper boundary of the channel.
Pullback zone: Watch for a corrective move into the lower channel support if buyers fail to sustain momentum.
Invalidation: A clean break below the channel would shift bias to short-term bearish retracement.
This structure is still very clean — waiting for either a respectful retest or a decisive breakout.
📌 Bias
Bullish overall structure, but expecting a short-term pullback before continuation.

NAS100 H4 | Bullish Bounce OffMomentum: Bullish
Price has bounced off the buy entry, which is acting as pullback support, and is currently trading above the Ichimoku cloud.
Buy Entry: 25,185.75
Pullback support
Stop Loss: 24,903.03
Pullback support
38.2% Fibonacci retracement
Take Profit: 25,829.99
Pullback resistance
145% Fibonacci extension
High Risk Investment Warning
Stratos Markets Limited (tradu.com ), Stratos Europe Ltd (tradu.com ):
CFDs are complex instruments and come with a high risk of losing money rapidly due to leverage. 70% of retail investor accounts lose money when trading CFDs with this provider. You should consider whether you understand how CFDs work and whether you can afford to take the high risk of losing your money.
Stratos Global LLC (tradu.com ): Losses can exceed deposits.
Please be advised that the information presented on TradingView is provided to Tradu (‘Company’, ‘we’) by a third-party provider (‘TFA Global Pte Ltd’). Please be reminded that you are solely responsible for the trading decisions on your account. Any information and/or content is intended entirely for research, educational and informational purposes only and does not constitute investment or consultation advice or investment strategy. The information is not tailored to the investment needs of any specific person and therefore does not involve a consideration of any of the investment objectives, financial situation or needs of any viewer that may receive it. Past performance is not a reliable indicator of future results. Actual results may differ materially from those anticipated in forward-looking or past performance statements. We assume no liability as to the accuracy or completeness of any of the information and/or content provided herein and the Company cannot be held responsible for any omission, mistake nor for any loss or damage including without limitation to any loss of profit which may arise from reliance on any information supplied by TFA Global Pte Ltd.

NAS100 - Buy SetupTimeframes Used: Monthly → Weekly → Daily → 4H
Current Market Condition:
XAUUSD is a valid trade according to my system rules:
Monthly: Price is above the Cloud → Bullish
Weekly: Price is above the Cloud → Bullish
Daily: Price is above the Cloud → Bullish
----------------------------------------------------------------------------------------------------------------
Currently in trade on 4hr timeframe:
Entry: 25,072.29
Stoploss: 24,736.54

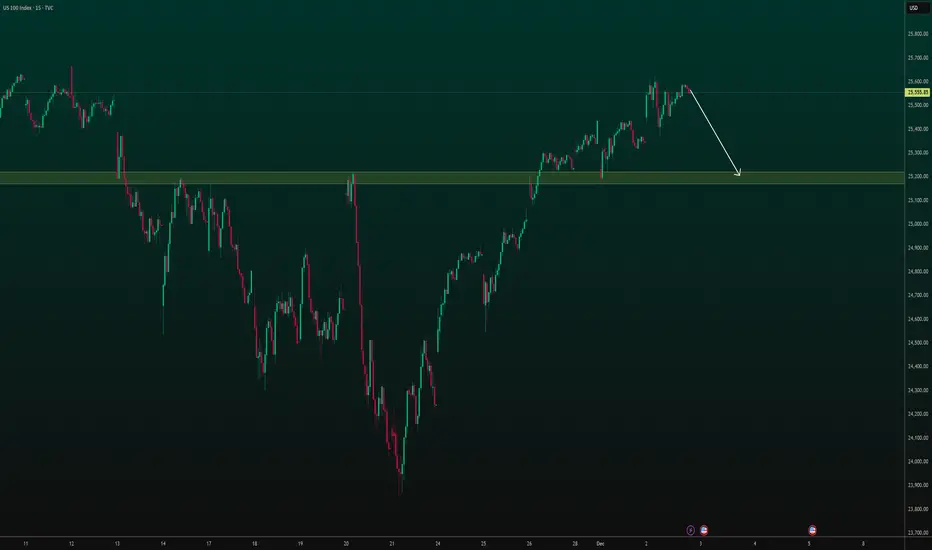
US100 - Facing Resistance, Potential Pullback to SupportUS100 has hit a strong resistance level and is now showing signs of a potential pullback. The white arrow indicates a possible retracement towards the highlighted support zone, which was previously a resistance.
NAS100 Trade Set Up Dec 2 2025Price has swept PDH so i will wait for internal 5m-15m structure to see if price can push higher to 4h supply or close under PDH to make internal bearish structure to target SSL/PDL

Going long (buy) .,Nas100 broke out of the trend line…and retesting the demand zone for a conformation to go long.

Nasdaq 100 – Technical & Fundamental OutlookTechnical:
Nasdaq is holding a recovery structure after bouncing strongly from 24,300. Price is stabilizing above 25,200, but the index still struggles to break above 25,400–25,500, a key short-term supply zone.
Fundamental:
Tech sentiment improves with expectations of rate cuts and solid earnings outlook, but macro uncertainty keeps volatility high, especially around U.S. labor and inflation data.
Key:
Holding above 25,200 keeps bullish momentum alive.
Rejection at 25,500 could trigger a pullback.

NAS100 — 25,458 Liquidity Sweep, Target Revised to 24,989The NAS100 has completed a clear liquidity sweep at 25,458, taking out the previous swing high before rejecting the zone. This move confirms that the breakout above 25,458 was only a liquidity grab, not a structural shift. As long as price remains below this swept level, the bias stays bearish.
The rejection from 25,458 suggests that the market has collected buy-side liquidity and is now positioned to move toward the opposite side of the range. The first reaction zone is 25,054, but this level is likely to act only as an intermediate pause. The true downside magnet is now 24,989, where a deeper liquidity pool resides (lows + imbalance).
Key Level
25,458 — Sweep Liquidity Zone (bearish invalidation if reclaimed)
Targets
25,054 — Interim level
24,989 — Main target

Nasdaq trade ideaSeeking highs, after rebalancing in this BISI. Movement expected after the 10am news driver.

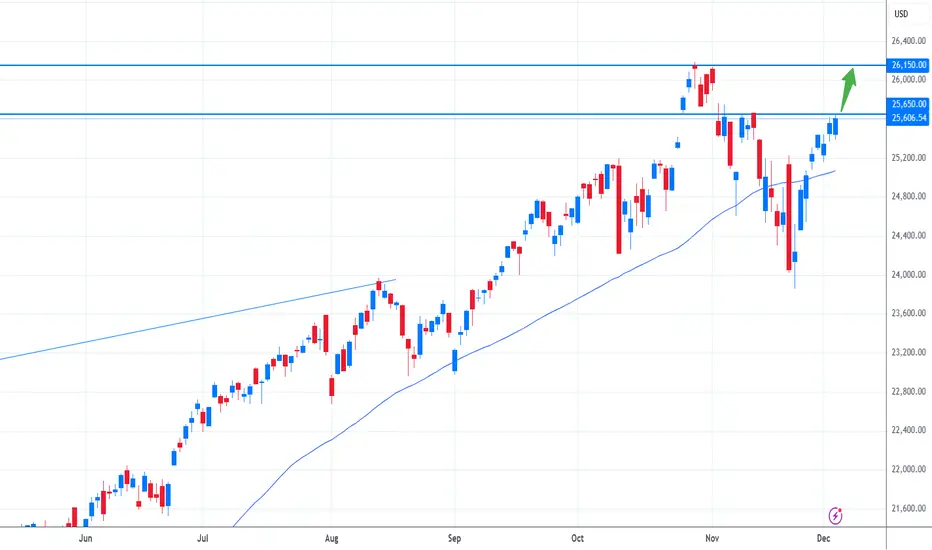
NAS100 – Price Rebounds but Faces a Strong Supply Zone AheadNAS100 has recovered from recent lows with steady upward momentum, but price is approaching a key supply zone around 26,050 – 26,150, an area where strong selling pressure previously reversed the market.
As long as price remains below this zone, bullish continuation may be limited. A clean breakout and consolidation above 26,150 would open the door for further upside, while rejection from this level could trigger another corrective move back toward 25,200 – 25,000.
For now, NAS100 is in a recovery phase but still trading below major resistance.


US100: Short Signal Explained
US100
- Classic bearish pattern
- Our team expects retracement
SUGGESTED TRADE:
Swing Trade
Sell US100
Entry - 25404
Stop - 25436
Take - 25348
Our Risk - 1%
Start protection of your profits from lower levels
Disclosure: I am part of Trade Nation's Influencer program and receive a monthly fee for using their TradingView charts in my analysis.
❤️ Please, support our work with like & comment! ❤️

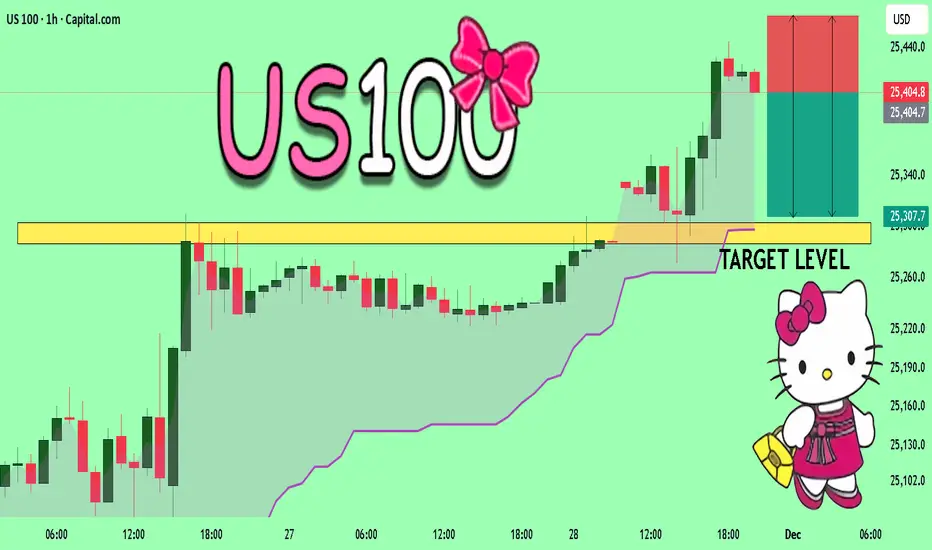
US100 Technical Analysis! SELL!
My dear followers,
I analysed this chart on US100 and concluded the following:
The market is trading on 25404 pivot level.
Bias - Bearish
Technical Indicators: Both Super Trend & Pivot HL indicate a highly probable Bearish continuation.
Target - 25303
Safe Stop Loss - 25465
About Used Indicators:
A super-trend indicator is plotted on either above or below the closing price to signal a buy or sell. The indicator changes color, based on whether or not you should be buying. If the super-trend indicator moves below the closing price, the indicator turns green, and it signals an entry point or points to buy.
Disclosure: I am part of Trade Nation's Influencer program and receive a monthly fee for using their TradingView charts in my analysis.
———————————
WISH YOU ALL LUCK