NAS100 trade ideas

my opinion about nasdaq or us100My opinion there’s big bearish for next week so if the price go to that zone you can sell it

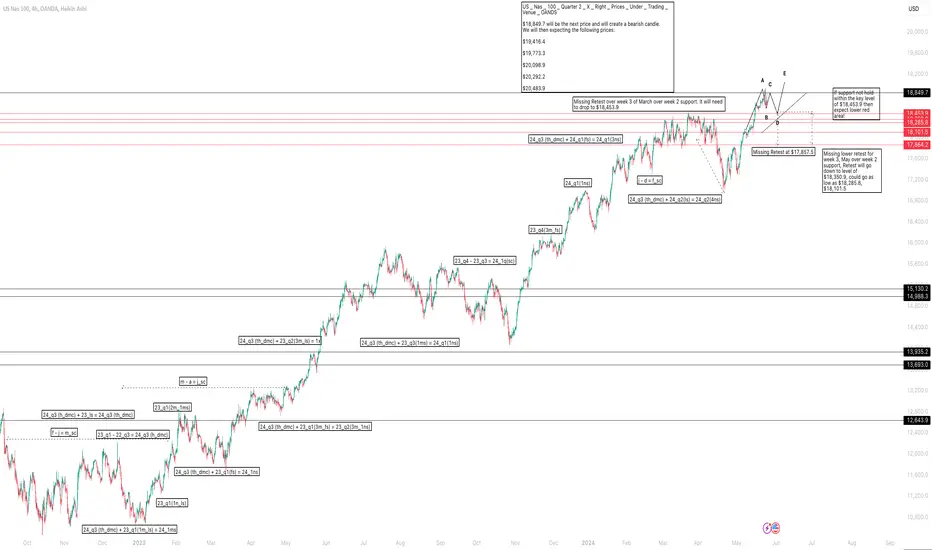
US _ Nas _ 100 _ Quarter 2 _ X _ Right _ Prices _ Under _ TradinUS _ Nas _ 100 _ Quarter 2 _ X _ Right _ Prices _ Under _ Trading _ Venue _ OANDS
$18,849.7 will be the next price and will create a bearish candle.
We will then expecting the following prices:
$19,416.4
$19,773.3
$20,098.9
$20,292.2
$20,483.9
NasdaqPrice gave very good movement, nearly 300 points yesterday and now it is at crucial zone. 18600 is important in deciding the trend direction.
Buy above 18630 with the stop loss of 19590 for the targets 18660, 18700, 18740 and 18800.
Sell below 18550 with the stop loss of 18590 for the targets 18510, 18480, 18440 and 18400.
!8500 can act as support.
Hit the like button to Rock !! Show some energy !!
Note : This is my pre market analysis and my trading journal. Not a suggestion to buy or sell.
You are responsible for whatever you do.

Nasdaq buyNasdaq signal already running 100 pips profit from our entry point ... buy trend line breaked but this is correction momentum so break even trade safe

NAS Retracement possibleWe're pretty close to the midnight line, but there could be a retracement back toward the NYC Midnight opening price.
Looking for one more rejection with the top price zone.


US100 dropas we are expecting fundimentals in about an hour, im seeing a drop in nas100 in anticipation to break the previous low.

The price fell despite strong NVDA earnings. What's the cause?Nasdaq Falls 2.0% Amid Investor Uncertainty and Fed Caution
The Nasdaq fell by 2.0% on a subdued Thursday as investors adjusted their portfolios amid shifting market sentiment. The trading session was marked by an uneasy atmosphere following the release of the Federal Reserve's latest meeting minutes, which indicated that central bankers are in no hurry to reduce interest rates .
This cautious stance from the Fed has been a key factor in supporting the recent upward trend in stocks.
Technical Analysis:
The Nasdaq is poised to test the 18,715 level before likely retreating to 18,600. A bearish trend will be confirmed if the price stabilizes below 18,600, potentially driving it down further to 18,435. Conversely, a bullish scenario will emerge if the price breaks above the 18,660 threshold.
pivot line: 18710
Resistance Price: 18790, 18920, 19100
Support price: 18550, 18440, 18250
Its range for Today will be between Support 18250 and Resistance 18790

Nasdaq 100 (CME) may fall to 18540.00 - 18630.00Pivot
18800.00
Our preference
Short positions below 18800.00 with targets at 18630.00 & 18540.00 in extension.
Alternative scenario
Above 18800.00 look for further upside with 18920.00 & 19020.00 as targets.
Comment
The RSI is mixed.
Supports and resistances
19020.00
18920.00
18800.00
18737.50 Last
18630.00
18540.00
18440.00
Number of asterisks represents the strength of support and resistance levels.


NAS100USD Is Going Up! Buy!
Here is our detailed technical review for NAS100USD.
Time Frame: 1D
Current Trend: Bullish
Sentiment: Oversold (based on 7-period RSI)
Forecast: Bullish
The market is on a crucial zone of demand 18,905.8.
The oversold market condition in a combination with key structure gives us a relatively strong bullish signal with goal 20,101.7 level.
P.S
We determine oversold/overbought condition with RSI indicator.
When it drops below 30 - the market is considered to be oversold.
When it bounces above 70 - the market is considered to be overbought.
Like and subscribe and comment my ideas if you enjoy them!

Market Gets Spooked, FOMC and INterest RatesEASYMARKETS:NDQUSD
Disclaimer:
easyMarkets Account on TradingView allows you to combine easyMarkets industry leading conditions, regulated trading and tight fixed spreads with TradingView's powerful social network for traders, advanced charting and analytics. Access no slippage on limit orders, tight fixed spreads, negative balance protection, no hidden fees or commission, and seamless integration.
Any opinions, news, research, analyses, prices, other information, or links to third-party sites contained on this website are provided on an "as-is" basis, are intended only to be informative, is not an advice nor a recommendation, nor research, or a record of our trading prices, or an offer of, or solicitation for a transaction in any financial instrument and thus should not be treated as such. The information provided does not involve any specific investment objectives, financial situation and needs of any specific person who may receive it. Please be aware, that past performance is not a reliable indicator of future performance and/or results. Past Performance or Forward-looking scenarios based upon the reasonable beliefs of the third-party provider are not a guarantee of future performance. Actual results may differ materially from those anticipated in forward-looking or past performance statements. easyMarkets makes no representation or warranty and assumes no liability as to the accuracy or completeness of the information provided, nor any loss arising from any investment based on a recommendation, forecast or any information supplied by any third-party.

NASDAQ. Weekly trading levels 20 - 24.05.2024Indices are at highs. We haven’t been to the top yet, there’s no data there. If we update the historical maximum, we can find out more in the Daily Posts.
During the week you can trade from these price levels. Finding the entry point into a transaction and its support is up to you, depending on your trading style and the development of the situation. Zones show preferred price ranges WHERE to look for an entry point into a trade.
If you expect any medium-term price movements, then most likely they will start from one of the zones.
Levels are valid for a week, the date is in the title. Next week I will adjust the levels based on new data and publish a new post.
! Please note that brokers have a difference in quotes, take this into account when trading.
The history of level development can be seen in my previous posts. They cannot be edited or deleted. Everything is fair. :)
----------------------------------------------
I don’t play guess the direction (that’s why there are no directional arrows), but zones (levels) are used for trading. We wait for the zone to approach, watch the reaction, and enter the trade.
Levels are drawn based on volumes and data from the CME. They are used as areas of interest for trading. Traded as classic support/resistance levels. We see the reaction to the rebound, we trade the rebound. We see a breakout and continue to trade on a rollback to the level. The worst option is if we revolve around the zone in a flat.
Do not reverse the market at every level; if there is a trend movement, consider it as an opportunity to continue the movement. Until the price has drawn a reversal pattern.
Don't forget to like Rocket and Subscribe!!! Feedback is very important to me!

eaasy trade on NAS100this one seems better than US30 but i like both and put both trades on, tap the area and go up , comfy stop loss and bigger tp . based off the other technicals ( i explained on my YT ) for stocks this trade lines up with everything.

Bullish bounce off pullback support?NAS100 is falling towards a support level which is a pullback support and could potentially bounce from this level to our take profit.
Entry: 18,427.71
Why we like it:
There is a pullback support level.
Stop loss: 18,149.88
Why we like it:
There is an overlap support level which lines up with the 50% Fibonacci retracement.
Take profit: 18,899.05
Why we like it:
There is a pullback resistance.
Please be advised that the information presented on TradingView is provided to Vantage (‘Vantage Global Limited’, ‘we’) by a third-party provider (‘Everest Fortune Group’). Please be reminded that you are solely responsible for the trading decisions on your account. There is a very high degree of risk involved in trading. Any information and/or content is intended entirely for research, educational and informational purposes only and does not constitute investment or consultation advice or investment strategy. The information is not tailored to the investment needs of any specific person and therefore does not involve a consideration of any of the investment objectives, financial situation or needs of any viewer that may receive it. Kindly also note that past performance is not a reliable indicator of future results. Actual results may differ materially from those anticipated in forward-looking or past performance statements. We assume no liability as to the accuracy or completeness of any of the information and/or content provided herein and the Company cannot be held responsible for any omission, mistake nor for any loss or damage including without limitation to any loss of profit which may arise from reliance on any information supplied by Everest Fortune Group.

CHART BREAKDOWN NASDAQ: Key Levels, Targets and Thoughts!🎯Brief Description🖊️:
The chart provides insights into critical market levels, emphasizing an essential demand zone (low-risk buy zone) spanning from 18330 to 18315. Additionally, medium-risk sell zone between 18870-18920, respectively, are highlighted.
Things I Have Seen👀:
Important Demand Zone🟢: Identified between 18330 and 18315, serving as a low-risk buy.
Medium-Risk Sell Zone🟠: Noted between 18870 and 18920, suggesting another area with moderate risk for potential selling positions.
Bearish Targets📉:
18850: Possible retracement area.
18700: Possible retracement area.
18500: Area with laying low liquidity.
Ultimate Target: 18330- Essential Demand Zone
Bullish Targets📈:
18400: Possible retracement area.
18500: Possible retracement area.
18580: Possible retracement area.
18670: Area with a lot of liquidity.
What's Important Now❗
Currently, the crucial approach is to wait and observe the price action at this level. We need to assess how the market reacts before considering any decisive moves. Stay observant and responsive to real-time developments in the market.

NASDAQ (AND OTHERS INDEX) SHOULD HAVE CORRECTIONWhether it's a deep correction or it's gonna be a reversal that people are expecting for quite long, i believe it's time to SELL.
#THEBIGSHORpartII

Looking for a continuation of todays bearsIf price gives me confirmation on the lower time frame I will look to sell. If this is the weekly pivot then price should trend down for at least today ad some of tomorrow.

US100Nasdaq index analysis
Time frame 4 hours
I expect to see a drop to the 18,300 range, then another bullish lag.

US100US100 just broke the last HL.
Just enter the bearish trend.
Bearish divergence also form .
we sell at CMP.

NAS100 I Potential scalp & intraday long from support Welcome back! Let me know your thoughts in the comments!
** NAS100 Analysis - Listen to video!
We recommend that you keep this pair on your watchlist and enter when the entry criteria of your strategy is met.
Please support this idea with a LIKE and COMMENT if you find it useful and Click "Follow" on our profile if you'd like these trade ideas delivered straight to your email in the future.
Thanks for your continued support!
