3 NOV 2025: US100 MARKET RECAPNOT YOUR STANDARD DAY - LESSONS WERE LEARNT. ALL TRADES WERE WON
DISCLAIMER:
The owner of this page is an authorised Representative under supervision of TD MARKETS (PTY) LTD, an authorised Financial Services Provider (FSP No. 49128) licensed by the Financial Sector Conduct Authority (FSCA) under the Financial Advisory and Intermediary Services Act (FAIS).
The FSP is licensed to provide advice and intermediary services in respect of Category I financial products, including but not limited to derivative instruments, long-term deposits, and short-term deposits.
All investment ideas are provided in accordance with the scope of the FSP's license and applicable regulatory requirements. Derivative instruments is a leveraged products that carry high risks and could result in losing all of your capital, and past performance is not indicative of future results.
This idea and any attachments are informational/education and does not constitute a recommendation to buy/sell.
No guarantee is made regarding the accuracy or outcome of this trade idea.
If you choose to accept this idea, please do so at your own risk.
Trade ideas

Naz 100 into the open .Monday 3rd NovemeberCan it keep above 26 K .?
Lets see what happens
Bullish chart
Could easily pullback

NAS BUY 11.3.25Step 1 - Market State
-market consolidated during asian and london, established a test of the low during london, high was created in asian
Step 2 - Location
-price breaks above the support are so we look for a retest, get one at 6am and another around 8am.
Step 3 - Entry would have been 26000, SL 25975, TP 1 26050, tp 2 26100 TP 3 is trailing stop loss at TP 2 that we adjust using the fib retracement to look for exit

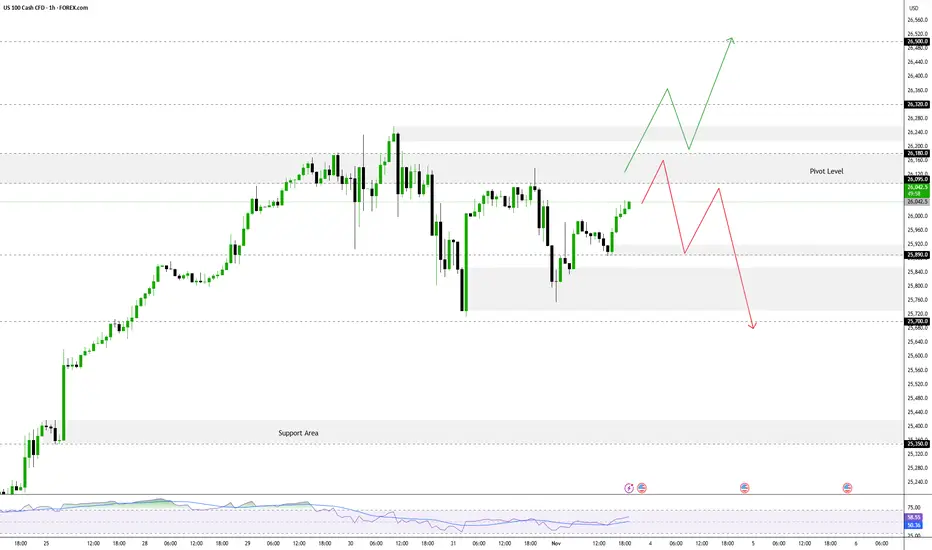
NASDAQ Testing Pivot Zone, Awaiting Breakout The FOREXCOM:NAS100 is currently testing a key zone called the Pivot Zone (a direction-determining area). The short-term trend will be determined by whether the price manages to stay below or break above this zone.
Pivot Zone: 26,095 – 26,180
As long as the price trades below this zone, short-term momentum remains bearish (tending to fall).
➡️ Bearish Scenario
If the price remains below 26,180, the negative bias will continue, with the following main targets:
- Target 1: 25,890
- Target 2: 25,700
- Target 3: 25,340
⬆️ Bullish Scenario
If a breakout and confirmation occurs above 26,180, this could signal the start of a new bullish trend, with the following targets:
- Target 1: 26,500
- Target 2: 26,850
USNAS100 remains bearish below 26,180, but a confirmed break above this level could signal the start of a new bullish leg.
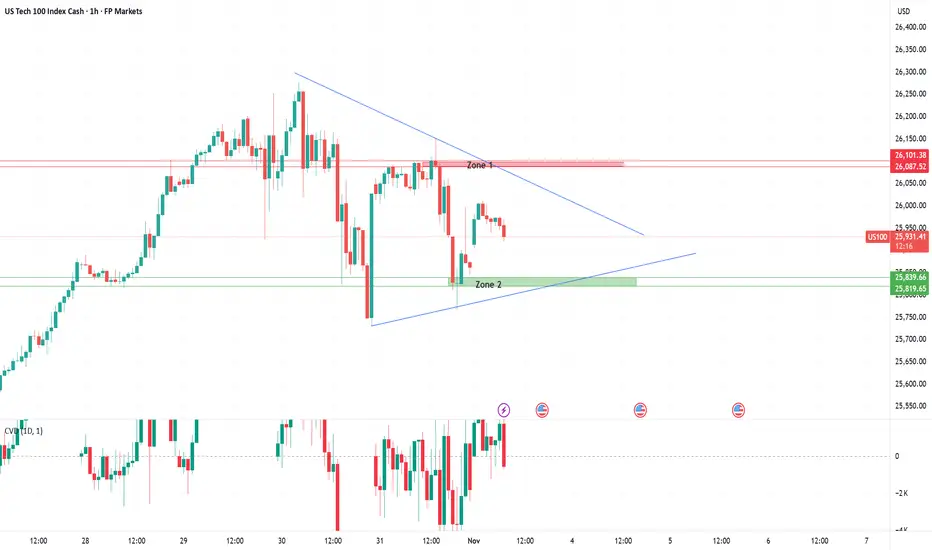
US100 – Key levels in focusUS100 – 1H Technical Zone Analysis
Zone 1: Friday’s High
This zone marks Friday’s high and the upper boundary of the current consolidation structure. It represents the point where bullish momentum paused before the weekend, and now acts as immediate resistance. A clean break and hold above Zone 1 would confirm renewed buyer strength and could open the path toward fresh all-time highs. Until then, traders are likely to view this level as a short-term decision point for directional bias.
Zone 2: Friday’s Low
This zone defines Friday’s session low — the level where buyers regained control and pushed price higher into the weekly close. It now serves as key intraday support and aligns closely with the ascending trendline structure. Holding above Zone 2 keeps market sentiment constructive and suggests that buyers remain in control of short-term direction. A clean break below would signal fading momentum and could invite a deeper pullback toward 25,700–25,750.
Market Recap – US100 Overview
The US100 closed last week on a strong note, extending its rally to fresh all-time highs as optimism spread across global markets. Sentiment was fueled by renewed progress in U.S.–China trade negotiations, with reports suggesting a potential framework deal and discussions over easing tariffs on rare-earth materials and agricultural goods. This reduced geopolitical risk and boosted risk appetite across equities.
Tech and AI-related stocks once again led the charge, highlighted by NVIDIA reaching a record $5 trillion valuation, reinforcing the dominance of the growth and semiconductor sectors. The Federal Reserve maintained a cautious stance, signalling that rate cuts are not guaranteed, but investors largely shrugged off policy uncertainty amid the ongoing government data blackout.
Overall, the tone was constructively bullish: optimism on trade and strong tech momentum outweighed concerns about stretched valuations and limited macro visibility. Heading into the new week, traders remain focused on whether the rally can hold as markets navigate high levels, thin data, and potential volatility from fresh headlines.
31 OCT 2025: US100 MARKET RECAPBREAD & BUTTER SETUP
DISCLAIMER:
The owner of this page is an authorised Representative under supervision of TD MARKETS (PTY) LTD, an authorised Financial Services Provider (FSP No. 49128) licensed by the Financial Sector Conduct Authority (FSCA) under the Financial Advisory and Intermediary Services Act (FAIS).
The FSP is licensed to provide advice and intermediary services in respect of Category I financial products, including but not limited to derivative instruments, long-term deposits, and short-term deposits.
All investment ideas are provided in accordance with the scope of the FSP's license and applicable regulatory requirements. Derivative instruments is a leveraged products that carry high risks and could result in losing all of your capital, and past performance is not indicative of future results.
This idea and any attachments are informational/education and does not constitute a recommendation to buy/sell.
No guarantee is made regarding the accuracy or outcome of this trade idea.
If you choose to accept this idea, please do so at your own risk.

30 OCT 2025: US100 MARKET RECAPLONDON KILL ZONE
BREAD & BUTTER SETUP
DISCLAIMER:
The owner of this page is an authorised Representative under supervision of TD MARKETS (PTY) LTD, an authorised Financial Services Provider (FSP No. 49128) licensed by the Financial Sector Conduct Authority (FSCA) under the Financial Advisory and Intermediary Services Act (FAIS).
The FSP is licensed to provide advice and intermediary services in respect of Category I financial products, including but not limited to derivative instruments, long-term deposits, and short-term deposits.
All investment ideas are provided in accordance with the scope of the FSP's license and applicable regulatory requirements. Derivative instruments is a leveraged products that carry high risks and could result in losing all of your capital, and past performance is not indicative of future results.
This idea and any attachments are informational/education and does not constitute a recommendation to buy/sell.
No guarantee is made regarding the accuracy or outcome of this trade idea.
If you choose to accept this idea, please do so at your own risk.

NAS100 Master Technical Analysis | Weekly Forecast Nov 3-7🚀 NAS100 NASDAQ-100 INDEX | Master Technical Analysis | Weekly Forecast Nov 3-7, 2025 🚀
📈 MULTI-TIMEFRAME ANALYSIS | INTRADAY & SWING TRADING BLUEPRINT | 25,866.9 📈
Closing Level: 25,866.9 | Analysis Date: November 1, 2025 | UTC+4
════════════════════════════════════════════════════════════════
🎯 MARKET OVERVIEW & CRITICAL LEVELS
NASDAQ-100 consolidates near all-time high territory at 25,866.9 , presenting a pivotal moment for tech bulls. Our comprehensive multi-timeframe analysis reveals a cautiously bullish stance with immediate resistance at 25,900 and crucial support at 25,750. The upcoming week offers exceptional opportunities for both scalpers and position traders as we navigate post-earnings volatility.
Major Support Levels: 📉
Immediate: 25,800 - 25,820
Secondary: 25,750 - 25,770
Critical: 25,650 - 25,680
Major: 25,500 - 25,550
Key Resistance Zones: 📈
Immediate: 25,900 - 25,920
Secondary: 25,980 - 26,000
Psychological: 26,100 - 26,150
Major Target: 26,250 - 26,300
════════════════════════════════════════════════════════════════
📊 WEEKLY TIMEFRAME (1W) - THE BIG PICTURE
Elliott Wave Structure: 🌊
Currently navigating Wave 4 correction within larger degree Wave 5 . The shallow retracement suggests strength, targeting 26,500+ upon completion. Alternate count places us in Wave B of an ABC correction - monitor 25,500 for validation.
Wyckoff Analysis: 📖
Textbook Re-accumulation Trading Range (TR) after upthrust. Volume signature confirms Phase C - Last Point of Support (LPS). Expect markup phase initiation above 25,920.
Ichimoku Cloud Perspective: ☁️
Price maintains position above weekly Kumo with Chikou Span confirmation. Tenkan-sen at 25,720 provides dynamic support. Bullish TK cross intact since October.
Harmonic Pattern Alert: 🦋
Potential Bullish Crab pattern forming with PRZ at 25,650-25,700. The 1.618 XA extension at 26,450 serves as measured target upon pattern completion.
Gann Analysis: 📐
Price respecting 1x1 Gann angle from September low. Next significant Gann resistance at 26,080 (45-degree angle from yearly pivot).
════════════════════════════════════════════════════════════════
📉 DAILY TIMEFRAME (1D) - SWING TRADER'S ROADMAP
Japanese Candlestick Patterns: 🕯️
Yesterday's Spinning Top at resistance signals indecision. Watch for today's close above 25,900 to confirm Three White Soldiers continuation pattern.
Pattern Recognition:
Ascending Triangle formation with horizontal resistance at 25,900. Successful breakout projects 26,250 target (350-point measured move).
Bollinger Bands Analysis:
Price kissing upper band (25,885) with bands expanding - volatility breakout imminent. Middle band at 25,720 serves as dynamic support.
RSI & Momentum Oscillators:
RSI at 62 - bullish but not overbought. Hidden bullish divergence on 4H timeframe supports continuation thesis.
Volume Profile: 📊
High Volume Node (HVN) at 25,750-25,800 acting as support magnet. Point of Control (POC) at 25,680 defines major support.
════════════════════════════════════════════════════════════════
⏰ 4-HOUR TIMEFRAME (4H) - SWING & INTRADAY FUSION
Dow Theory Application: 📈
Primary trend: Bullish (series of HH-HL intact)
Secondary trend: Consolidation phase
Minor trend: Testing resistance
Chart Pattern Alert:
Bull Flag completion targeting 26,050. Flag pole: 25,600-25,900 (300 points). Breakout confirmation above 25,920 activates pattern.
Moving Average Configuration:
EMA 20: 25,825 (immediate support)
EMA 50: 25,760 (strong support)
SMA 100: 25,680 (critical support)
SMA 200: 25,550 (major support)
VWAP Analysis:
Weekly VWAP at 25,810 acting as dynamic pivot. Price above VWAP = bullish intraday bias.
════════════════════════════════════════════════════════════════
🎪 1-HOUR TIMEFRAME (1H) - PRECISION ENTRIES
Immediate Setup: 💡
Inverse Head & Shoulders pattern developing. Left shoulder: 25,750, Head: 25,700, Right shoulder forming at 25,760. Neckline at 25,900 - breakout targets 26,100.
Support & Resistance Matrix:
R4: 26,150 (Weekly R2 Pivot)
R3: 26,050 (Pattern Target)
R2: 25,980 (Psychological)
R1: 25,920 (Neckline)
PIVOT: 25,866 (Current)
S1: 25,820 (1H Support)
S2: 25,760 (Right Shoulder)
S3: 25,700 (Pattern Low)
Entry Strategies: 🎯
Breakout Long: Above 25,920 | Stop: 25,850 | Target: 26,050
Pullback Long: 25,820 test | Stop: 25,760 | Target: 25,920
Reversal Long: 25,760 bounce | Stop: 25,700 | Target: 25,900
════════════════════════════════════════════════════════════════
⚡ 30-MINUTE TIMEFRAME (30M) - SCALPER'S PLAYGROUND
Micro Structure: 🔍
Rising Wedge pattern - bearish implications short-term. Expect pullback to 25,800 before continuation. Volume declining confirms pattern.
Scalping Zones: 🎯
Prime Buy Zones:
• Zone A: 25,820-25,830 (30M demand)
• Zone B: 25,790-25,800 (VWAP test)
• Zone C: 25,760-25,770 (Strong support)
Prime Sell Zones:
• Zone A: 25,900-25,910 (30M supply)
• Zone B: 25,940-25,950 (Extension)
• Zone C: 25,980-26,000 (Major resistance)
ATR & Volatility:
30M ATR(14): 35 points - optimal stop-loss range: 25-30 points
════════════════════════════════════════════════════════════════
🏃 15-MINUTE & 5-MINUTE ULTRA-SCALPING
15-Minute Momentum Setup: ⚠️
Bullish Pennant forming - breakout above 25,880 targets 25,920 (40-point quick move).
5-Minute Precision Matrix:
London Open: Range 25,840-25,880
NY Pre-market: Breakout potential above 25,900
NY Open: Volatility spike - 50+ point moves
NY Afternoon: Consolidation 25,850-25,900
RSI Scalping Strategy:
5M RSI < 25: Oversold bounce long
5M RSI > 75: Overbought short
15M RSI divergence: Position entry
Optimal RSI range: 40-60 for trends
════════════════════════════════════════════════════════════════
📅 WEEKLY FORECAST & DAILY GAMEPLAN (Nov 3-7, 2025)
Monday, November 3: 🚀
Gap-up potential to 25,920. First test of resistance.
Strategy: Wait for pullback to 25,850 for longs
Target: 25,950-25,980
Tuesday, November 4: 📊
Election uncertainty - expect 100+ point range.
Strategy: Fade extremes with tight stops
Range: 25,750-25,950
Wednesday, November 5: 💥
Breakout day - major move expected post-election.
Strategy: Momentum trades only
Breakout target: 26,100+
Thursday, November 6: 🔄
Consolidation/profit-taking day.
Strategy: Range trading 25,900-26,050
Focus: Mean reversion
Friday, November 7: 📈
Weekly options expiry - pin risk around 26,000.
Strategy: Fade moves away from 26,000
Close above 26,000 = Bullish weekly
════════════════════════════════════════════════════════════════
💼 COMPREHENSIVE TRADE MANAGEMENT
Intraday Risk Parameters: 🎮
Maximum risk per trade: 0.5-1% of capital
Risk-Reward minimum: 1:2.5 ratio
Daily stop loss: -2% of account
Trailing stop activation: After +30 points
Breakeven stop: After +20 points profit
Maximum daily trades: 3-5 quality setups
Swing Position Guidelines: 📊
Position sizing: 2-3% portfolio risk
Initial stop-loss: Below 25,650 (major support)
Target 1: 26,050 (30% exit)
Target 2: 26,150 (40% exit)
Target 3: 26,300 (20% exit)
Runner: 26,500 (10% moon shot)
════════════════════════════════════════════════════════════════
⚠️ RISK SCENARIOS & INVALIDATION TRIGGERS
Bearish Reversal Signals: 🐻
Hourly close below 25,800 = Caution mode
Daily close below 25,750 = Bearish shift
Break of 25,650 = Major support failure
Weekly close below 25,500 = Trend reversal
Black Swan Considerations: 🦢
• Tech earnings surprises
• Federal Reserve policy shifts
• Geopolitical tensions escalation
• Major tech regulatory news
• AI sector rotation risks
════════════════════════════════════════════════════════════════
🔥 HIGH-PROBABILITY CONFLUENCE ZONES
Ultimate Buy Zone: ✅
25,750-25,800
(EMA cluster + Fibonacci 61.8% + Volume POC + Daily pivot)
Ultimate Sell Zone: ❌
26,050-26,100
(Pattern targets + Weekly R1 + Psychological round number)
Breakout Trigger Zone: 🚀
25,920-25,950
(Multiple pattern completions + Resistance cluster)
════════════════════════════════════════════════════════════════
📝 WEEK AHEAD SUMMARY & ACTION ITEMS
The NASDAQ-100 stands at a critical technical juncture at 25,866.9. Multiple timeframe analysis confirms bullish bias above 25,750 with significant upside potential toward 26,300. The convergence of pattern completions, moving average support, and favorable volume dynamics creates an optimal risk-reward environment for disciplined traders.
Top 3 Trade Setups: 🏆
Swing Long: 25,750-25,800 zone | Target: 26,150
Breakout Long: Above 25,920 | Target: 26,050
Scalp Long: VWAP touches at 25,810 | Target: 25,900
Key Success Factors:
• Respect stop-losses religiously
• Scale in positions gradually
• Book partial profits at targets
• Trail stops on winners
• Stay patient for A+ setups
"The trend is your friend until the end when it bends" - Trade the trend, manage the risk!
════════════════════════════════════════════════════════════════
🎯 FINAL THOUGHTS
Tech bulls maintain control above 25,750. The path of least resistance remains HIGHER targeting 26,300. Election week volatility presents exceptional opportunities for prepared traders. Remember: Plan your trade, trade your plan!
Stay disciplined. Stay profitable. 💰
════════════════════════════════════════════════════════════════
#NAS100 #NASDAQ #TechnicalAnalysis #Trading #Indices #StockMarket #DayTrading #SwingTrading #ElliottWave #PriceAction #TradingStrategy #TradingView #MarketAnalysis #IndexTrading #TechStocks #SPX #QQQ #MarketForecast
🔔 Follow for Daily Premium Analysis! | Trade Smart, Not Hard! 📊
Risk Disclaimer: This analysis is for educational purposes only. Past performance doesn't guarantee future results. Always conduct your own research and implement proper risk management.
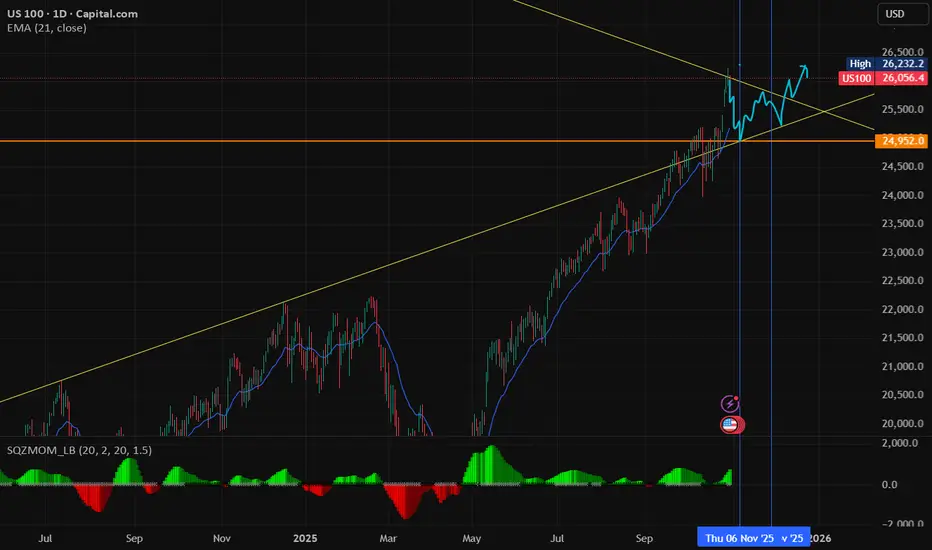
US100 phase D confirmedNOT financial advice, please be cautious with your capital, you are the only and solely responsible for your actions and reaction at every time so asses properly the information shared, after all I don't know better than a hedge fund, but if they tell you something on the charts, why not listening to them?
Interestingly enough, phase c is already checked and phase D too. the neck has been already confirmed by the pro when they defended the neck + it made the masses enter heavily just for the matter of being above the neck. what i am expecting? A phase C on a smaller timeframe such as 15 min. Potential path 26171 because it is the ceiling and everyone knows that + it is impossible to know if the market will already continue higher after reaching 26171 or instead will continue with phase D and then a potential shake out (look that i am talking in the future, different projections)

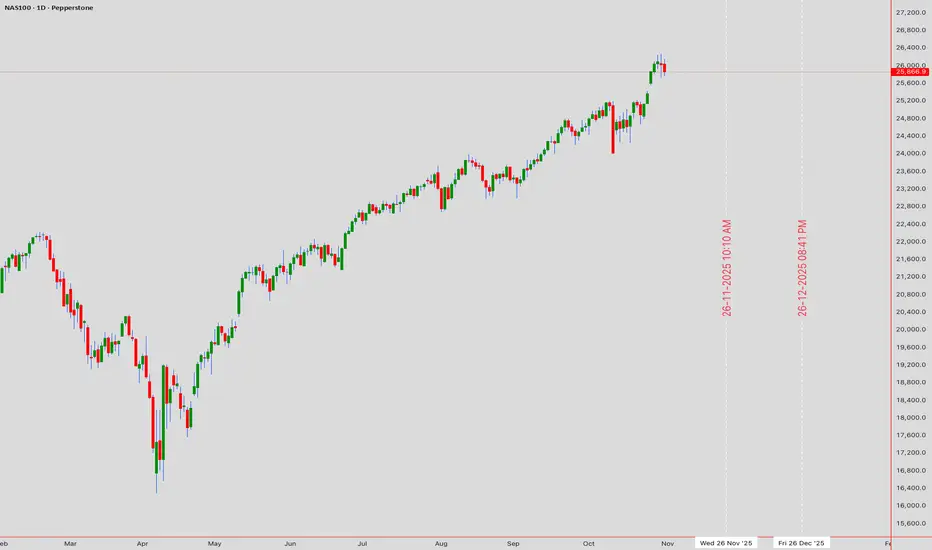
Nasdaq November RED candle and then continue movement.Due since april we have monthly 7 green candles, we need a reversal and red candle in November to continue then the movement to 27,000. But first a back movement to 25,000 and triangle pattern could be the movement for november.
Nasdaq November RED candle and then continue movement.Due since april we have monthly 7 green candles, we need a reversal and red candle in November to continue then the movement to 27,000. But first a back movement to 25,000 and triangle pattern could be the movement for november.
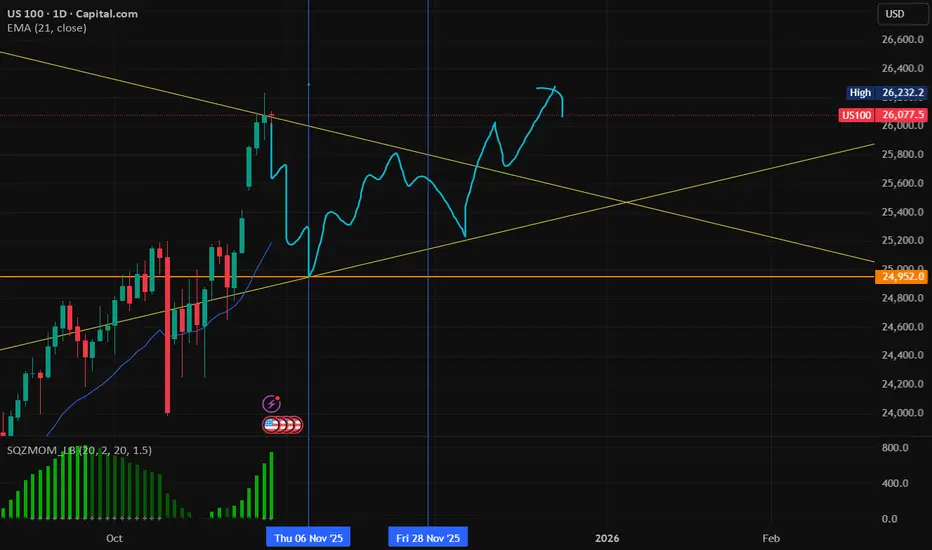
Nasdaq-100 Wave Analysis – 29 October 2025
- Nasdaq-100 broke resistance area
- Likely to rise to resistance level 27000.00
Nasdaq-100 index recently broke the resistance area between the resistance level 26000.00 and the resistance trendline of the extended daily up channel from May.
The breakout of this resistance area accelerated the active short-term impulse wave iii of the impulse wave 5 from the start of Septembers.
Given the strong daily uptrend and rising daily Momentum, Nasdaq-100 index can be expected to rise to the next resistance level 27000.00 (target price for the completion of the active impulse wave iii).

shortthink, we might pump, fail retest down, then end of day come back up.
but if cannot close above, likely hard down first.

NSDQ100 bullish breakout ahead of tech earningsGlobal equities largely consolidated over the past 24 hours, but US tech stocks extended their strong run, propelling the Nasdaq 100 to another record close. The Nasdaq gained +0.80%, outpacing broader benchmarks as AI-related enthusiasm and mega-cap momentum continued to dominate trading.
Market Highlights
Narrow Leadership: Despite the Nasdaq’s gains, market breadth was strikingly thin. Only 104 S&P 500 constituents advanced—the fewest on any up day since at least 1990—underscoring how dependent recent rallies have become on large-cap tech strength.
AI Momentum:
Nvidia (+4.98%) led the charge after CEO Jensen Huang unveiled multiple new partnerships (Uber, Palantir, Crowdstrike), a $1bn investment in Nokia, and plans to connect quantum computing with Nvidia AI chips. Nokia surged nearly 21% to its highest level in a decade.
Microsoft (+1.98%) jumped after revealing a 27% stake in OpenAI, alongside a massive $250bn Azure services commitment from OpenAI, lifting Microsoft’s market cap back above $4 trillion.
PayPal (+3.94%) rallied after an earnings upgrade and a new partnership with OpenAI.
Amazon (+1.00%) advanced despite announcing plans to cut 14,000 corporate roles to streamline operations.
Magnificent 7: The group gained +1.27%, setting fresh highs, with investors rotating further into AI leaders ahead of tonight’s Microsoft, Alphabet, and Meta earnings.
Macro & Outlook
All eyes now turn to the Federal Reserve’s policy decision later today, where a 25bps rate cut is fully priced in. Market participants will parse Chair Powell’s comments for guidance on the pace of future easing and any mention of lingering inflation or financial conditions.
Volatility may rise post-Fed, with the Nasdaq 100 particularly sensitive to any shifts in rate expectations and tonight’s mega-cap tech earnings.
Takeaway
Momentum in the Nasdaq 100 remains intact but increasingly narrow, driven by AI exuberance and corporate partnerships rather than broad-based earnings strength. A dovish Fed and upbeat results from Microsoft, Alphabet, or Meta could reinforce upside momentum—but any disappointment may trigger a sharp reaction given stretched positioning.
This communication is for informational purposes only and should not be viewed as any form of recommendation as to a particular course of action or as investment advice. It is not intended as an offer or solicitation for the purchase or sale of any financial instrument or as an official confirmation of any transaction. Opinions, estimates and assumptions expressed herein are made as of the date of this communication and are subject to change without notice. This communication has been prepared based upon information, including market prices, data and other information, believed to be reliable; however, Trade Nation does not warrant its completeness or accuracy. All market prices and market data contained in or attached to this communication are indicative and subject to change without notice.

Bullish channel breakout on USTEC, potential for further gains? USTEC rose to fresh highs as AI demand and strong semiconductor orders bolstered investor sentiment.
SK Hynix customers have secured its entire memory chip lineup for 2026, reinforcing confidence in tech earnings momentum. Attention now turns to upcoming earnings from Big Tech to gauge the sustainability of the USTEC's rally.
From a technical perspective, USTEC broke out of the ascending channel's upper bound at 26000. If the index sustains its bullish momentum above the 26000 threshold, the price could gain upward momentum toward the 127.2% Fibonacci Extension and resistance at 27200. Conversely, if USTEC returns within the channel and 26000 threshold, the index may retest the support at 25200.
By Li Xing Gan, Financial Markets Strategist Consultant to Exness

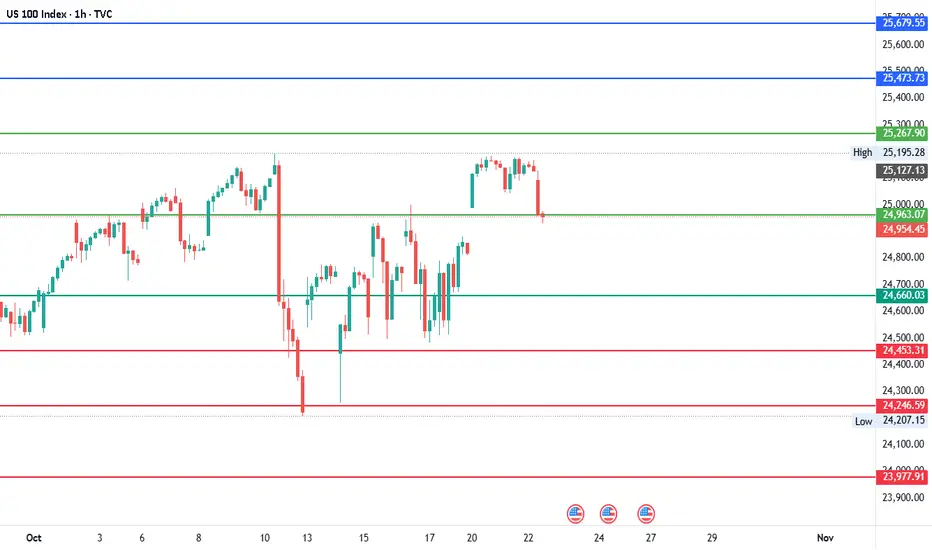
#NDQ - Short-term Range $26,216 - $23,709 | 1000 Points Move?Date: 22-10-2025
#NDQ - Current Price: $24,963.00
Pivot Point: $24,963.07 Support: $24,660.03 Resistance: $25,267.90
Upside Levels:
L1: $25,473.73 L2: $25,679.55 L3: $25,948.23 L4: $26,216.91
Downside Levels:
L1: $24,453.31 L2: $24,246.59 L3: $23,977.91 L4: $23,709.23
#TradingView #Nifty #BankNifty #DJI #NDQ #SENSEX #DAX #USOIL #GOLD #SILVER
US100 – Buyers Take Full Control as Market Breaks Out4H Technical Zone Analysis
Zone 1: Monday’s All-Time High
This zone marks Monday’s all-time high, where the market initially paused after a strong impulse move. The breakout above this level signals clear bullish dominance, but as price extends into record territory, this zone now serves as a potential pivot area. Should price revisit it, traders will be watching for whether former resistance can act as support — a successful retest here would confirm the breakout’s strength and validate continued upward momentum.
Zone 2: Tuesday’s Demand Base
This area represents the level where buyers decisively regained control during Tuesday’s session, driving a sharp rally that broke above prior highs. It reflects the origin of the latest bullish leg and highlights strong demand from institutional participants. As long as price holds above Zone 2, intraday sentiment remains bullish and pullbacks into this area are likely to attract renewed buying interest. A sustained move below, however, would suggest momentum exhaustion and open the door for a deeper retracement.
Sentiment Overview
The Nas100 surged yesterday, driven by a wave of optimism following encouraging headlines on both the macro and geopolitical fronts. Markets rallied after reports of a “constructive” round of US-China trade talks in Malaysia, which eased fears of renewed escalation and reignited risk appetite across global equities. At the same time, a softer-than-expected US CPI print reinforced hopes that inflation pressures are moderating, prompting renewed speculation that the Federal Reserve could adopt a more dovish tone once government operations resume.
Tech and semiconductor stocks once again led the advance, supported by strong earnings and continued enthusiasm around AI and digital infrastructure. The index pushed into fresh record territory, underscoring how dominant the tech sector remains as a driver of sentiment.
Heading into today’s session, the tone is cautiously constructive. The market is buoyed by improved trade relations and stable inflation expectations, yet traders are aware that valuations are stretched and macro visibility is limited due to the ongoing US government shutdown. With key data releases delayed and the index at all-time highs, volatility could spike on any unexpected headlines or shifts in tone from policymakers.

Nasdaq 100 Trade ideaLet’s see how it reacts to this BISI, could be seeking for the highs it just created.

NAS100 – Technical Analysis | Bulls Take ChargeNAS100 extended its bullish rally after breaking above 25,190.00 and 25,600.00, confirming strong buyer control. The index continues to print higher highs, with momentum favoring further upside as long as price remains above the breakout zone.
Support at: 25,600.00 🔽 / 25,190.00 🔽 / 25,000.00 🔽
Resistance at: 25,900.00 🔼 / 26,000.00 🔼
🔎 Bias:
🔼 Bullish: Sustained trading above 25,600.00 supports continuation toward 25,900.00 and possibly 26,000.00.
🔽 Bearish: A drop back below 25,190.00 could trigger a correction toward 25,000.00.
📛 Disclaimer: This is not financial advice. Trade at your own risk.

$NDX Reaches 161.8% Fib ExtensionNASDAQ:NDX has again reached the 161.8% Fib Extension in its latest move of this Bull Market. The last time this occurred was July 10th, 2024. A key difference this time is that SP:SPX is not concurrently reaching the same extension, and is instead lagging in pace.

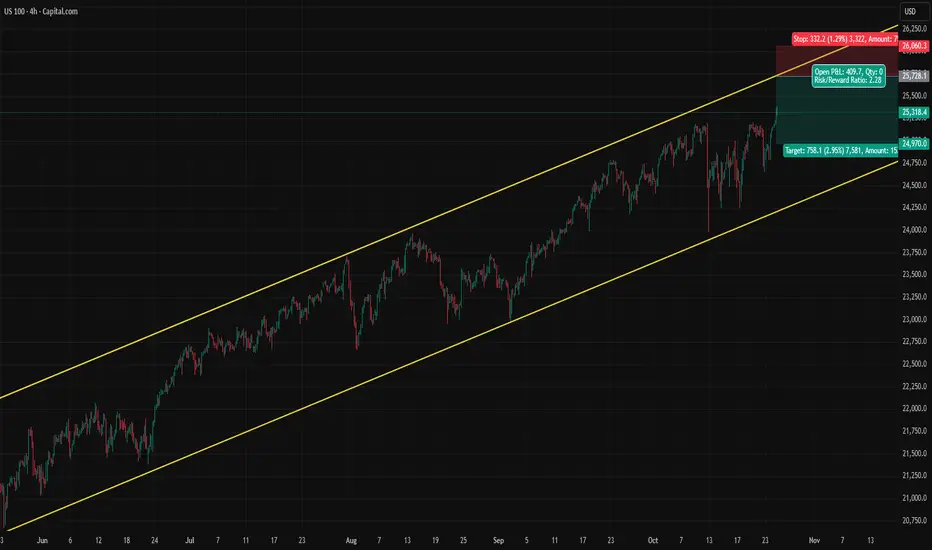
Nasdaq Enjoys CPI, But How Much More?Nasdaq still trending up, enjoying the today's lower than expected CPI data. If it ride towards the upper line of the channel, it likely to get rejected. I don't see any reason for an upside breakout at the moment. Setup is for today and Monday, I will deactivate my order after Monday.
Risk/Reward: 2.28
trade 2Scenario 1: Buy Limit @ 25376 i.e value-based buying
SL @ last blue cambist line
Risk 0.4%
R:R 1:1

NAS100 Trade Set Up Oct 27 2025Price has broken PDL and made ATH during Asia session so i am expecting a sweep of SSL then internal structure on the 1m/5m forming CISD/IFVG to continue higher to BSL/London highs
