NSDQ100 relief rally led by mega-cap tech.Nasdaq 100 Trading Summary
Tech sentiment has rebounded strongly after upbeat earnings from Amazon and Apple, reversing much of yesterday’s selloff.
Amazon (+13% pre-market): Cloud revenue up +20% y/y, fastest growth since 2022 — a major boost for one of the year’s weakest Mag-7 names.
Apple (+2% pre-market): Forecasts 10–12% revenue growth this quarter (vs +6% expected), driven by stronger iPhone demand.
US futures: Nasdaq +1.2%, S&P 500 +0.65%, erasing most of Thursday’s losses.
Yesterday’s decline stemmed from AI-capex worries after Meta (-11.3%) and Nvidia (-2%) fell on spending and China-sales concerns. Those fears are easing as investors refocus on strong earnings and resilient demand.
Other Headlines
Universal Music beat estimates on subscription revenue, supporting consumer-discretionary sentiment.
Beverage giants continue to struggle — $830 bn in market value lost since 2021 amid shifting habits and tariffs.
UK retail: Growing backlash against chatbots may be hurting sales by billions, highlighting limits of AI adoption.
Outlook
Nasdaq 100 looks set for a relief rally led by mega-cap tech.
Focus today: follow-through buying in Amazon and Apple, stabilization in AI names (Meta, Nvidia), and overall positioning into month-end and key US inflation data later in the day.
This communication is for informational purposes only and should not be viewed as any form of recommendation as to a particular course of action or as investment advice. It is not intended as an offer or solicitation for the purchase or sale of any financial instrument or as an official confirmation of any transaction. Opinions, estimates and assumptions expressed herein are made as of the date of this communication and are subject to change without notice. This communication has been prepared based upon information, including market prices, data and other information, believed to be reliable; however, Trade Nation does not warrant its completeness or accuracy. All market prices and market data contained in or attached to this communication are indicative and subject to change without notice.
Trade ideas

NAS100 Trade Set Up Oct 31 2025Price is forming HH/HL on the 1h so could be bullish but on the 4h its still bearish so i want to see either a sweep of EQH to then form internal 1m/5m bearish structure to target SSL or a sweep of SSL first to then target EQH

USNAS100 / Fed Caution and Earnings Weigh on MomentumUSNAS100 – MARKET OUTLOOK | Futures Stall Near Highs as Fed Turns Cautious 🇺🇸
Wall Street futures held near record levels after the Fed’s 25bps rate cut, as traders weighed Powell’s cautious tone, Big Tech earnings, and a new U.S.–China trade deal.
🔽 Below 26,170: Bearish momentum toward 26,050 → 25,890 → 25,700.
🔼 Above 26,180: Trend turns bullish toward 26,500 → 26,850.
Pivot: 26,170
Support: 26,050 · 25,890 · 25,700
Resistance: 26,300 · 26,500 · 26,850
USNAS100 remains bearish while below 26,170, though strong tech earnings could trigger short-term upside volatility.

NAS BEARISH SETUP As the price continues to trade above 25. Price has met resistance at 26.2 and is about to test it again forming a double top on new resistance

US100 Price is near a strong selling zone.
I expect a possible rejection from this level.
Targets are shown in the attached analysis.
This is not financial advice, just personal analysis.

US100 phase D confirmedNOT financial advice, please be cautious with your capital, you are the only and solely responsible for your actions and reaction at every time so asses properly the information shared, after all I don't know better than a hedge fund, but if they tell you something on the charts, why not listening to them?
Interestingly enough, phase c is already checked and phase D too. the neck has been already confirmed by the pro when they defended the neck + it made the masses enter heavily just for the matter of being above the neck. what i am expecting? A phase C on a smaller timeframe such as 15 min. Potential path 26171 because it is the ceiling and everyone knows that + it is impossible to know if the market will already continue higher after reaching 26171 or instead will continue with phase D and then a potential shake out (look that i am talking in the future, different projections)

Nasdaq Holds Below the 26,300-ResistanceHaving broken above the 26,000 mark, the Nasdaq has also moved beyond the upper boundary of a channel respected since July 2025, now trading within the duplicated (parallel) channel structure.
The mid-zone of this duplicated channel represents initial resistance near 26,300, and a confirmed breakout above this level could extend gains toward the upper boundary near 26,800.
On the downside, a move back below 25,700 could trigger a sharper pullback toward 25,400, with additional support near 25,200. The daily RSI continues to diverge negatively from price action, signaling caution near current record highs.
Written by Razan Hilal, CMT

NAS100 Head and Shoulders and Gap If I am correct, and that is an M15 TF head and shoulders pattern then we might finally see a fill of that gap.

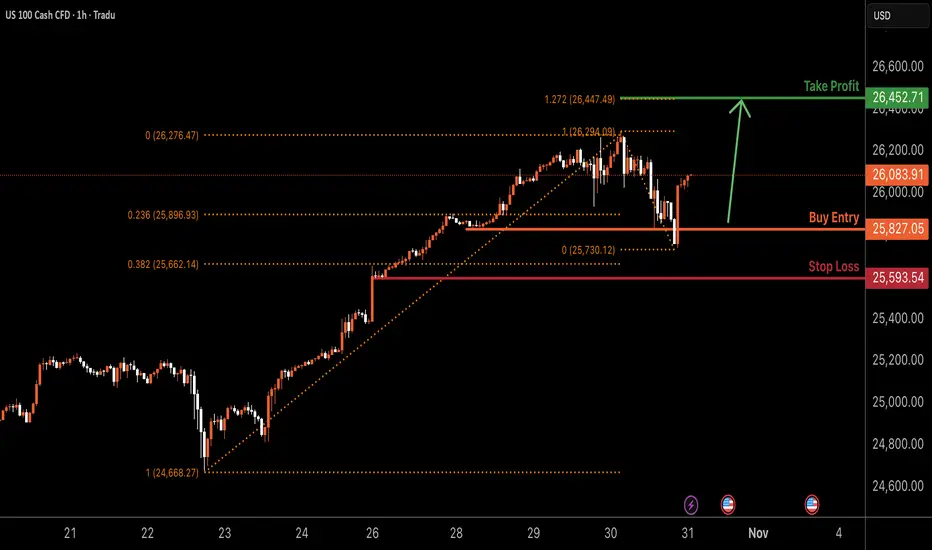
NAS100 H1 | Bullish Continuation In PlayNAS100 has bounced off the buy entry at 25,827.05, which is a pullback support that lines up with the 23.6% Fibonacci retracement and could rise from this level to the upside.
Stop loss is at 25,593.54, which is a pullback support that is slightly below the 50% Fibonacci retracement.
Take profit is at 26,452.71, which aligns with the 127.2% Fibonacci extension.
Stratos Markets Limited (tradu.com ):
CFDs are complex instruments and come with a high risk of losing money rapidly due to leverage. 68% of retail investor accounts lose money when trading CFDs with this provider. You should consider whether you understand how CFDs work and whether you can afford to take the high risk of losing your money.
Stratos Europe Ltd (tradu.com ):
CFDs are complex instruments and come with a high risk of losing money rapidly due to leverage. 70% of retail investor accounts lose money when trading CFDs with this provider. You should consider whether you understand how CFDs work and whether you can afford to take the high risk of losing your money.
US100 (NDQ): Trend in daily time frameThe color levels are very accurate levels of support and resistance in different time frames, and we have to wait for their reaction in these areas.
So, Please pay special attention to the very accurate trends, colored levels,
and you must know that SETUP is very sensitive.
Be careful
BEST
MT

nas shortthink we haven't hit big liqudity zone yet. got chance to still go down, 930 see what happens.

Nasdaq-expecting price to pull back up and open my trade then a continuation further down
-based on this new all time high,price is likely to correct or reverse from my perspective 🤔

NAS100 Trade Set Up Oct 30 2025Price is making LH/LL on the 15m and 1h so i am bearish but first i either want to see a pullback into 1h CISD to then look for internal structure to continue down but if price first sweep PDL and/or EQL, i will look for short buys back up before looking for sells back down

NAS100 ShortElite analysis
Price reacted off of 4h structural liquidity
Targeting lower liquidity pools

NDQShift prediction to the right.
Global market cooler anticipated. Crypto should be hit the hardest and fastest.
Most anticipating rally continuation like post-COVID...
I think that will cause a surprise.

News Whirlwind Propels Nasdaq 100 to a Fresh All-Time HighNews Whirlwind Propels Nasdaq 100 to a Fresh All-Time High
According to the chart, the Nasdaq 100 index has climbed above the 26,260 mark for the first time in history. Market sentiment is being driven by an extraordinary combination of powerful news factors:
→ Meeting between US President Donald Trump and China’s leader Xi Jinping in Busan, South Korea. The talks lasted around one hour and forty minutes. Xi emphasised the importance of “steering the giant ship” of bilateral relations, while Trump described the meeting as “tremendous” and “fantastic”. However, few concrete details about a potential trade deal were revealed.
→ Federal Reserve rate cut. As expected, the Fed cut interest rates by 0.25% yesterday. Jerome Powell struck a cautious tone, using the metaphor of “driving through fog” to describe the lack of key inflation and labour market data due to the government shutdown. He also highlighted divisions within the committee, suggesting that another rate cut – possibly in December – remains uncertain.
→ Tech giant earnings reports. After the US stock market closed yesterday, Microsoft (MSFT), Alphabet (GOOGL), and Meta Platforms (META) released their quarterly results. A key theme across all three was massive capital expenditure on artificial intelligence. Investors are now questioning whether these heavy investments are beginning to pay off.
Technical analysis of the Nasdaq 100 chart
At the start of the week, when analysing the hourly chart of the Nasdaq 100, we:
→ used the outlines of the 10 October sell-off to construct an upward channel (shown in blue);
→ drew a steeper trajectory using three orange trendlines;
→ suggested that the price target was the upper boundary of the blue channel.
That target has now been reached, and the upper boundary is showing signs of resistance — evidenced by the price slipping below the middle orange line and now being supported by the lower one.
Given the emerging RSI divergence, it is reasonable to assume that the upward momentum (+6% since the start of the month) may begin to slow. Note the recent bearish candlestick (marked by an arrow), notable for its strong move. Profit-taking could soon occur, with bears potentially attempting to push the Nasdaq 100 back down towards the median of the blue channel.
This article represents the opinion of the Companies operating under the FXOpen brand only. It is not to be construed as an offer, solicitation, or recommendation with respect to products and services provided by the Companies operating under the FXOpen brand, nor is it to be considered financial advice.

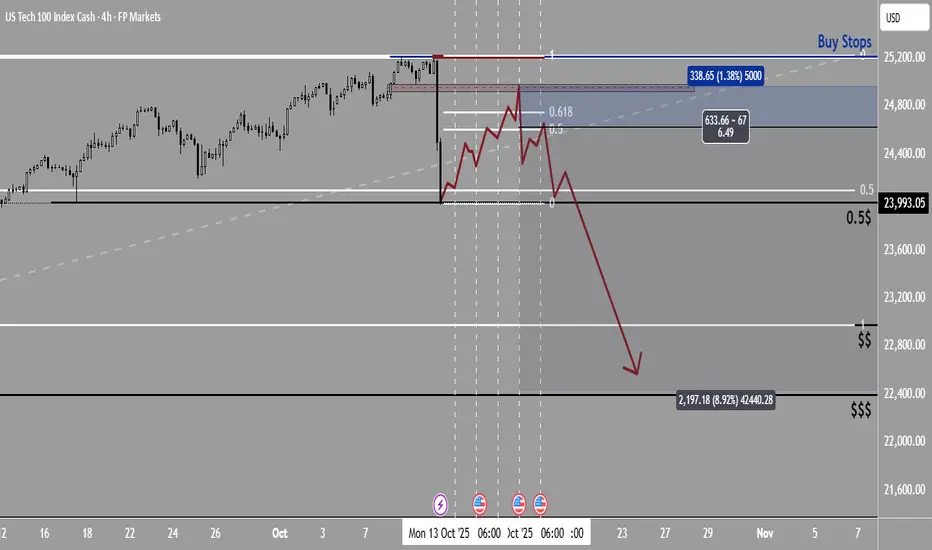
two scenarios for NQ on October I currently have two scenarios for NASDAQ, and both are bearish.
Scenario 1: The downtrend has already started. If we see a pullback around the 0.5 Fibonacci level, I’ll look to short again and keep stacking sell positions
Scenario 2: NASDAQ might retest the previous high — the one where the sharp drop started — move sideways for a while, and then start another leg down.
P.S. Success depends on proper risk management.
#NASDAQ #NASDAQ100
NAS100Bearish Divergence formed in 1hr
SL (Stop Loss): 26,315
This is just above the recent swing high — it protects your trade if the price keeps rising instead of dropping.
Entry: 25,895
This is the suggested sell (short) entry level — price is expected to move down after breaking below this level, confirming the reversal.
TP (Take Profit): 25,485
This is the target level, where you can close your trade for profit if the price falls as expected.

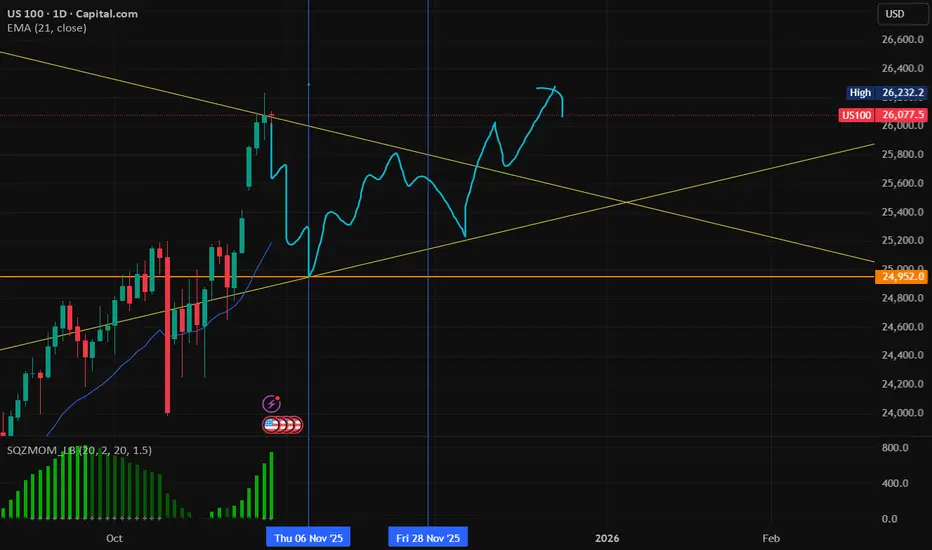
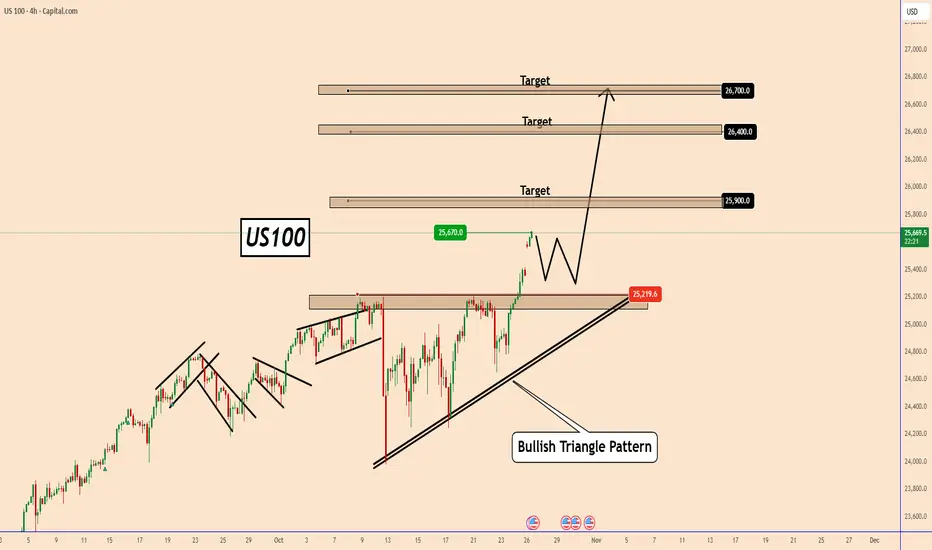
Nasdaq November RED candle and then continue movement.Due since april we have monthly 7 green candles, we need a reversal and red candle in November to continue then the movement to 27,000. But first a back movement to 25,000 and triangle pattern could be the movement for november.
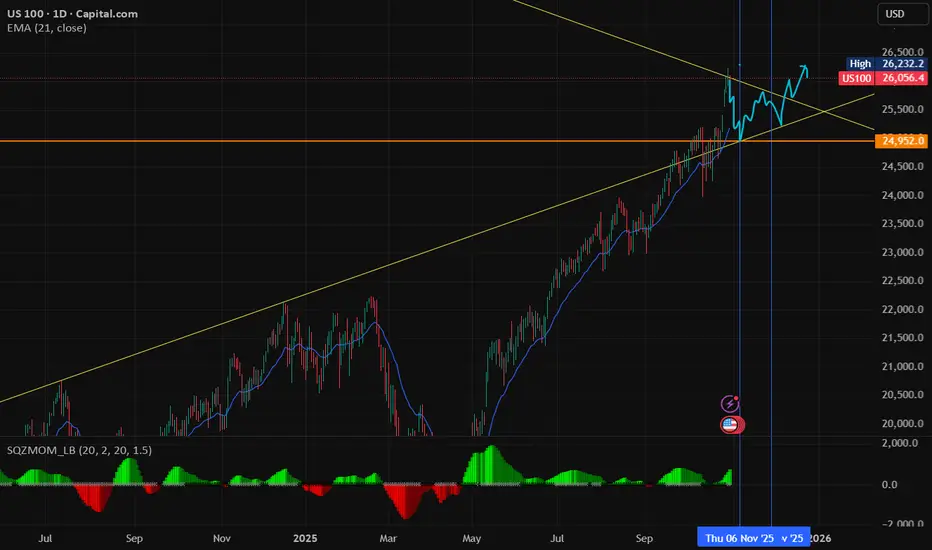
Nasdaq November RED candle and then continue movement.Due since april we have monthly 7 green candles, we need a reversal and red candle in November to continue then the movement to 27,000. But first a back movement to 25,000 and triangle pattern could be the movement for november.
US100 Breaks Out as Trade Optimism and Fed Expectations Fuel MomUS100 Breaks Out as Trade Optimism and Fed Expectations Fuel Momentum
Over the weekend, US President Donald Trump said that the US and China will reach a deal.
US President Donald Trump said that the US and China are ready to "reach" a trade deal, as he is expected to meet with Chinese President Xi Jinping later this week in South Korea during his Asia tour.
This decision gave the market a breather and increased optimism about an improvement in business sentiment. The indices came out of consolidation to create new record highs.
US100 has already reached 25670 and looks set to rise further as shown in the chart with targets:
25900; 26400 and 26700
This week, the FED is also expected to cut rates by 25 basis points to 4% from 4.25%.
These expectations should help indices to rise further
US100 may test 25300 again before moving further. So, take note of this.
However, so far, US100 remains strong, and this momentum could continue to grow further.
You may find more details in the chart!
Thank you and Good Luck!
❤️PS: Please support with a like or comment if you find this analysis useful for your trading day❤️
NASDAQ 100 Analysis !
The current price of the NASDAQ is $26,127, and my projection points to $32,000 in the coming months, entering 2026. This analysis is based exclusively on price action, following Al Brooks' methodology, through the technical analysis developed by Josias Baltazar, one of his closest students.
Use this projection as a reference for your decisions, whether in stocks or wherever you deem it appropriate.
I'll leave this analysis here... and I'll return in the future to see how it played out.

NAS100 Bearish Setup | Momentum Weakness Detected before FOMCNAS100 is showing early signs of a potential reversal after a strong bullish rally. Price action has formed a bearish divergence on the RSI — with price making higher highs while RSI prints lower highs — signaling fading momentum among buyers.
Volume has also declined during the recent upswing, suggesting weak participation in the continuation move and potential exhaustion near the recent top. A sell setup is active with the stop loss marked in red above the previous high to protect against false breakouts, while the target zone highlighted in green aligns with the next structural support and volume-based demand area.
A decisive close below near-term support would confirm bearish intent and open the path toward the target zone. Traders should monitor momentum indicators for confirmation of sustained weakness before continuation.
