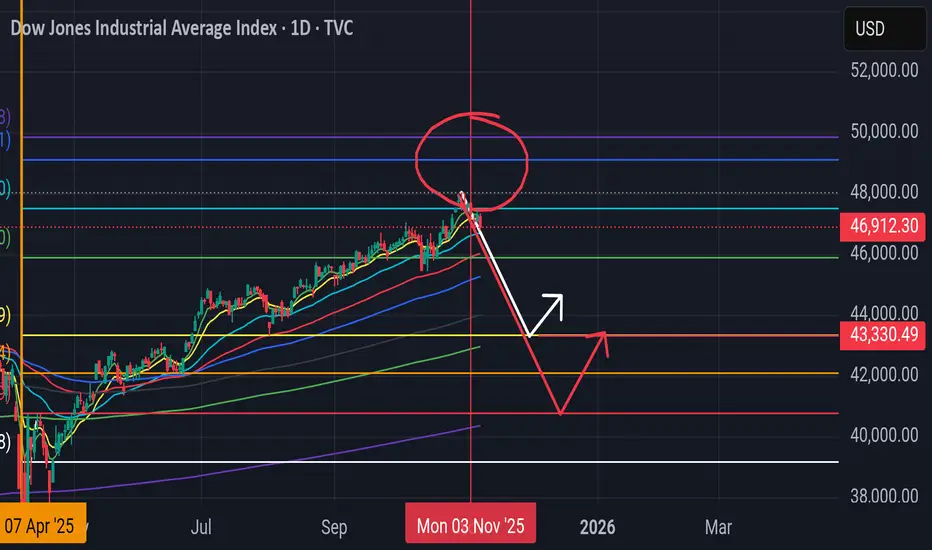
Market correction, filling gaps and money shiftIt is expected and have been waiting for it for few weeks.
the market needs to correct itself by:
- Institutions and large funds (market makers) to exit from high tech AI and overvalued stocks and leave them to bag holders.
- They already shorted the large AI stocks so they will make money anyway.
- Money Shift: Institutions and funds moving from high tech to other sectors.
- Dow Jones must fill the gaps left during the strong uptrend - marked in circles.
- This shift will take some time pushing the stock market down, I already shifted my investments to other sectors, 50% cash and waiting.
Trade ideas

#DJI - 2000 Points Range PlayDate: 20-10-2025
#DJI - Current Price: $46,400.00
Pivot Point: $46,002.00 Support: $45,458.57 Resistance: $46,548.59
Upside Levels:
L1: $46,905.29 L2: $47,262.00 L3: $47,734.50 L4: $48,207.00
Downside Levels:
L1: $45,100.28 L2: $44,742.00 L3: $44,269.50 L4: $43,797.00
#TradingView #Nifty #BankNifty #DJI #NDQ #SENSEX #DAX #USOIL #GOLD #SILVER

DJI and beginning of correctionDJI has reached precalculated critical point and now I see the chance of good shake till 40-43k. Just to fill up the space.
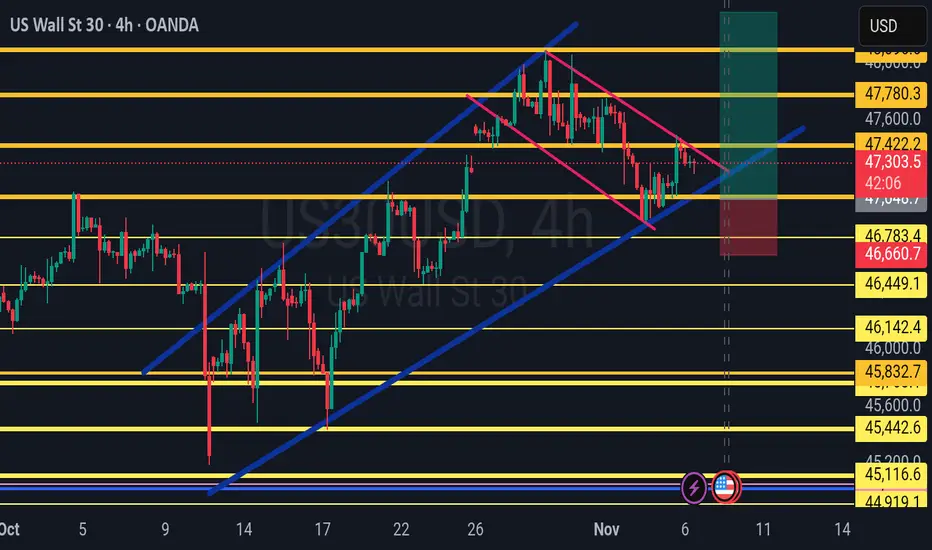
US30 Trade Set Up Nov 7 2025Indices remain under bearish pressure so i will only be looking for sells but first i want to see internal BSL or London high BSl swept first followed by 1m-5m IFVG/CISD to take sells down to 4h FVG and lower SSL levels

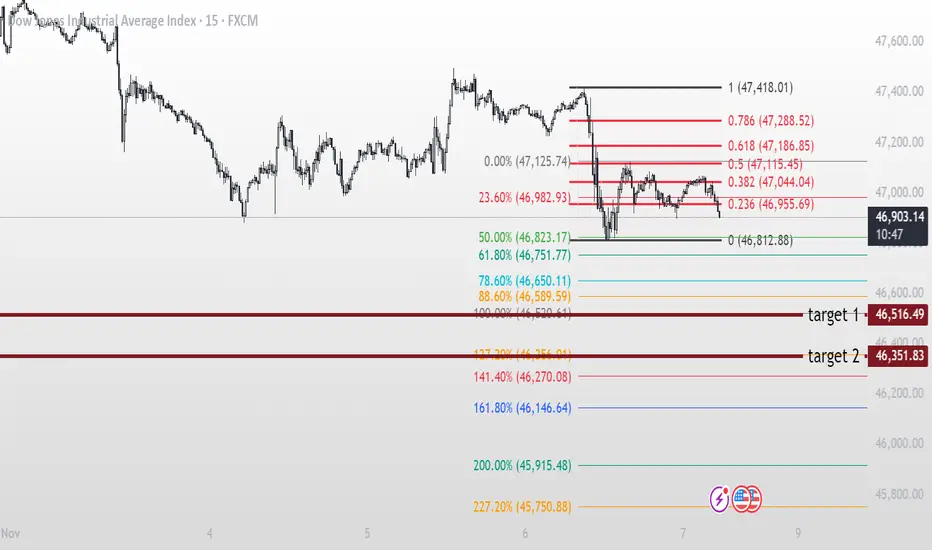
Could the Dow Jones continue to correct?
Hi everyone
I think if the 78.6 Fibonacci level is broken, we will probably reach the 1 Fibonacci level.
Do you think it is possible?
what do you think?
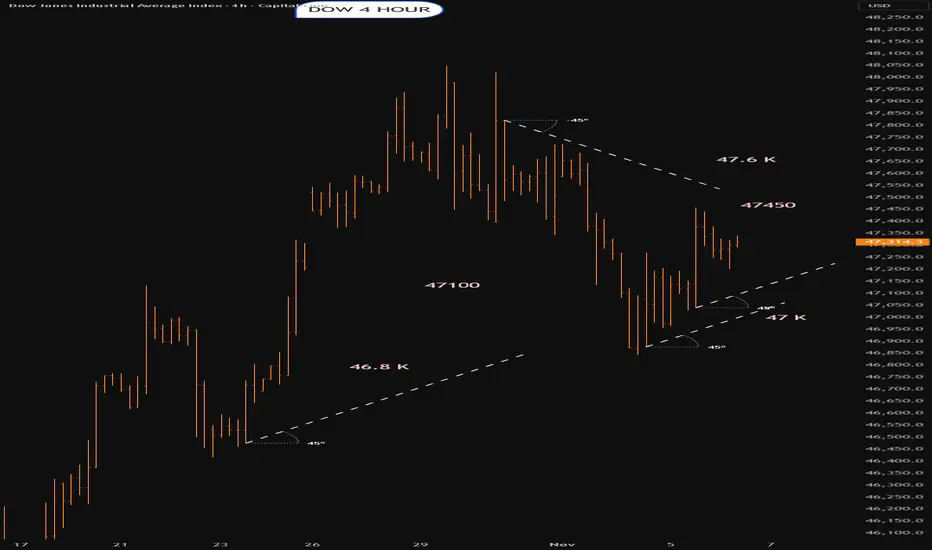
US30 – Bearish Bias Below 46910 | Targeting 46600–46410US30 – MARKET OUTLOOK | Bearish Bias Below 46910
US30 reversed from recent highs and stabilized below the pivot zone at 46910, signaling renewed bearish momentum in the short term.
🔽 Below 46910: Bearish continuation toward 46600 → 46410 → 46000.
🔼 Above 47100: Bullish recovery possible toward 47220 → 47450.
Pivot: 46910
Support: 46600 · 46410 · 46000
Resistance: 47100 · 47220 · 47450
US30 remains bearish while below 46910, but a confirmed 1H or 4H close above 47100 would shift bias to bullish continuation toward 47450.

DOW JONES INDUSTRIAL HIGH PROBABILITY SETUP SOON!!!🚨 DOW30 HIGH PROBABILITY BUY SETUP 🚨
* Here We Can See Clearly The Next Potential Moves For US30 Coming Hours/Days.
* Keep Your Eyes Close On Your Trading Positions.
* Happy PIP Hunting Traders.
FXKILLA.

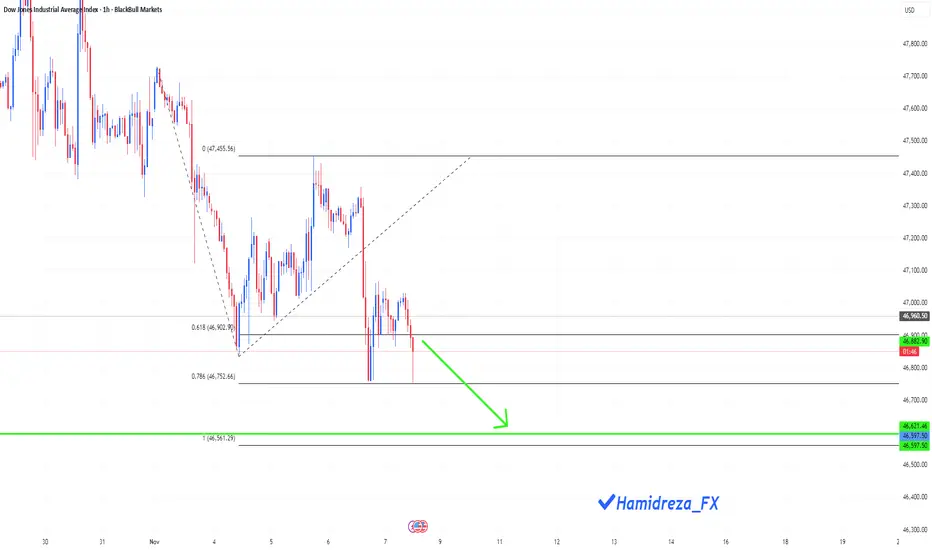
us30 short positionDow Jones is moving in a downtrend after breaking the last low.
It made a corrective move to the 50% Fibonacci level on the 15-min chart,
and retraced to the 0.61 Fibonacci level on the 1-hour chart.
It’s expected to continue toward the Fibonacci extension targets at 100% and 127%. 📉
check the trendThe uptrend is expected to continue to the specified resistance levels, then a continuation of the downtrend is likely.
If the index breaks through the 78.6% level, an uptrend is possible.

BUY NOW US30!!!!!US30 made a strong price rejections off my poi after a wild moves in the market yesterday am looking forward to see price made a strong pull back up to 48k trend is still bullish we just closed a gap without taking out our internal structure lows....

US30 Risky Short!
HI,Traders !
#US30 is growing now
But a horizontal resistance
Level of 47513.8 from where
We will be expecting a local
Pullback and a local move down !
Comment and subscribe to help us grow !

US 30Preferably suitable for scalping and accurate as long as you watch carefully the price action with the drawn areas.
With your likes and comments, you give me enough energy to provide the best analysis on an ongoing basis.
And if you needed any analysis that was not on the page, you can ask me with a comment or a personal message.
Enjoy Trading ;)

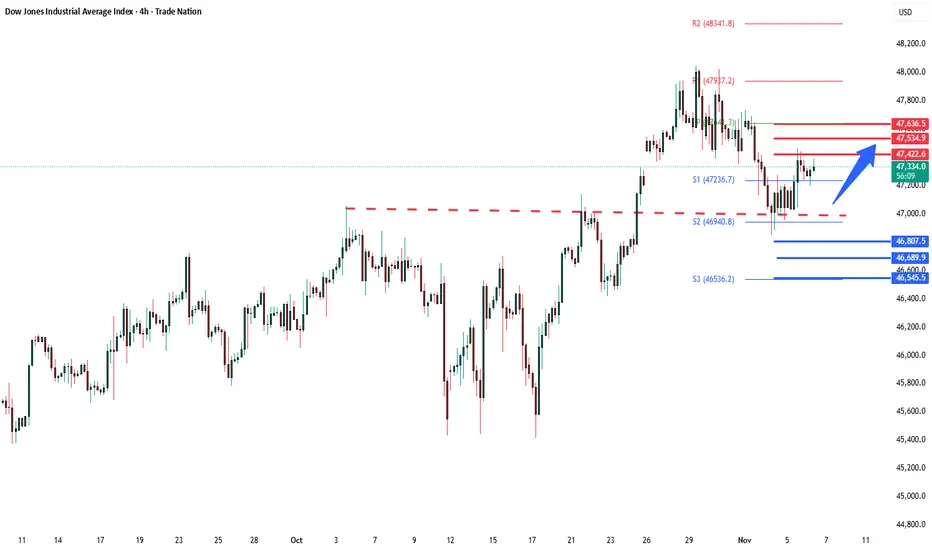
Dow Key Trading levels Key Support and Resistance Levels
Resistance Level 1: 47433
Resistance Level 2: 47534
Resistance Level 3: 47636
Support Level 1: 46807
Support Level 2: 46690
Support Level 3: 46545
This communication is for informational purposes only and should not be viewed as any form of recommendation as to a particular course of action or as investment advice. It is not intended as an offer or solicitation for the purchase or sale of any financial instrument or as an official confirmation of any transaction. Opinions, estimates and assumptions expressed herein are made as of the date of this communication and are subject to change without notice. This communication has been prepared based upon information, including market prices, data and other information, believed to be reliable; however, Trade Nation does not warrant its completeness or accuracy. All market prices and market data contained in or attached to this communication are indicative and subject to change without notice.
US30 Trade Set Up Nov 6 2025Price is bullish making HH/HL on the 1h and BOS of the Asia range so i will want to see price come to sweep SSL and/or tap into 1h FVG to then make 1m-5m IFVG/CISD to target PDH

DOW JONES HIGH PROBABILITY SETUPS SOON!!!🚨 DOW30 HIGH PROBABILITY SELL/BUY SETUP 🚨
* Here We Can See Clearly The Next Potential Moves For US30 Coming Hours/Days.
* Keep Your Eyes Close On Your Trading Positions.
* Happy PIP Hunting Traders.
FXKILLA.

US30 – Correction Toward 47100 | Next Leg Up Toward 47920US30 – MARKET OUTLOOK | Bullish Bias Above 47100
US30 is showing a mild bearish correction after facing resistance near 47460, but the broader structure remains bullish while price holds above 47100.
🔼 Above 47460: Bullish continuation toward 47750 → 47920 → 48200.
🔽 Below 47100: Bearish correction possible toward 46920 → 46600.
Pivot: 47430
Support: 47100 · 46920 · 46600
Resistance: 47750 · 47920 · 48200
US30 stays bullish while above 47100, but a confirmed close below this level could trigger a short-term bearish correction toward 46920.

Dow into the open.Thursday 6th NovemberCould go either way
Lets see what happens
Trend is up
Plenty of rez
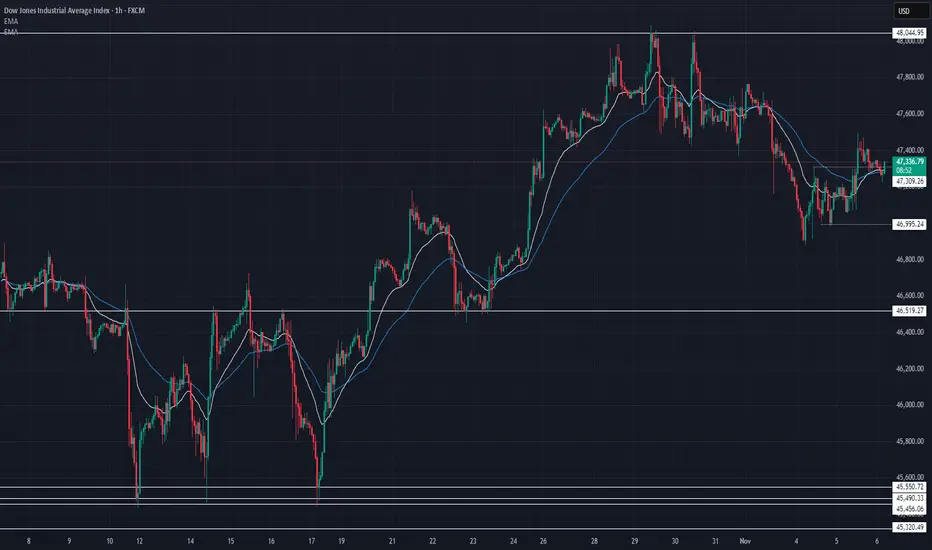
US30 Technical Breakdown – 11/06/2025📍 US30 Technical Breakdown – 11/06/2025
US30 is showing some early signs of stabilization after yesterday’s dip 🔄 Buyers stepped in near 47,000 to defend key support, pushing price slightly above EMAs — hinting at a potential short-term recovery.
📊 Market Behavior:
🔹 Rejection from 48,000 still holding strong
🔹 Bounce from 47,000 → short-term higher low forming
🔹 EMAs flattening → indecision phase before next move
📌 Key Levels:
🔹 Resistance:
47,400 → intraday EMA cap
47,650 → minor supply zone
47,900–48,000 → key psychological resistance
🔹 Support:
47,000 → major short-term demand
46,520 → strong structure level
45,550 → key swing low zone
🧠 Bias:
Neutral to mildly bullish ⚖️
⬆️ Above 47,400 → potential push toward 47,650–47,900
⬇️ Below 47,000 → momentum shifts back to bears
US30 LONG SETUP Price is looking to test 48.000 again after a strong correction that pushed it back to 47. region. Healthy support around 47 has been met on point with the 50% fib level. Strong push back to 48 is promising.
US30 BUY WITH LIMIT ORDER!!!!!US30 made a strong rejections off the order block zone am going to be positioning for a buy entry on the pull back in the inside bar candle on the buy zone i marked....

Dow Challenges 4-Year ResistanceFrom a monthly perspective, and filtering out short-term noise using the line chart, the Dow’s price action has been contracting since its bullish rebound from the 2020 lows, with overbought momentum previously recorded in November 2024 and April 2021.
This setup highlights the potential for long-term reversal risks near the upper boundary — specifically along the trendline connecting consecutive higher highs from November 2021 through November 2024.
If the trend extends beyond the 48,000 resistance, further advances could target 48,400 and 49,000, with 51,000 seen as an extreme projection before another major correction phase.
Conversely, a confirmed hold below 46,900 would indicate renewed pressure, potentially driving prices toward 46,600 and 46,200, where a technical rebound could occur.
If not, a deeper retracement toward the 45,000 region (previous significant resistance of 2025) may emerge.
Written by Razan Hilal, CMT

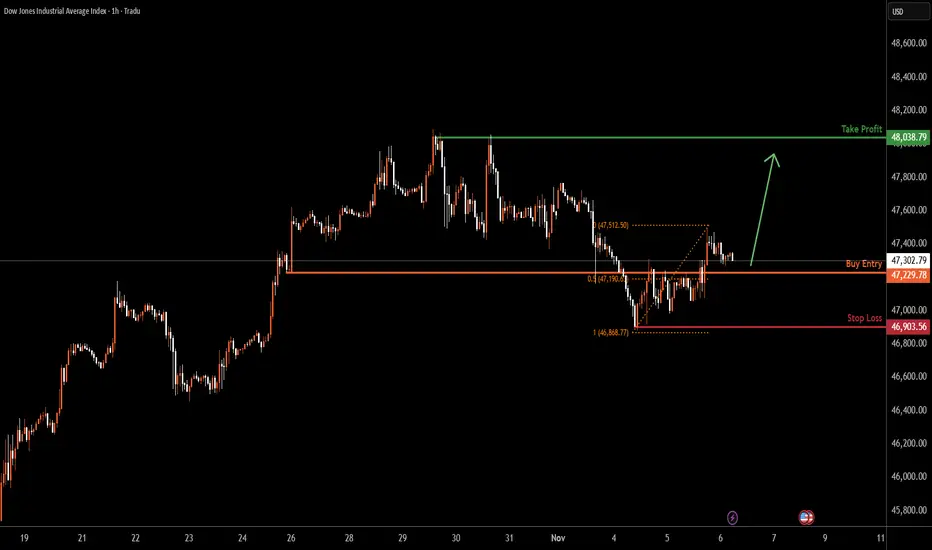
US30 H1 | Bullish Bounce Off 50% Fibonacci SupportUS30 is falling towards the buy entry at 47,229.78, whichis an overlap support that aligns witht he 50% Fibonacci retracement and could bounce from this level to the upside.
Stop loss is at 46,903.56, which is a swing low support.
Take profit is at 48,038.79, which is a multi swing high resistance.
Stratos Markets Limited (tradu.com ):
CFDs are complex instruments and come with a high risk of losing money rapidly due to leverage. 68% of retail investor accounts lose money when trading CFDs with this provider. You should consider whether you understand how CFDs work and whether you can afford to take the high risk of losing your money.
Stratos Europe Ltd (tradu.com ):
CFDs are complex instruments and come with a high risk of losing money rapidly due to leverage. 70% of retail investor accounts lose money when trading CFDs with this provider. You should consider whether you understand how CFDs work and whether you can afford to take the high risk of losing your money.
DOW JONES recovered and is looking for a High at 48500.Exactly 2 weeks ago (October 22, see chart below), we gave a strong Buy Signal on Dow Jones (DJI), as the index had already initiated the new Bullish Leg of its 6-month Channel Up and quickly hit our 47700 Target:
That trading plan included a 2nd Target as well at 48500, which represented a +7.50% rise from the October 10 Low, which was a Higher Low for the Channel Up on its 1D MA50 (blue trend-line).
As Target 1 was on the 1.382 Fibonacci extension, the recent pull-back was technically expected as the sequence was similar to those of August 22 - September 02 among others. As you can see, all minor pull-backs that took place within this Channel Up, hit the 4H MA100 (red trend-line) and rebounded. Major ones found support lower on the 1D MA50, as did the October 10 Low.
Since the index hit yesterday its 4H MA100 and is rebounding today, the Bullish Leg remains valid and on the medium-term can reach our final 48500 Target.
-------------------------------------------------------------------------------
** Please LIKE 👍, FOLLOW ✅, SHARE 🙌 and COMMENT ✍ if you enjoy this idea! Also share your ideas and charts in the comments section below! This is best way to keep it relevant, support us, keep the content here free and allow the idea to reach as many people as possible. **
-------------------------------------------------------------------------------
💸💸💸💸💸💸
👇 👇 👇 👇 👇 👇
