Dollar Index (DXY): New Bullish Wave Confirmed?!
Here a quick follow-up for my recent idea for Dollar Index.
The price retested a recently broken major horizontal structure cluster
and even went below that with a bearish trap.
A rising trend line was respected as a strong vertical support
and we see a bullish continuation now.
I think that we can expect a rise at least to 99.3 level now.
❤️Please, support my work with like, thank you!❤️
Trade ideas

GC1 & DXY Daily Trade SetupsIn this update we review the recent price action in Gold & Dollar Index futures contracts and identify the next high-probability trading opportunities and price objectives to target. To review today's video analysis, click here!


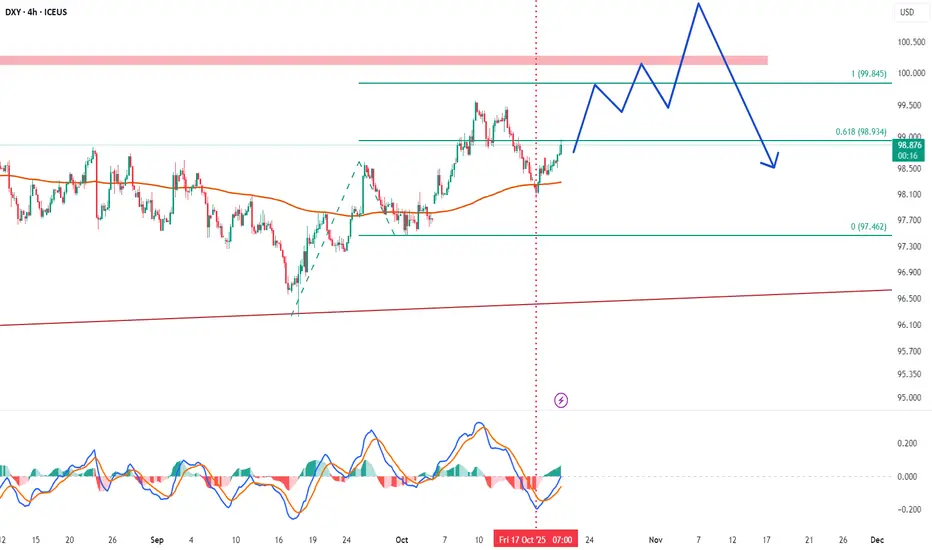
US Index is getting stronger and ready to climb the 100.149 markAfter rebounding from the 97.45 support zone, DXY is regaining strength above the 200 EMA, showing short-term bullish momentum. However, the broader price structure bearish strength will take over.
The MACD is currently showing a bullish crossover from oversold levels, supporting the ongoing corrective move to the upside. Once the index approaches the resistance region, momentum could begin to fade, leading to a potential bearish reversal.
Resistance Zone: 99.80, 100.50 and ultimate 100.14
Immediate Resistance: 98.93 followed by 99.84
Support Levels: 97.46 and 96.87 trendline support
DOLLAR INDEX- WEEKLY TIMEFRAME ANALYSIS We're looking at the U.S. Dollar Index (DXY) on the weekly timeframe, and what’s happening here can be broken down step-by-step:
---
🔍 1. Overall Structure
The chart shows a major downtrend that started after the last high around 110.176.
Since then, price has made a series of lower highs and lower lows, confirming bearish momentum.
---
🧭 2. Current Price Action (Recent Weeks)
Current price: 98.816
Recent low: 96.218
You can see a base forming between 96.2 – 99.0, which looks like a potential accumulation zone.
Price has bounced off that 96.2 support, showing buyers are defending that level.
---
📊 3. What It Means
The long red candles earlier show strong bearish control (USD weakening).
But now, the smaller green candles and wicks indicate loss of bearish momentum — sellers are no longer as aggressive.
This often hints that institutions might be building long positions for a potential correction or reversal.
---
🧩 4. Key Technical Levels
Support Zone: 96.00 – 97.00 → where buyers stepped in.
Resistance Zone: 100.00 – 101.50 → the next test area for price.
If price breaks above 99.50–100.00 and holds, that confirms bullish continuation toward 101 – 103.
But if it rejects again near 99.50 and drops below 97.00, expect further bearish continuation toward 95.00 or even 93.50.
---
💡 5. Institutional Insight
Given the prolonged drop:
Smart money could be accumulating USD longs around the 96 – 98 range.
They typically buy when retail traders still expect further decline — so this could be an early reversal phase.
---
🧭 6. Summary
Direction Status Key Levels Signal
Long-Term Trend Bearish 110 → 96 Still dominant
Medium-Term Accumulation 96 – 99 Possible reversal forming
Short-Term Bullish Attempt 99 – 101 Needs breakout to confirm
🟦 Institutional Buy Zone (96.0 – 98.0)
This blue region represents institutional accumulation.
Large players (smart money) began building long positions here after a long decline.
The repeated rejection wicks around 96.2–97.5 indicate strong buying interest and liquidity absorption.
This zone acts as a major support area — any retest into it could trigger renewed bullish reactions.
---
🟥 Institutional Sell Zone (100.0 – 101.5)
The red zone marks institutional distribution or short positioning.
Historically, price rallies into this area have been met with strong rejection, suggesting liquidity grabs before downside continuation.
This zone now serves as a major resistance level, where sellers may re-enter.
---
⚖️ Interpretation
The current price (98.8) sits between these two zones — meaning DXY is at a decision point.
A break above 100.0–101.5 would confirm bullish strength, targeting 103–105.
But a rejection near 99–100 and fall below 97.0 would signal bearish continuation back toward 95.0–94.0.
---
🔍 Trading Insight
As long as DXY holds above 96.0–97.0, expect possible accumulation or reversal structure.
Institutions tend to use this stage to trap retail sellers, then push the market higher toward the sell zone.

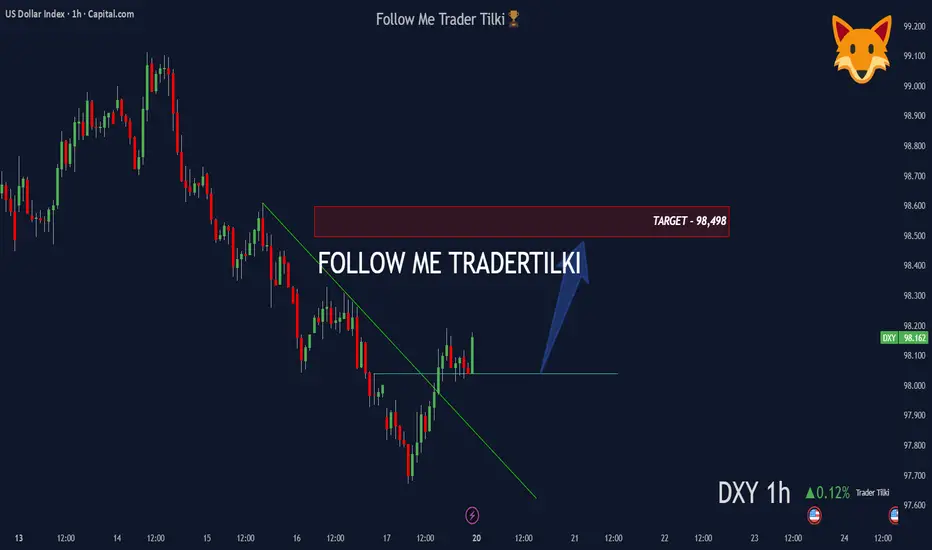
DXY 1H Analysis: Trendline Break with Rising Volume 📊 DXY – 1 Hour Analysis
Technical Outlook:
The trendline has been broken and rising volumes are drawing attention.
Based on this setup, my target level is: 98,498 🎯
Fundamental Analysis:
Recently, a White House economist stated that “we are not in any kind of economic war with China,” which reduced uncertainty in the markets and strengthened the dollar index.
In addition, FED policies, interest rate expectations, and tightening measures continue to be key factors supporting upward pricing on the DXY side.
🙏 Thanks to everyone who supports me with their likes.
King Dollar Returns: 98.190 Break💵 Dollar Breakout — Cross Assets Dumping Hard
The U.S. Dollar just flipped 98.190 CAP
After weeks of hesitation, DXY broke clean through the 98.190 daily imbalance, turning prior resistance into a launchpad — and global markets are reacting fast.
📊 Technical Frame
The daily imbalance that capped price now acts as fresh support, confirming a higher-timeframe breakout.
Momentum alignment across 4H and Daily frames signals a firm trend shift.
Upside magnet sits at 98.800–99.200, the next liquidity shelf where sellers may regroup.
🌐 Fundamental Pulse
Cross assets are dumping — EUR AND GBP all bleeding as Dollar strength tightens global liquidity.
Yields grind higher with markets reloading for extended Fed tightness.
Risk aversion and portfolio deleveraging are amplifying the move — capital is flowing back into USD safety.
🧭 Takeaway
The Dollar is back in charge. Above 98.190, the structure supports continuation toward 99+.
In this regime, correlation flips: strong Dollar = weak everything else.
When the Dollar breathes in, global markets exhale.

4th Quarter Madness In a world where there's a government shut down, technology is changing at a rapid pace, finances are changing at a rapid pace, I see short term bullishness for DXY. This daily chart outlines the year 2025 in quarters and as we sit in the 4th quarter, I see a reason to believe we will be bullish targeting the consolidation high sitting at 100.250 then the high found in Q2 which sits at 102 institutional level.

The next few months run Looking at the point of interest 🙄 price need to come and balance this move let's see maybe by end of this year or by January
US DOLLAR UPDATE DXYDXY — Rangebound but Firm: 98.19 Holds the Line
Dollar holds steady inside Friday’s range — a quiet coil before the macro rotation.
🧭 Context
The Dollar spent Monday trapped between Friday’s high and low, liquidating the upper wick at 98.190 before closing back within range.
Price currently sits near the 50% Fibonacci retracement (98.123), keeping the bullish range intact but unconfirmed.
The market is balanced, not directional — patience is the edge here.
📊 Technical Map
Structure: Price remains inside a clean bullish range with a volume imbalance still unfilled near 97.436.
Momentum: Mildly bullish but range-dependent — upward bias, no breakout confirmation yet.
Key Levels:
Support → 97.672 / 97.436
Pivot → 98.123
Resistance → 98.190 / 98.420
🌐 Fundamental Pulse
This week’s key drivers: PMI flash, GDP (Thu), and PCE inflation (Fri) — all high-impact data that will steer the Fed narrative.
Yields remain firm but cooling; risk appetite mixed as traders await fresh growth signals.
Without new inflation pressure, the Dollar likely stays rotational within its higher-timeframe band until late-week catalysts.
🎯 Plan
Primary: Avoid midrange noise. Best setups are at range extremes — 97.6 support and 98.2 resistance.
Execution Filter: Wait for volume expansion or 1H close confirmation before breakout engagement.
Alternative: Failure to hold 98.12 reopens imbalance toward 97.43; a break above 98.19 invites continuation to 98.4–98.6.
⚠️ Risk / Alt
Range = noise. Stay tactical. High-frequency trades only until volatility expands.
🧠 Mindset Pulse
“In dull markets, discipline is the premium asset — not conviction.”
Professionals don’t chase noise; they preserve readiness.

DxyThis is what I'm looking at on the DXY
A break and retest of trendline
Let's see how it plays but if we go above the black line which represents a zone then it's invalid
But for now I see a downward move
#breakandretest

DXYU.S Dollar Index
- Completed " 123 " Impulsive Waves
- Break of Structure
- Bullish Channel as an corrective pattern in Long Time Frame
- Fibonacci Level - 50.00% / 61.80%
- Fair Value Gap

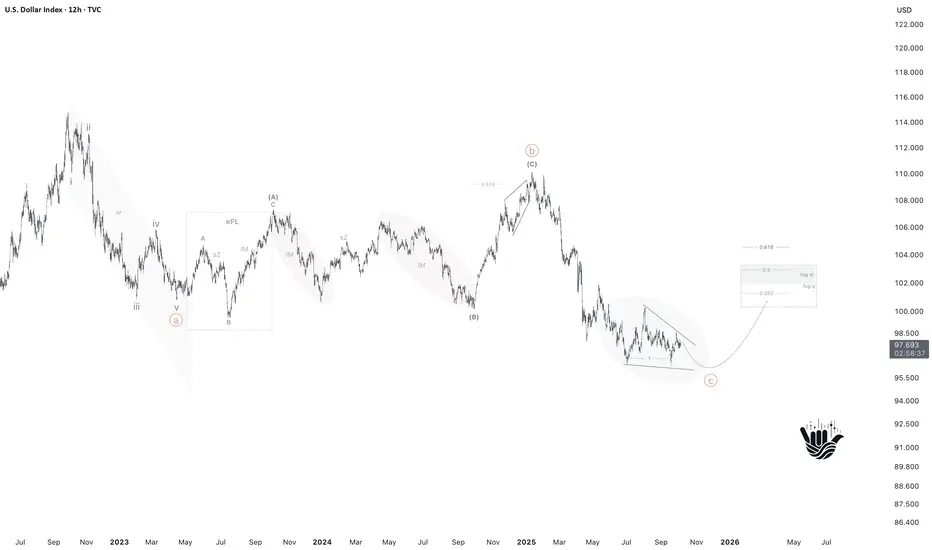
DXY: Last Dip Before Lift-Off?Previous roadmap played out well — time to refresh the view.
Global (1W)
TVC:DXY remains in an uptrend. Since 2008 we’ve built a textbook five-wave impulse.
Since 2022/2023 that impulse has been in correction — base read: a single zigzag (SimpleZ).
Base case: correction completes → trend resumes with new highs ahead.
Alternatives
Flat: push toward 114–115, then a deep pullback.
Double zigzag (W–X–Y): bounce first, then one more leg down.
Local (12H)
Finishing ABC where C likely prints an ending diagonal → expecting the down leg to terminate and a rising phase to begin (either corrective or impulsive).
Price Action
Imbalances below may still get tapped; we’re below a key level, but the core scenario is dollar strength ahead.
What’s your take? Which path do you favor — Base (new highs), Flat (114–115 then pullback), or W–X–Y (one more leg lower)?
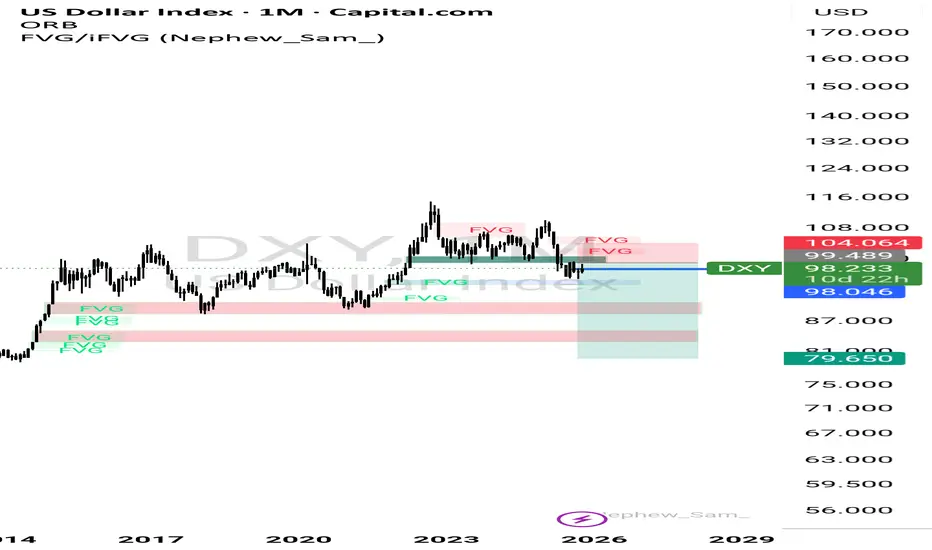
DXY AnalysisOn the weekly chart, the price has formed a new trading range. We mark it out and move down to the daily timeframe.
After the correction, the price reacted from an inefficiency zone, showing buyer interest.
At the moment, I’m considering two bullish scenarios:
1️⃣ An impulsive breakout of the daily FVG zone followed by an expansion of the current range.
2️⃣ A reaction from the FVG zone, then a sweep of Friday’s low, after which the price could resume its upward movement.
I see the second scenario as more likely, as it would allow the market to collect liquidity before continuing higher.

Bullish bounce?US Dollar Index (DXY) is falling towards the pivot and could bounce to the 1st resistance.
Pivot: 97.71
1st Support: 96.64
1st Resistance: 99.98
Disclaimer:
The above opinions given constitute general market commentary, and do not constitute the opinion or advice of IC Markets or any form of personal or investment advice.
Any opinions, news, research, analyses, prices, other information, or links to third-party sites contained on this website are provided on an "as-is" basis, are intended only to be informative, is not an advice nor a recommendation, nor research, or a record of our trading prices, or an offer of, or solicitation for a transaction in any financial instrument and thus should not be treated as such. The information provided does not involve any specific investment objectives, financial situation and needs of any specific person who may receive it. Please be aware, that past performance is not a reliable indicator of future performance and/or results. Past Performance or Forward-looking scenarios based upon the reasonable beliefs of the third-party provider are not a guarantee of future performance. Actual results may differ materially from those anticipated in forward-looking or past performance statements. IC Markets makes no representation or warranty and assumes no liability as to the accuracy or completeness of the information provided, nor any loss arising from any investment based on a recommendation, forecast or any information supplied by any third-party.

Forex weekly review: fundamental analysis I found myself feeling a little fed up during the week starting Monday 13 October, unable to form a strong confidence in the near term direction of the currencies. I felt lack a lack of US data is really starting to bite, central bank speakers didn't really tell us anything new, Mr trump's brokerage of peace in the middle east didn't create any 'risk on oomph'. All we were left with was snippets of headline news regarding China's reaction to 'tariff escalation', none of which I felt comfortable trading in either direction.
But, far be it for me to complain about a US government shutdown making my trading decisions more difficult. There are actual people wondering when their next day of work will be and if they will even have a job to go back to.
On a positive note, we did get a couple of catalysts moving the currencies, 'soft' employment data from the UK and Australia created momentum for potential short term trades, I say short term because the data was against the tide of 'hawkish interest rate rhetoric' from both countries.
Earnings season kicked of fairly positively, it may well be that the tech company earnings over the next couple of weeks will create our best opportunities in the absence of US data, but hopefully the shutdown will end before it comes to that.
I have read US CPI data will be reported at some point despite the shutdown, I'm unsure how relevant it will be considering it'll be old news.
The previous week's JPY euphoria (negative JPY) was unwound due to new LDP leader TAKACHI attempting to sound hawkish. Which leaves us with a cloud surrounding our two staple currencies, the USD (no data) and JPY (rate hike uncertainty).
Finally, the week ended with a bit of back and forth, concerns over the US banking sector created risk off sentiment, seeing the VIX rise to 28. But Mr Trump tempered the negativity with positive china comments.
I begin the new week without a clear bias, prepared to trade momentum with a catalyst in either direction.
On a personal note, it was a week of two AUD JPY trades, both stopped out. I stand by my AUD JPY long 'risk on' trade, especially as the stop loss was behind 1hr support. But I accept that Friday's AUD JPY short trade was a mistake, perhaps an attempt to pre-empted the market out of frustration, I tried to predict a risk off end to the week. A mistake, especially considering Mr Trump's positive china comments. And a reminder to myself to trade clear momentum with a catalyst. With that in mind, the time to trade to bank induced negativity would have been during Friday's Asian session.
Let's see what the new week brings.

Dxy long?This count is based on my assumptions so anything can happen not a trading or financial advice just for educational purposes only kindly do your own ta thanks trade with care good luck.

DXY SHORT FROM SUPPLY AREA|
✅DXY Price is retracing toward the supply level, where a reaction is likely once the imbalance gets filled. A rejection from this zone could confirm the retest before continuation lower toward the 98.30 target area. Time Frame 2H.
SHORT🔥
✅Like and subscribe to never miss a new idea!✅

DXY - Potential FutureAlthough there is a clear bearish channel (purple 1px lines), I believe this is not the true pattern and it will form a low on the orange rail, then go upwards to the top rail as capital flies to safety, before the real decline of the DXY begins.
TA is a mapping of a more complex system, we can use to navigate these charts, however its simplicity leads me to believe the market makers are capable of manipulating expectation while channels are still forming.
TA is a game between market maker (Gods of the markets) and individuals who use it. Therefore tricks etc.. apply.
Let's see.


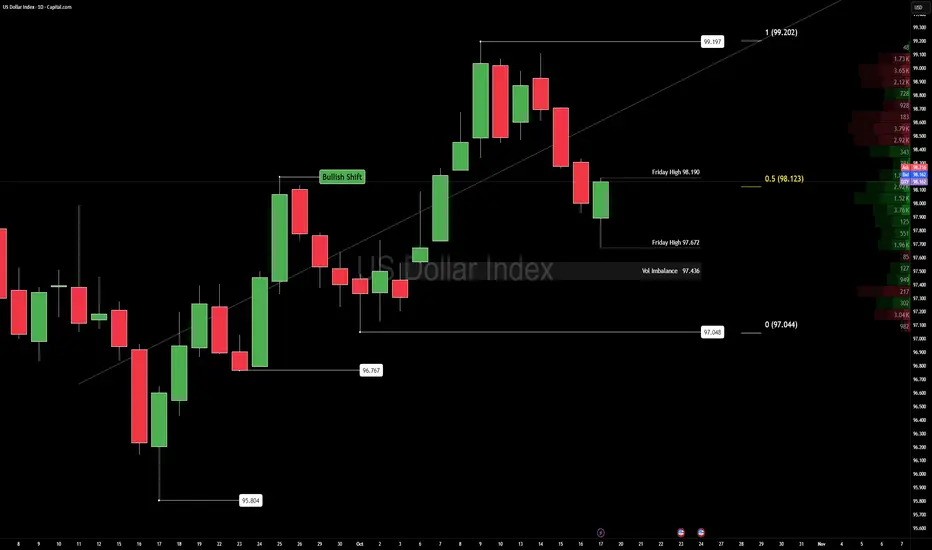
DXY — Between Balance and Breakout
Date: Sunday, October 19
Timeframe: Daily
Analyst: @CORE5DAN
Context
The U.S. Dollar Index holds a bullish daily range between 99.197 and 97.048, now sitting around the Fibonacci 50% retracement at 97.044.
Friday’s session formed a tight box — high 98.190, low 97.672 — showing compression inside balance conditions.
Price trades above mid-range, with a volume imbalance near 97.436 acting as a magnet for short-term rotation.
Key liquidity rests just below 97.700, and reactions there could define early-week direction.
Technical Map
• Structure: Short-term bullish, still inside a broader weekly bearish framework. Watch 97.436–97.700 — a clean reaction zone where imbalance and liquidity converge.
• Momentum: Range-bound bullish, confirming control but lacking expansion. A daily close above 98.190 opens the path toward the range high at 99.197.
• Volume: Imbalance remains unfilled — ideal for mean-reversion setups before any breakout impulse.
Fundamental Pulse (Week Ahead)
• Macro Drivers:
— US GDP advance data: key for growth tone.
— Core PCE inflation: the Fed’s favored inflation gauge.
— Fed speakers and PMIs: tone setters for November rate outlook.
• Yields:
— The 10-year sits near 4.6%.
— A push higher = bullish Dollar, stronger short-term flows.
— A pullback = potential consolidation across USD pairs.
• Global Flows:
— Mild rotation out of risk assets and emerging markets supports the Dollar.
— EURUSD and XAUUSD both reflect this hesitation near key supports.
Plan
Bias stays bullish in the short term, bearish in the long term.
We favor volume imbalance fills and reaction trades at 97.436–97.700 before re-evaluating structure.
If macro data or yield spikes support Dollar demand, expect continuation toward 98.190+.
Otherwise, a drift below 97.436 would signal distribution and confirm corrective pressure.
“Structure is the compass; sentiment is the weather.”
Mindset Pulse
“Authority comes from clarity, not prediction.”
Trade what’s confirmed — not what’s comfortable.
dxyOn a monthly time frame, if DXY closes above the local resistance, I'm gonna long with the monthly chart

Dollar Index Behavior in a Descending DiamondThe dollar index has made a very polite effort and has been fluctuating within the range I have drawn, and I think this effort will continue and continue its downward trend until the price range I have indicated in the image!
Time will tell if this claim is true!
Good luck...
