DXYWe are looking for the dollar to basically go for short term sells then long term buying opportunities as we are still inside the bullish structure
USDX trade ideas

DXY to call ECB's bluffThe broad based dollar index has held up well and the 200-day MA support level at 104.43 is keeping the dollar from further depreciation. The DXY is looking set to make another leg higher if the ECB serve markets with a rate cut this week.
The ECB, along with the Bank of England, has been very outspoken recently that they plan to diverge from the Fed’s monetary policy path and that their economies are almost at a point in which they can start cutting rates. This week provides the opportune time for the ECB to put their euros where their mouth is, but we can expect another strong dollar rally if they actually do…


DXY POTENTIAL REVERSAL WITH A BREAKOUTDXY is currently trading within an expanding channel. A potential reversal could occur if the price manages to break out bullishly from this structure and surpass the identified consolidation zone. However, if this breakout does not happen as anticipated, we might see a further decline or an extended period of consolidation.

DXY Minute: Even clowns get wearyAnd I assume that is true, because otherwise, DXY would be trading much lower. Whomever(s) are responsible for one of the nastiest price corrections I have seen are undoubtedly ready to throw in the towel, after wiping the paint off their faces, because deep down they know, they will have to deliver the dollars. Unfortunately, unless they are in that process as I write this, I foresee such delivery may be at a relatively high premium compared to price at which they sold them. This correction has almost every corrective pattern ever outlined by the foremost Elliot Wave practitioners that I have read. There are triangles, irregular b waves, and ultimately, combo after combo or JUNK. The price action here tests the limits of what can happen without obviating the practice of tracking price waves. For the first time in the 2 years I have been trading using EW technicals, I have been ready at times to say that price has been hijacked, or that Elliot was wrong. Nonetheless, in the end, sometimes by a pip or two, price has barely adhered to the panacea of rarities in the world of Elliot Wave Theory, which is why I say "ugliest" and why I call the traders of the JUNK "clowns." Either they lost a ton, or they attempted to orchestrate destruction of the markets fabric, both things that only clowns would do. However, in the end, I maintain my faith in humanity and nature, and believe that what could follow will be just deserts, even for clowns. A swift move to the 109 area seems appropriate because this correction is maxed, and I imagine, even the clowns are weary. We do not control price, alone...the market does. And what the market wants, it gets. Price needs one more Intermediate wave to new highs, ideally into the extension area, which will likely breach the larger 1.0, due to price destruction that has taken place. This is a cycle b wave, by my count, and as soon as it completes, all the haters can have the dollar crash they so desire. I will observe, as usual.
Best, Cuz

Strong Bounce Off SupportDXY is trading within an ascending channel. if DXY holds this level and heads to the top of the channel, then BTC will breakdown from the ascending channel it is trading in (you can see my post). There is no chance both of them will continue to rise toward the top of the channels. either btc will break down or dxy, and so far dxy has shown more strength.

US Dollar at Key SupportThe USD decline settled into key support last week at 104.15/36- a region defined by the December high-close (HC), the 38.2% Fibonacci retracement of the December rally, the measured head-and-shoulders objective of the April breakdown, and the 200-day moving average. Note uptrend slope support also converges on this threshold over the next few weeks and the immediate focus is possible price inflection off this zone with the bears vulnerable while above.
Topside resistance is eyed at the 105 -handle and is backed 105.58/63 – a region defined by the 61.8% retracement of the recent decline, the January 2023 high, and the March high-day close (HDC). A breach / close above this threshold would be needed to suggest a more significant low was registered last week and shift the focus back towards the yearly HDC at 106.37 .
A break / close below this key support zone would suggest a larger trend reversal is underway with such a scenario exposing the 2023 yearly open at 103.49 . Key longer-term support remains unchanged at 102.75/99 .
Bottom line : The US Dollar is responding to confluent uptrend support with the weekly opening-range taking shape just above- looking for evidence of an exhaustion low here. From at trading standpoint, a good region to reduce short-exposure / lower protective stops – losses should be limited to 104.15 IF the broader uptrend is to remain viable. Ultimately, a close above 105.63 would be needed to mark resumption of the broader uptrend.
Michael Boutros
@MBForex

USD INDEX IS BULLISH Doing a technical analysis and using fundamental analysis I'm predicting a bullish move for USD index. Analyzing major pairs like EURUSD, I see EUR wearing against USD.

SELL USD INDEXSELL POSITION USD INDEX
ENT : 104.928
SL : 105.075
TP : 104.63
1- to day news + sentiment
2- please trail sl after 10 pips

DXY - still bullish Advice:
Follow your own analysis and intuition to understand the direction and potential areas. My analyses are good and most often determine the correct price direction. However, do not copy my trades exactly! I have a very effective risk management strategy, and most of the time, I avoid losses, achieving either a break-even or 50% of the risk. I carefully manage reentry positions. Regardless of what I do and how I manage my trades, I am always very strict with the percentage of risk I allocate per area and with securing profits.

USD come back strongerI have 2 alternative movement for DXY. Looking for bullish an impulsive move upwards.

DXYToday's market is focused on the April PCE inflation report, which could influence future Fed rate cuts. Better-than-expected CPI data earlier this month has lifted investor hopes for a favorable PCE outcome. Major indices show mixed movements, with gains in technology and communication services sectors

DXY death-slide but will Regain value. BTC BULLS up next Smart money red trendline different from regression trend. Smart money contraction shows a stop at POI means downtrend then BTC moves up in BULL POWER.
DXY same pattern but in different volume

Levels discussed on 31st May Livestream31st May
DXY: Core PCE release today, Looking for reaction at 105 resistance
NZDUSD: Sell 0.6070 SL 20 TP 75
AUDUSD: Buy 0.6660 SL 20 TP 50
USDJPY: Buy 157.10 SL 30 TP 80
GBPUSD: Sell 1.2680 SL 20 TP 75 (Hesitation at 1.2345)
EURUSD: Sell 1.0780 SL 20 TP 50
USDCHF: Sel 0.9090 SL 20 TP 65
USDCAD: Buy 1.3690 SL 30 TP 40
Gold: Slight downside from 2338 to 2328

Levels discussed on 29th May livestream29th May
DXY: Weakness. Break below 104.50 could trade down to 104 support, (hesitate at 104.20)
NZDUSD: Buy 0.6150 SL 20 TP 35
AUDUSD: Buy 0.6680 SL 20 TP 45
USDJPY: Buy 156.80 SL 30 TP 60
GBPUSD: Buy 1.2770 SL 30 TP 50
EURUSD: Buy 1.0865 SL 25 TP 30
USDCHF: Buy 0.9160 SL 30 TP 65
USDCAD: Buy 1.3665 SL 30 TP 60
Gold: If price breaks 2345 could head lower to 2330

Potential gartley pattern DXY Dxy currently expanding into the 4th leg of the macro bearish Elliot wave
Looking for distro within the green lines then retrace down for the last drop down to the 5th leg
Elliot wave combined with harmonics perspective
Dxy expansion means
Usdxxx pairs are bullish
Xxxusd pairs are bearish (yes that includes crypto ;)
Then once dxy makes the lower high it will start to retrace meaning
Usdxxx pairs will be bearish
Xxxusd pairs will be bullish ( and yes that means crypto :)

Two Scenarios for DXYUS dollar index is currently sitting on a major falling trend line and in my opinion there are two paths ahead:
- The Blue Arrow : Bulls gain control and move the index to the red rectangle.
- The Red Arrow : Bears breaks this trend line and price falls to the green rectangle.
Good luck!

Levels discussed on 30th May Livestream30th May
DXY: Retracing, needs to stay above 105 support to maintain bullish, could retest 105.50
NZDUSD: Sell 0.6070 SL 20 TP 65
AUDUSD: Buy 0.6615 SL 25 TP 55
USDJPY: Buy 156.90 SL 40 TP 80
GBPUSD: Sell 1.2680 SL 20 TP 75 (Hesitation at 1.2345) (Double bottom opportunity)
EURUSD: Sell 1.0780 SL 20 TP 50
USDCHF: Buy 0.9105 SL 20 TP 40
USDCAD: Sell 1.3710 SL 25 TP 50
Gold: Likely to range between 2330 and 2350

Potential bearish drop?US Dollar Index (DXY) has reacted off the pivot which has been identified as an overlap resistance and could fall to the 1st support.
Pivot: 105.11
1st Support: 104.57
1st Resistance: 105.49
Risk Warning:
Trading Forex and CFDs carries a high level of risk to your capital and you should only trade with money you can afford to lose. Trading Forex and CFDs may not be suitable for all investors, so please ensure that you fully understand the risks involved and seek independent advice if necessary.
Disclaimer:
The above opinions given constitute general market commentary, and do not constitute the opinion or advice of IC Markets or any form of personal or investment advice.
Any opinions, news, research, analyses, prices, other information, or links to third-party sites contained on this website are provided on an "as-is" basis, are intended only to be informative, is not an advice nor a recommendation, nor research, or a record of our trading prices, or an offer of, or solicitation for a transaction in any financial instrument and thus should not be treated as such. The information provided does not involve any specific investment objectives, financial situation and needs of any specific person who may receive it. Please be aware, that past performance is not a reliable indicator of future performance and/or results. Past Performance or Forward-looking scenarios based upon the reasonable beliefs of the third-party provider are not a guarantee of future performance. Actual results may differ materially from those anticipated in forward-looking or past performance statements. IC Markets makes no representation or warranty and assumes no liability as to the accuracy or completeness of the information provided, nor any loss arising from any investment based on a recommendation, forecast or any information supplied by any third-party.


Dollar index long viewThe dollar index is well positioned to initiate new a one-month bullish consolidation. With the Fibonacci setting, both previous pullbacks were stopped near the 61.8% level, and additional support for the bullish option is the growing trend line. Based on that, we can expect the dollar index to start a new bullish consolidation with the main target at 107.00.

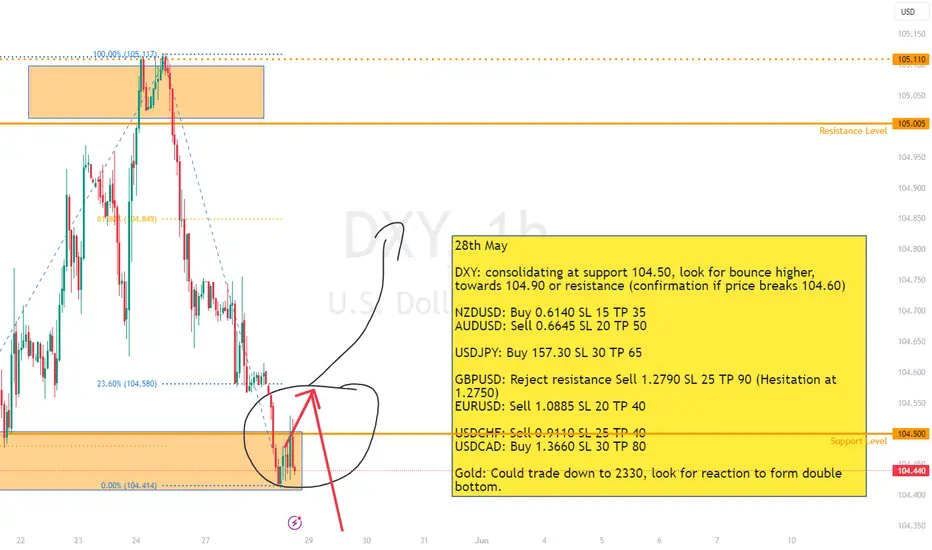
Levels discussed during livestream 28th May28th May
DXY: consolidating at support 104.50, look for bounce higher, towards 104.90 or resistance (confirmation if price breaks 104.60)
NZDUSD: Buy 0.6140 SL 15 TP 35
AUDUSD: Sell 0.6645 SL 20 TP 50
USDJPY: Buy 157.30 SL 30 TP 65
GBPUSD: Reject resistance Sell 1.2790 SL 25 TP 90 (Hesitation at 1.2750)
EURUSD: Sell 1.0885 SL 20 TP 40
USDCHF: Sell 0.9110 SL 25 TP 40
USDCAD: Buy 1.3660 SL 30 TP 80
Gold: Could trade down to 2330, look for reaction to form double bottom.
DXY - Are You Ready?📈Hello TradingView Family / Fellow Traders. This is Richard, also known as theSignalyst.
📉 DXY has been overall bullish trading within the rising channel marked in red.
Currently, it is undergoing a correction phase, and approaching the lower bound of the channel.
Moreover, it is retesting a strong demand zone highlighted in orange.
🏹 Thus, the highlighted blue circle is a strong area to look for buy setups as it is the intersection of the orange demand and lower red trendline.
📚 As per my trading style:
As #DXY is hovering around the blue circle zone, I will be looking for bullish reversal setups (like a double bottom pattern, trendline break , and so on...)
📚 Always follow your trading plan regarding entry, risk management, and trade management.
Good luck!
All Strategies Are Good; If Managed Properly!
~Rich
