Trade ideas

US DOLLAR AnalysisRespect the Higher Low: The Quiet Power of an Uptrend
U.S. Dollar Index (DXY) | 23 Oct 2025 | Pre–New York Session Outlook
By Daniel Fadeley
The U.S. Dollar continues to show a bullish bias, with higher lows forming consistently across both the weekly and daily structure. This ongoing strength keeps the broader tone positive for USD, while EURUSD and GBPUSD remain under cross-asset pressure.
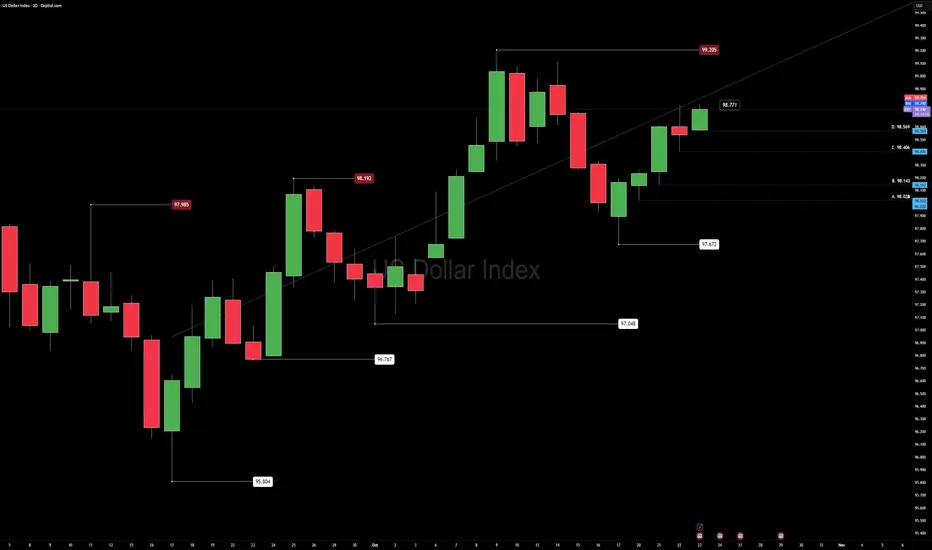
We’re currently operating inside a bullish range with 97.672 as the range low and 99.205 as the range high.
Context
Momentum favors the dollar as buyers continue defending each pullback. If this month’s bullish structure holds, the market could confirm a longer-term upward phase.
However, conditions are slightly extended on Fibonacci sequence levels, suggesting reduced reward-to-risk for new swing positions until a clean retest offers better value.
Technical Map
Price took out yesterday’s high (98.771) and approaches the range ceiling at 99.205.
Volatility remains elevated through the week, and intraday momentum supports buy-the-dip behavior while daily lows continue to hold.
For cross-assets, this structure implies ongoing pressure on major USD pairs while the dollar holds above recent higher lows.
Fundamental Outlook
The week ahead features several key macro events:
U.S. GDP advance data
Core PCE inflation release
Multiple Federal Reserve speakers
Ongoing U.S. government funding discussions
Impact lens:
Yields rising → typically strengthens USD and tightens global liquidity.
Yields easing → can relieve pressure on risk assets such as equities and crypto.
Liquidity trends show ETF inflows slowing and capital rotating defensively, consistent with cautious macro positioning.
Plan
Current outlook remains bullish within range, focusing on position trades from defended lows and short-term rotational setups during volatility spikes.
Patience near 99.205 is key — a clean breakout with retest would confirm continuation; failure there could mean another controlled rotation inside the range.
Mindset
“Structure builds confidence. Clarity builds control.”
In fast markets, the goal is not prediction but preparation — follow structure, protect capital, and let confirmation lead conviction.
Educational use only — not financial advice.
Follow @CORE5DAN for calm, data-driven analysis and weekly structure lessons.
— CORE5DAN
Institutional Logic. Modern Technology. Real Freedom.
DXY Forming a Strong Base – Reversal Ahead?U.S. Dollar Index TVC:DXY – Daily Analysis
After a long downtrend, the Dollar Index seems to be forming a strong base at the bottom, as highlighted by multiple bounces from the same support zone. This area has been acting as a reliable floor, preventing further downside.
Currently, the price has also broken above the descending trendline, showing early signs of strength. If the price holds above this breakout, we could see a move toward the 100–101 zone, which is the next key resistance area.
However, if the price dips back below the trendline, a retest of the base zone near 97.00 could take place before any potential continuation higher.
Summary: DXY is showing a potential reversal structure. A sustained move above the trendline could confirm the start of a stronger bullish phase.
DYOR, NFA
Thanks for reading! Appreciate your support and engagement 🙏

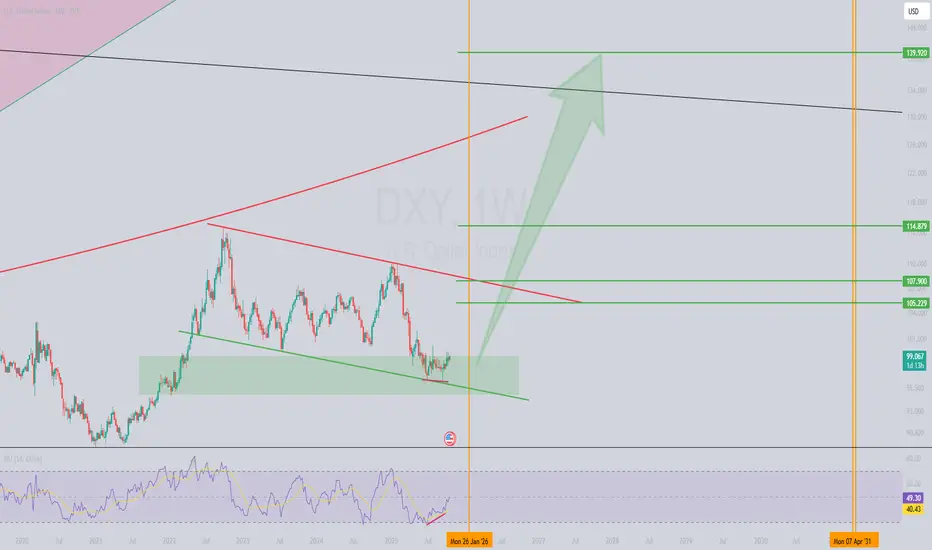
DXY: Bullish Setup Brewing at Key Weekly Support!The US Dollar Index (DXY) is showing a compelling setup on the weekly timeframe! 📈 The price has reached a critical support zone between 99.120 and 94.802. This level also aligns with the lower boundary of a descending channel, adding confluence to this high-probability zone.
🔍 Key Technical Observations:
Bullish Divergence: A clear bullish divergence has formed between the price and the RSI indicator, signaling potential exhaustion of sellers and a possible trend reversal.
Channel Support: The price is testing the lower trendline of the descending channel, a spot where buyers have stepped in before.
Support Zone: The 99.120–94.802 range is a high-value area for accumulation, making it a prime spot for a bounce.
📡 What’s Next?Technically, the DXY looks poised for a bullish reversal. However, global macroeconomic events and fundamental news (like Fed decisions or geopolitical developments) will play a crucial role in confirming this move. Keep an eye on upcoming economic data releases! 📅
What do you think of this setup? Are you bullish on DXY, or waiting for more confirmation? Drop your thoughts below! 👇
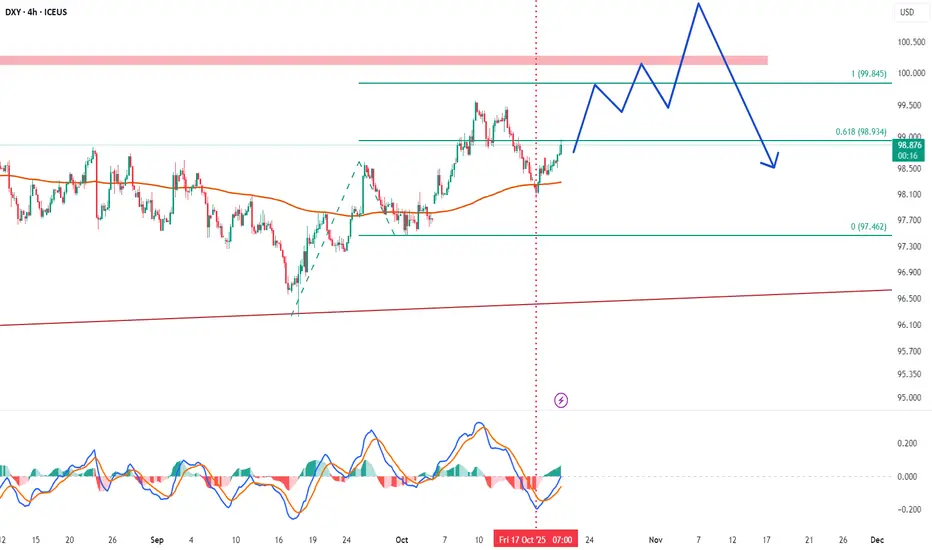
DXY AnalysisDXY remains within a broader uptrend, but currently shows signs of short-term consolidation after facing resistance near 99.05.
A head & shoulder pattern is likely to be forming, with right shoulder in the making, if successfully created, will force the prices lower towards the neckline near S2 (98.5)
Overall, the index is likely to retest support around 98.60–98.50 (S1–S2) before a potential rebound if the uptrend line holds.
Although, a break below 98.50 could trigger deeper correction toward 98.20, while sustained strength above 99.25 may resume bullish momentum.

DXY-POSSIBLE LONG [SWING]BULLISH MONTHLY RESEPECT CANDLES.
Daily Orderflow
Daily context Area
LTF entry preferably H1
TARGET buyside of the trend
APPLY RISK MANAGEMENT

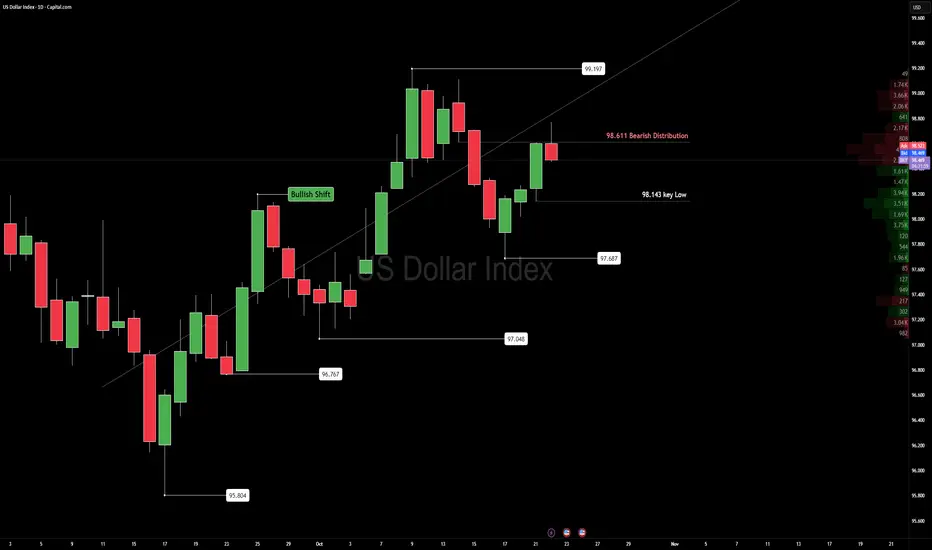
DXY UpdateDXY — Reaction at 98.611 Distribution Zone
The U.S. Dollar Index met firm resistance near 98.611, the same Bearish distribution area that capped momentum last week.
Price remains inside a wide daily range but shows the first sign of cooling after a strong stretch higher.
Below sits 98.143, the line that that changes chart bearish. Until then We are still good.
Acceptance under that level would confirm a structure shift and open space for continued rotation lower.
Upcoming jobless claims and Fed remarks may decide which side gains conviction.
For now, this is a market balancing inventory — not trending, just redistributing.
Trade confirmation, not anticipation.
Key levels:
98.611 — Distribution cap
98.143 — Structural pivot
— Institutional Logic. Modern Technology. Real Freedom.
DXY OutlookWhen the Dollar Rises, Crypto Feels the Heat 💵🔥
The DXY (U.S. Dollar Index) tracks how strong the dollar is against other currencies. When it climbs, it means investors are moving money into safe assets like cash or U.S. bonds — and away from risky plays like Bitcoin and altcoins.
A stronger dollar makes crypto more expensive globally, reduces demand, and usually pushes prices down.
When the DXY cools off, liquidity flows back into risk assets — that’s when crypto tends to bounce.
In short:
📈 DXY up = crypto down
📉 DXY down = crypto up
Watch the DXY; it’s one of the best macro indicators for crypto moves.

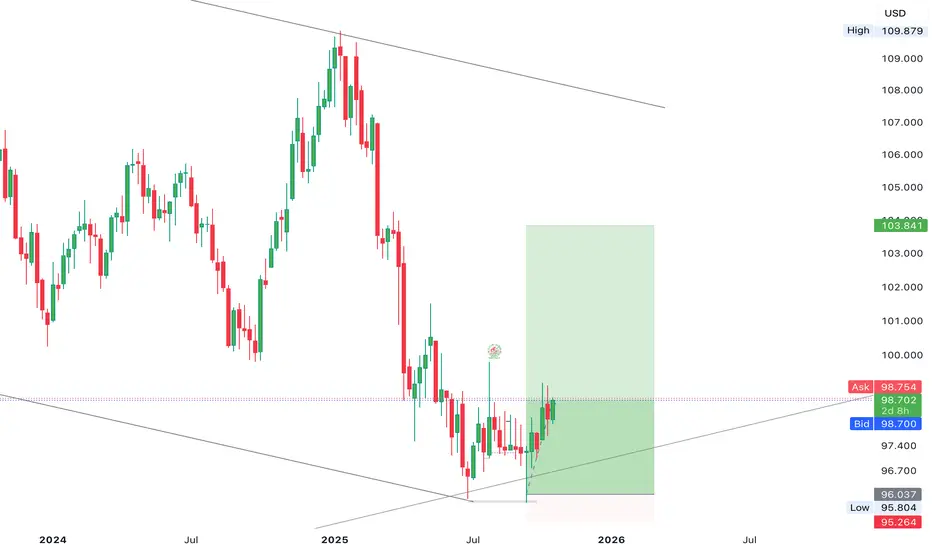
The DXY continues to establish a solid base for bullish recoveryThe DXY continues to establish a solid base for bullish recovery around the 98.000 level, aiming to mitigate toward the 103.000 region. This development highlights a potential shift in market momentum as dollar strength begins to rebuild. follow for more insights ,comment and boost idea
DXY Double Top Rejection Still At PlayThe M formation I spoke about a week ago is still at play, and the gap I anticipated will get filled is still wide open.
I am bearish on DXY until confirmations to go bullish contradict my bias.

The Dollar Index (DXY) AnalysisDXY is holding above 98.75 (Fib 61.8%), indicating a short-term bullish bias after bouncing from the recent low near 98.15.
Momentum remains positive, with the index approaching resistance at R1: 99.00 and a potential upside target toward R2: 99.25–99.40 zone.
RSI near 60 reflects moderate bullish momentum without being overbought.
Bollinger mid-band (around 98.75) acts as near-term support, keeping intraday sentiment positive.
Bias stays bullish above 98.75, but rejection near 99.25 may trigger minor profit booking.
Fundamental Factors
- Foreign institutional investors have restarted accumulating US stocks:
- October witnessed the highest purchase of US stocks by non-US investors
- Total purchase made = +$22 billion so far in October, the most in last 4 months.
- Marking the 3rd consecutive monthly inflow, after negative inflows reported in July.
- Meanwhile, foreign holdings of US equities rose to a record $20 trillion last quarter.
It seems everyone again wants to enter the US stock market.
Remember 2 Things:
1. When stock market (riskier market) attracts demand =>> The safe havens (Gold) "might" get weaker
2. For Foreign Investors, to invest in US Stock markets =>> first needs to purchase US Dollar =>> US Dollar Strengthens
- When US Dollar strengthens =>> Gold weakens

DXY Trade Plan 22/10/2025Dear Traders,
The 99–99.200 zone is a very important area for the Dollar Index. Based on this, if the price breaks above this zone, we will enter sell positions on USD pairs. However, if a bearish candle appears, we will enter buy positions for a 80–100 pip move.
Regards,
Alireza!


US Dollar: Looking For Higher Prices This WeekWelcome back to the Weekly Forex Forecast for the week of Oct 20-24th.
In this video, we will analyze the following FX market: USD Dollar
The USD had a bearish week overall, but Friday's bullish close may hint towards the bias for this week. Potentially, we may see some continuation to the upside over the next couple of days.
Look at how price pulled back into the Daily Demand. This is a great place for the retracement to end ... and the new bullish leg to begin.
Wait for confirmations... like the failure of the -FVG. Then buys become valid.
Enjoy!
May profits be upon you.
Leave any questions or comments in the comment section.
I appreciate any feedback from my viewers!
Disclaimer:
I do not provide personal investment advice and I am not a qualified licensed investment advisor.
All information found here, including any ideas, opinions, views, predictions, forecasts, commentaries, suggestions, expressed or implied herein, are for informational, entertainment or educational purposes only and should not be construed as personal investment advice. While the information provided is believed to be accurate, it may include errors or inaccuracies.
I will not and cannot be held liable for any actions you take as a result of anything you read here.
Conduct your own due diligence, or consult a licensed financial advisor or broker before making any and all investment decisions. Any investments, trades, speculations, or decisions made on the basis of any information found on this channel, expressed or implied herein, are committed at your own risk, financial or otherwise.

DXY - TRADING WEEK 20 - 24 OCTOBER 2025This week i expect the DXY to pullback to the 98.800/98.900 level of resistance and consequencially selloff to the 97.700 - 97.600 level of support closing the gap created two weeks ago, I don't exclude a lower test in the 97.000 area, this will be up to the strenght of the USD coming out from data at the start of the week.
The test of 97.700 - 97.600 could provide excellent trading setup and entries for GOLD, EUR USD, USD CHF and related USD pairs.
I expect the index to rally up and achieve the 99.600 and 100.200 level of resistance.
Please like/comment/share this idea - i will follow up through the week.
Wishing you all a great trading week!

DXY Rejection from Premium Zone | USD Weakness AheadHello Billionaires!!
The US Dollar Index (DXY) is showing signs of exhaustion after tapping into the FVG + Order Block within the premium zone.
We’ve also confirmed a Market Structure Shift (MSS) to the downside — signaling a potential short-term reversal.
📊 Analysis Breakdown:
FVG & OB confluence near 98.90 🧠
MSS indicates bearish intent ⚡
Targeting buying zone around 98.30 area 🩸
This scenario supports USD weakness, aligning with potential bullish moves in EURUSD, GBPUSD, and AUDUSD.
💡 Trade Plan:
DXY → Short bias below OB
USDJPY → Short setup favored
EURUSD, GBPUSD, AUDUSD → Look for long setups
Smart Money likely engineered liquidity above before pushing price lower to rebalance inefficiency.

Dollar Index (DXY): New Bullish Wave Confirmed?!
Here a quick follow-up for my recent idea for Dollar Index.
The price retested a recently broken major horizontal structure cluster
and even went below that with a bearish trap.
A rising trend line was respected as a strong vertical support
and we see a bullish continuation now.
I think that we can expect a rise at least to 99.3 level now.
❤️Please, support my work with like, thank you!❤️

GC1 & DXY Daily Trade SetupsIn this update we review the recent price action in Gold & Dollar Index futures contracts and identify the next high-probability trading opportunities and price objectives to target. To review today's video analysis, click here!


US Index is getting stronger and ready to climb the 100.149 markAfter rebounding from the 97.45 support zone, DXY is regaining strength above the 200 EMA, showing short-term bullish momentum. However, the broader price structure bearish strength will take over.
The MACD is currently showing a bullish crossover from oversold levels, supporting the ongoing corrective move to the upside. Once the index approaches the resistance region, momentum could begin to fade, leading to a potential bearish reversal.
Resistance Zone: 99.80, 100.50 and ultimate 100.14
Immediate Resistance: 98.93 followed by 99.84
Support Levels: 97.46 and 96.87 trendline support
DOLLAR INDEX- WEEKLY TIMEFRAME ANALYSIS We're looking at the U.S. Dollar Index (DXY) on the weekly timeframe, and what’s happening here can be broken down step-by-step:
---
🔍 1. Overall Structure
The chart shows a major downtrend that started after the last high around 110.176.
Since then, price has made a series of lower highs and lower lows, confirming bearish momentum.
---
🧭 2. Current Price Action (Recent Weeks)
Current price: 98.816
Recent low: 96.218
You can see a base forming between 96.2 – 99.0, which looks like a potential accumulation zone.
Price has bounced off that 96.2 support, showing buyers are defending that level.
---
📊 3. What It Means
The long red candles earlier show strong bearish control (USD weakening).
But now, the smaller green candles and wicks indicate loss of bearish momentum — sellers are no longer as aggressive.
This often hints that institutions might be building long positions for a potential correction or reversal.
---
🧩 4. Key Technical Levels
Support Zone: 96.00 – 97.00 → where buyers stepped in.
Resistance Zone: 100.00 – 101.50 → the next test area for price.
If price breaks above 99.50–100.00 and holds, that confirms bullish continuation toward 101 – 103.
But if it rejects again near 99.50 and drops below 97.00, expect further bearish continuation toward 95.00 or even 93.50.
---
💡 5. Institutional Insight
Given the prolonged drop:
Smart money could be accumulating USD longs around the 96 – 98 range.
They typically buy when retail traders still expect further decline — so this could be an early reversal phase.
---
🧭 6. Summary
Direction Status Key Levels Signal
Long-Term Trend Bearish 110 → 96 Still dominant
Medium-Term Accumulation 96 – 99 Possible reversal forming
Short-Term Bullish Attempt 99 – 101 Needs breakout to confirm
🟦 Institutional Buy Zone (96.0 – 98.0)
This blue region represents institutional accumulation.
Large players (smart money) began building long positions here after a long decline.
The repeated rejection wicks around 96.2–97.5 indicate strong buying interest and liquidity absorption.
This zone acts as a major support area — any retest into it could trigger renewed bullish reactions.
---
🟥 Institutional Sell Zone (100.0 – 101.5)
The red zone marks institutional distribution or short positioning.
Historically, price rallies into this area have been met with strong rejection, suggesting liquidity grabs before downside continuation.
This zone now serves as a major resistance level, where sellers may re-enter.
---
⚖️ Interpretation
The current price (98.8) sits between these two zones — meaning DXY is at a decision point.
A break above 100.0–101.5 would confirm bullish strength, targeting 103–105.
But a rejection near 99–100 and fall below 97.0 would signal bearish continuation back toward 95.0–94.0.
---
🔍 Trading Insight
As long as DXY holds above 96.0–97.0, expect possible accumulation or reversal structure.
Institutions tend to use this stage to trap retail sellers, then push the market higher toward the sell zone.

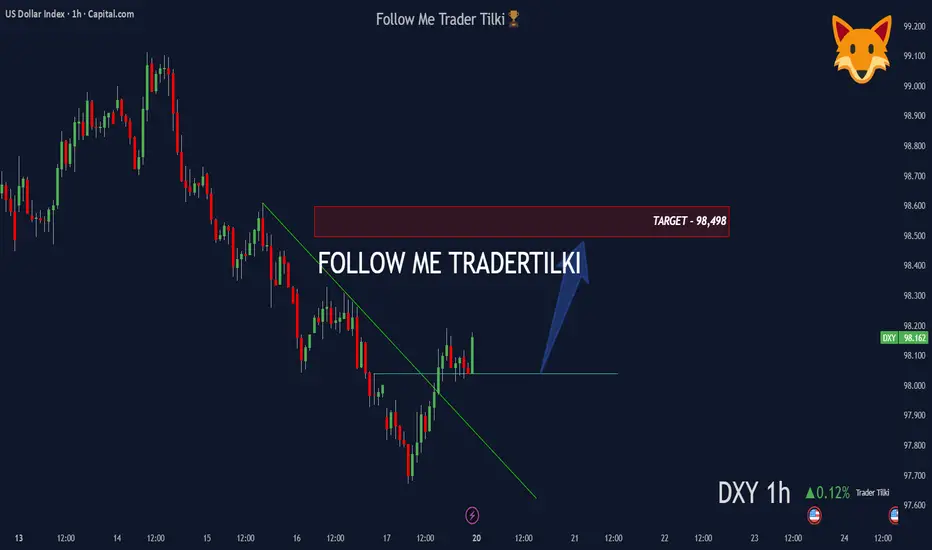
DXY 1H Analysis: Trendline Break with Rising Volume 📊 DXY – 1 Hour Analysis
Technical Outlook:
The trendline has been broken and rising volumes are drawing attention.
Based on this setup, my target level is: 98,498 🎯
Fundamental Analysis:
Recently, a White House economist stated that “we are not in any kind of economic war with China,” which reduced uncertainty in the markets and strengthened the dollar index.
In addition, FED policies, interest rate expectations, and tightening measures continue to be key factors supporting upward pricing on the DXY side.
🙏 Thanks to everyone who supports me with their likes.
King Dollar Returns: 98.190 Break💵 Dollar Breakout — Cross Assets Dumping Hard
The U.S. Dollar just flipped 98.190 CAP
After weeks of hesitation, DXY broke clean through the 98.190 daily imbalance, turning prior resistance into a launchpad — and global markets are reacting fast.
📊 Technical Frame
The daily imbalance that capped price now acts as fresh support, confirming a higher-timeframe breakout.
Momentum alignment across 4H and Daily frames signals a firm trend shift.
Upside magnet sits at 98.800–99.200, the next liquidity shelf where sellers may regroup.
🌐 Fundamental Pulse
Cross assets are dumping — EUR AND GBP all bleeding as Dollar strength tightens global liquidity.
Yields grind higher with markets reloading for extended Fed tightness.
Risk aversion and portfolio deleveraging are amplifying the move — capital is flowing back into USD safety.
🧭 Takeaway
The Dollar is back in charge. Above 98.190, the structure supports continuation toward 99+.
In this regime, correlation flips: strong Dollar = weak everything else.
When the Dollar breathes in, global markets exhale.
