DOLLAR INDEX (DXY): Consolidation Ahead of FOMC
Dollar Index weakens ahead of FED rate decision today.
The market formed a symmetrical triangle pattern on a daily.
A breakout of one of its boundaries after an interest rate decision
announcement will accurately indicate a future direction of the market.
❤️Please, support my work with like, thank you!❤️
I am part of Trade Nation's Influencer program and receive a monthly fee for using their TradingView charts in my analysis.
Trade ideas

DXY FRGNT Daily Forecast -Q4 | W44 | D29| Y25 |📅 Q4 | W44 | D29| Y25 |
📊 DXY FRGNT Daily Forecast
🔍 Analysis Approach:
I’m applying Smart Money Concepts, focusing on:
Identifying Points of Interest on the Higher Time Frames (HTFs) 🕰️
Using those POIs to define a clear trading range 📐
Refining those zones on Lower Time Frames (LTFs) 🔎
Waiting for a Break of Structure (BoS) for confirmation ✅
This method allows me to stay precise, disciplined, and aligned with the market narrative, rather than chasing price.
💡 My Motto:
"Capital management, discipline, and consistency in your trading edge."
A positive risk-to-reward ratio, paired with a high win rate, is the backbone of any solid trading plan 📈🔐
⚠️ Losses?
They’re part of the mathematical game of trading 🎲
They don’t define you — they’re necessary, they happen, and we move forward 📊➡️
🙏 I appreciate you taking the time to review my Daily Forecast.
Stay sharp, stay consistent, and protect your capital
— FRNGT 🚀
TVC:DXY

DXY: DECODED ANALYSIS My technical analysis on DXY: It currently shows a bullish trend on the quarterly, monthly, and weekly charts. The target is $111.68.
This information is for educational purposes only.
Always DYOR (Do Your Own Research).
Note: TradingView does not allow showing certain charts that go beyond technical analysis.

DXY relative perf. to predict market tops.Using intermarket analysis. During expensive markets, demand for US dollar grows - and often it correlates with stock market tops. Step further - we can use intermarket analysis of DXY/SPX. Look for trend break out and Higher Lows in the structure. ✅

US Dollar Coiled for Breakout ahead of the FedThe US Dollar is coiling just below resistance, with DXY trading within a contractionary range ahead of tomorrow’s FOMC rate decision. The index rallied nearly 3.5% off the yearly lows before stalling, with price consolidate within the first weekly range of October heading into the highly anticipated FOMC rate decision tomorrow. The focus is on a breakout of this range to drive the next directional move as we head into the close of the month.
Weekly support rests with the 61.8% retracement of the mid-September rally / 2025 low-week close (LWC) at 97.50/65. A break / weekly close below this threshold would threaten downtrend resumption toward the 2021 high at 96.94 and the June low at 96.37 – both areas of interest for possible downside exhaustion / price inflection IF reached. The next major technical consideration rests 94.65/97- a key pivot-zone defined by the March 2020 swing low, the 78.6% retracement of the 2021 advance, and the 100% extension of the 2023 decline. Look for a larger reaction there IF reached.
Weekly resistance is eyed at the 2023 low / 209 high / April low-week close (LWC) at 99.59/67 with bearish invalidation just higher at the 2024 low / LWC at 100.16/42- a breach / weekly close above this threshold is needed to suggest a more significant low is in place / a larger trend reversal is underway. Subsequent resistance objectives eyed at the 38.2% retracement of the yearly range at 101.55 and the 52-week moving average at 101.98.
Bottom line: The U.S. Dollar is coiled just below resistance, and the focus is on a breakout of the 97.50-99.66 range for guidance heading into the close of the month. From a trading standpoint, losses should be limited to 97.50 IF the Dollar is higher on this stretch with a breach above 100.41 needed to validate a more significant breakout in price.
-MB

DXY RISING TRENDLINE BELOW|LONG|
✅DXY Price is respecting the rising trendline, showing consistent higher lows. Expect bullish continuation toward the target zone after the retest, as price seeks to rebalance inefficiency left from prior impulsive moves. Time Frame 7H.
LONG🚀
✅Like and subscribe to never miss a new idea!✅

DXY Approaching 98.900 — Weak Labor Market Could Push Fed DovishHey Traders, in today’s trading session we’re monitoring DXY for a potential selling opportunity around the 98.900 zone.
The index continues to trade within a descending channel and is currently in a correction phase, approaching the upper boundary near 98.900, which aligns with channel resistance.
Fundamentals: Recent data continues to show signs of a weakening U.S. labor market, with job growth slowing and unemployment ticking higher. This softening backdrop increases pressure on the Federal Reserve to adopt a more dovish stance in upcoming meetings, potentially weighing further on the dollar.
Next move: Watching for bearish confirmations around the 98.900 zone — rejection here could resume the broader downtrend.
💬 What’s your outlook on the Fed’s next move? Drop your thoughts in the comments!

DXY Long-Term big surprise revealed by Gold! Hi Guys,
I've been doing some research on the DXY and Gold charts and I've been reading news headlines
For the past 20 years and trying to link it with both DXY and Gold charts and I've found out
Some interesting facts that literally flipped the market upside down.
So I pointed each even with the corresponding candle and I would love to know what do you guys
Think about this so feel free to comment and share your opinion on what's really going on behind
The scenes.

DXY FRGNT Daily Forecast -Q4 | W44 | D28| Y25 |📅 Q4 | W44 | D28| Y25 |
📊 DXY FRGNT Daily Forecast
🔍 Analysis Approach:
I’m applying Smart Money Concepts, focusing on:
Identifying Points of Interest on the Higher Time Frames (HTFs) 🕰️
Using those POIs to define a clear trading range 📐
Refining those zones on Lower Time Frames (LTFs) 🔎
Waiting for a Break of Structure (BoS) for confirmation ✅
This method allows me to stay precise, disciplined, and aligned with the market narrative, rather than chasing price.
💡 My Motto:
"Capital management, discipline, and consistency in your trading edge."
A positive risk-to-reward ratio, paired with a high win rate, is the backbone of any solid trading plan 📈🔐
⚠️ Losses?
They’re part of the mathematical game of trading 🎲
They don’t define you — they’re necessary, they happen, and we move forward 📊➡️
🙏 I appreciate you taking the time to review my Daily Forecast.
Stay sharp, stay consistent, and protect your capital
— FRNGT 🚀
TVC:DXY

DXY — The Market UpdateDXY — The Market Therapist’s Take
🧭 Context
The U.S. Dollar sits between 98.613 and 98.143 — the high and low from Tuesday, October 21.
That zone still controls the market’s psychology.
Price is absorbing every order above and below it — a quiet accumulation phase that looks like chaos, but isn’t.
The question isn’t “where next,” it’s “who’s still trapped inside.”
📐 Technical Map
Daily structure remains bullish range, while weekly and monthly dynamic maps stay bearish.
Four months straight, price has rotated through the same rhythm — collecting both buy and sell stops across cross-assets.
It’s not indecision; it’s design.
If 98.613 breaks, we open expansion higher.
If 98.143 gives way, next pivot becomes the target.
🌐 Fundamental Pulse
The dollar’s not crashing — it’s unwinding its old story.
For two years, the script was simple: high yields, safe haven, strong America.
Now, traders are rewriting the plot.
Prediction markets show a 40% chance of a U.S. recession in 2025.
Rate-cut expectations jumped from one to three.
Meanwhile, Germany’s €500 B infrastructure and defense plan signals a new fiscal identity for Europe — and money follows that kind of momentum shift.
📊 Volume & Order Flow Map
Volume tools mark 98.197 as the month’s Volume Key line.
Close above it, and the bias turns bullish — potential for expansion.
Close below, and we remain in a controlled range.
This is no accident — it’s liquidity engineering.
Volume flow reveals the intention behind every candle.
🎯 Plan
Price symmetry holds mid-range, trapping traders chasing both sides.
In this kind of terrain, in-and-out execution is survival, not fear.
Stay inside structure until the market itself declares direction.
The currency game isn’t random — it’s orchestration.
When you can’t hold bias, hold discipline.
When price hides intent, follow volume.
Institutional Logic. Modern Technology. Real Freedom.

DXY FRGNT Daily Forecast -Q4 | W44 | D27| Y25 |📅 Q4 | W44 | D27| Y25 |
📊 DXY FRGNT Daily Forecast
🔍 Analysis Approach:
I’m applying Smart Money Concepts, focusing on:
Identifying Points of Interest on the Higher Time Frames (HTFs) 🕰️
Using those POIs to define a clear trading range 📐
Refining those zones on Lower Time Frames (LTFs) 🔎
Waiting for a Break of Structure (BoS) for confirmation ✅
This method allows me to stay precise, disciplined, and aligned with the market narrative, rather than chasing price.
💡 My Motto:
"Capital management, discipline, and consistency in your trading edge."
A positive risk-to-reward ratio, paired with a high win rate, is the backbone of any solid trading plan 📈🔐
⚠️ Losses?
They’re part of the mathematical game of trading 🎲
They don’t define you — they’re necessary, they happen, and we move forward 📊➡️
🙏 I appreciate you taking the time to review my Daily Forecast.
Stay sharp, stay consistent, and protect your capital
— FRNGT 🚀
TVC:DXY

DXYBearish momentum expected as we on a strong supply zone and the next move would be our strong demand zone. Just price action as cot report is not out for two weeks now.

Bullish reversal?The US Dollar Index (DXY) is reacting off the pivot which aligns with the 50% Fibonacci retracement and could bounce from this level to the major resistance.
Pivot: 98.55
1st Support: 98
1st Resistance: 99.53
Disclaimer:
The above opinions given constitute general market commentary, and do not constitute the opinion or advice of IC Markets or any form of personal or investment advice.
Any opinions, news, research, analyses, prices, other information, or links to third-party sites contained on this website are provided on an "as-is" basis, are intended only to be informative, is not an advice nor a recommendation, nor research, or a record of our trading prices, or an offer of, or solicitation for a transaction in any financial instrument and thus should not be treated as such. The information provided does not involve any specific investment objectives, financial situation and needs of any specific person who may receive it. Please be aware, that past performance is not a reliable indicator of future performance and/or results. Past Performance or Forward-looking scenarios based upon the reasonable beliefs of the third-party provider are not a guarantee of future performance. Actual results may differ materially from those anticipated in forward-looking or past performance statements. IC Markets makes no representation or warranty and assumes no liability as to the accuracy or completeness of the information provided, nor any loss arising from any investment based on a recommendation, forecast or any information supplied by any third-party.

DXY Bullish move 99.00 (Readmore)...💹 #DXY Analysis (1H Timeframe) 💹
🟢 Bullish Momentum Building Up!
Price showing strong buying pressure from the key support zone at 99.00 📈
🎯 Technical Targets:
1️⃣ 99.300 – First target
2️⃣ 99.500 – Second target
📊 As long as price holds above 99.00, bullish bias remains intact.
#DXY #USDIndex #Forex #TechnicalAnalysis #PriceAction #TradingSetup 🚀

U.S Dollar IndexDXY
- Bearish Channel as an corrective pattern in Short Time Frame
- RSI - Divergence
- Order Block
- Demand Zone
- Change of Characteristics

DOLLAR INDEX The Dollar Index (DXY) is a measure of the value of the US dollar relative to a basket of major foreign currencies, including the euro, Japanese yen, British pound, Canadian dollar, Swedish krona, and Swiss franc. It provides an overall indication of the dollar’s strength or weakness in the global foreign exchange market.
How the Dollar Index Works
The index is weighted based on trade volumes between the US and these countries, with the euro having the largest weight (~57.6%).
A rising Dollar Index means the US dollar is strengthening against the basket currencies; a falling index indicates dollar weakness.
Impact of Interest Rates and Bond Yields on the Dollar Index
Interest Rates:
Higher US interest rates generally attract foreign capital because they offer better returns on dollar-denominated assets, increasing demand for the US dollar and pushing the Dollar Index higher. Conversely, lower rates can weaken the dollar.
Bond Yields:
US Treasury yields are closely linked to interest rates. Rising bond yields attract yield-seeking investors from around the world, boosting demand for the dollar. Higher yields improve the dollar’s appeal relative to other currencies, often driving the Dollar Index up.
Rate Differentials:
The key driver is the differential between US interest rates/bond yields and those of other major economies. If US rates or yields rise more than those abroad, the dollar tends to strengthen.
The next Federal Open Market Committee (FOMC) meeting is scheduled for October 28-29, 2025. The key federal funds rate decision will be announced on October 29, typically at 2:00 PM Eastern Time, followed by a press conference led by Fed Chair Jerome Powell.
Regarding the Dollar Index (DXY), FOMC rate decisions have significant effects:
If the Fed cuts rates, as widely expected at this meeting due to a weakening labor market and inflation concerns, the US dollar tends to weaken against the basket of major currencies, putting downward pressure on the Dollar Index.
A dovish tone from the Fed, signaling further rate cuts ahead, typically extends dollar weakness.
Conversely, if the Fed surprises with a pause or hawkish stance, the dollar could strengthen, supporting an increase in the Dollar Index.
Market consensus currently leans toward a 25 basis point cut, implying a likely bearish impact on the Dollar Index near the announcement.
Summary
The Dollar Index gauges the overall value of the US dollar versus a currency basket.
Rising US interest rates and bond yields increase demand for US dollar assets, pushing the Dollar Index higher.
International rate differentials are key to understanding dollar strength or weakness in global forex markets.
This interrelationship influences trade, capital flows, and monetary policy impacts across economies..
trade direction based on structure.
the last analysis on dollar /gold inverse reaction was a complete reaction on Friday 17th at 97.999 and we have seen gold sell off on the dollar buy floor .
the next anticipation will be on 96.361 floor which will come along FOMC rate outcome ,if the rate decision and outlook becomes positive ,technical correction might continue for the yellow metal before rally.
the us-china tension is cooling off ,technically slowing central banks demand for the yellow metal.
GOODLUCK
#XAUUSD #GOLD #DOLLAR #DXY

DXY - will we see a bullish divergence?Hello, dear traders. We can observe an interesting situation on the Dollar Index.
What we see:
1. An uptrend on the weekly timeframe.
2. The price is at the support level.
3. Over the 18 years of this trend, all impulses from the support level originated after MACD divergence. For divergence, we need at least two troughs, but now we are seeing only one.
Therefore, I expect another decline in the Dollar Index with an update of the low on closed weekly candles. After that, for a reversal according to my author's FRL concept, it is necessary to form a multi-day reversal pattern. At the moment, the neck level is at 100.200, as this is where the last impulse of the last downtrend originated. If the price does indeed update the low and form a divergence, the neck level will be at 99.500.
How do you rate this idea and what are your thoughts on it?

DXY Bullish outlookdxy h4 making higher highs and higher lows .
Price traded into and respected the daily bullish OB + FVG + IFVG
Targeting big figure 100.000

DXY Weekly Outlook - Impact on XAU/USD & EUR/USD📊DXY Weekly Outlook - Impact on XAU/USD & EUR/USD
On the weekly timeframe, the U.S. Dollar Index (DXY) has shown a clear Market Structure Shift (MSS) after retesting a key support zone, identified as a weekly breaker block.
This technical setup suggests a bullish outlook for the upcoming week. 📈
A strengthening dollar typically translates into a weaker Euro and potential downward pressure on Gold (XAU/USD) due to their negative correlation with the USD.
In addition, there is engineered draw on liquidity to the upside, supported by an unfilled imbalance (weekly Fair Value Gap) , providing a strong indication that price may continue to seek higher levels in order to rebalance this inefficiency.
Also, we have identified a Smart Money Technique (SMT) divergence on the weekly timeframe between DXY and EUR/USD, adding strong confluence to our outlook.
Specifically, DXY has formed a lower low, while EUR/USD has created a higher high ,an indication of underlying dollar strength and bearish momentum building for EUR/USD.
On the EUR/USD weekly chart, a liquidity grab followed by a Market Structure Shift further supports our bearish bias for the pair in the coming week.
In summary:
DXY: Bullish bias 🐂
EUR/USD: Bearish bias 🐻
XAU/USD: Bearish bias 🐻
Overall, based on current structure, SMT divergence, and prior technical analysis, I expect the U.S. Dollar to strengthen in the week ahead, with EUR/USD and Gold likely to experience downward movement.

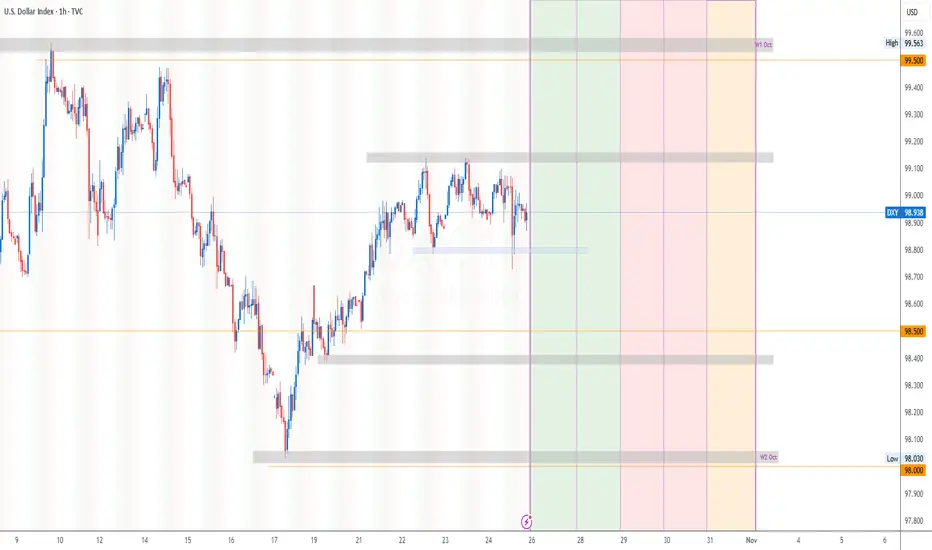
DXY key levels to look out for this week (WC 26/10)DXY key levels for the following week ahead.
Key fundementals this week includes FOMC on Wednesday highlighted in red, and Euro main refinancing Rate on Thursday 1315.
Looking at the 4hTF, we are currently ranging at this moment between 98.80 support and 99.10 Wednesdays HL.
DXY WEEKLY FRGNT FORECAST - Q4 | W44 Y25 |📅 Q4 | W44 Y25 |
📊 DXY WEEKLY FRGNT FORECAST
🔍 Analysis Approach:
I’m applying Smart Money Concepts, focusing on:
Identifying Points of Interest on the Higher Time Frames (HTFs) 🕰️
Using those POIs to define a clear trading range 📐
Refining those zones on Lower Time Frames (LTFs) 🔎
Waiting for a Break of Structure (BoS) for confirmation ✅
This method allows me to stay precise, disciplined, and aligned with the market narrative, rather than chasing price.
💡 My Motto:
"Capital management, discipline, and consistency in your trading edge."
A positive risk-to-reward ratio, paired with a high win rate, is the backbone of any solid trading plan 📈🔐
⚠️ Losses?
They’re part of the mathematical game of trading 🎲
They don’t define you — they’re necessary, they happen, and we move forward 📊➡️
🙏 I appreciate you taking the time to review my Daily Forecast.
Stay sharp, stay consistent, and protect your capital
— FRNGT 🚀
TVC:DXY

U.S. Dollar Index | Countertrend Break Aligning Toward ExpansionThe Market Flow | October 26, 2025
Technical Overview
Monthly:
• The bearish countertrend from the 108.50 pivot remains active but is slowing after completing a 138.2% Fibonacci projection.
• Price structure is consolidating above the 95.99 breakout base, showing early signs of phase rotation.
• A monthly close above 100.80 would confirm a higher timeframe structural shift.
Weekly:
• The down impulse reached the 138.2% target near 95.99 and turned higher into corrective structure.
• The active weekly pivot at 98.54 defines current bias.
• The correction phase persists toward the 38.2% retracement at 101.43 , with 106.64 as weekly expansion resistance.
• Structure favors continuation within a developing countertrend recovery channel.
Daily:
• The daily trend remains bullish above 98.54 , with higher lows intact.
• Price currently trades within the 61.8% Fibonacci retracement zone (98.75–98.85) , overlapping with the H4 expansion base — a structural sweet spot of alignment between the daily and H4 expansion phases.
• A sustained move above the green countertrend line confirms continuation toward 99.97 → 100.81 → 101.43 .
• The active daily pivot at 98.12 defines primary invalidation for the short-term bullish structure.
H4:
• Consolidation within the 61.8% Fibonacci zone supports accumulation before potential expansion.
• A confirmed H4 close above 99.25 (EXP) initiates the expansion phase toward 99.97 → 100.81 → 101.43 → 101.94 .
• Failure to hold 98.12 (D Pivot) neutralizes the short-term phase alignment and reopens 97.70 .
Trade Structure & Levels
• Bias: Long above 97.70
• Trigger = H4 > 99.25 → clean H4 breakdown (EXP line)
• Primary Invalidation = 98.12 (D Pivot)
• Secondary Invalidation = 98.54 (W Pivot)
• Path → 99.97 → 100.81 → 101.43
• Phase: Countertrend Break → Expansion Setup (Daily–H4 Confluence Zone)
Risk & Event Context
• U.S. macro data (PCE inflation, Treasury auctions, and Fed commentary) may drive volatility near key resistance zones.
• Momentum confirmation above 99.25 aligns all active timeframes in expansion phase.
Conclusion
DXY sits within a confluence of daily and H4 61.8% target Fibonacci zone — a structural sweet spot supporting continuation of the expansion phase. A H4 break above 99.25 would validate alignment across both timeframes, targeting the 100–101.40 zone.

DXYDXY can have one more up and without breaking the top it can breakdown one more time.
Disclosure: We are part of Trade Nation's Influencer program and receive a monthly fee for using their TradingView charts in our analysis.
