DXY — Sunday War MapThe U.S. government has reopened after a 43-day shutdown, but the gap in economic data remains.
Several key datasets were not collected during the closure, and the missing information cannot be reconstructed.
As a result, the Dollar is now trading on partial visibility rather than complete fundamentals.
Macro Overview
The most recent complete inflation report is September CPI at 3.0%, with core inflation also at 3.0%.
Earlier in the month, the U.S. Dollar Index (DXY) briefly moved above 100.
It then retreated toward 99 after consumer sentiment fell to a three-year low.
Last week’s muted behavior reflects uncertainty, not a structural shift.
When information is missing, liquidity becomes cautious and price action compresses.
Key Events This Week (Nov 17–21)
FOMC Minutes — Wednesday, Nov. 20
This release provides the first reliable view into Federal Reserve discussions since the shutdown.
Markets will look for whether policymakers supported multiple rate cuts or expressed hesitation.
Consumer Sentiment — Friday, Nov. 22
Last month saw a more than 30% year-over-year decline.
Another weak reading will influence Dollar positioning.
Delayed Data Returns
Housing, industrial production, and jobless claims will re-appear gradually this week.
These incomplete releases still matter ahead of the December 9–10 Federal Reserve meeting.
The Dollar is currently driven more by data absence than by clear economic direction.
MSM — Market Structure Mapping
DXY remains inside a major daily bullish range:
Range Low: 97.672
Range High: 99.985
Price sits near the 50% geometric midpoint.
Last week closed at 98.776, maintaining structural balance and preserving the broader bullish framework.
VFA — Volume Flow Analytics
Price continues to hold on the 98.725 bullish volume node, a level typically used for quiet accumulation.
This suggests ongoing absorption of buy-side orders at discount levels ahead of potential volatility expansion.
OFD — Order Flow Dynamics
Liquidity remains concentrated around two notable participation zones:
Aggressive buyers: 98.243
Aggressive sellers: 99.225
These zones are often retested early in the week to assess participation or clear weak inventory before direction establishes.
PEM — Precision Execution Modeling
Mid-range conditions are typically used to clear stops on both sides before intent forms.
Execution criteria for the week:
Respect higher-timeframe direction
Wait for confirmation
Avoid mid-range noise
Act only when structure, flow, and behavior align
High-quality setups generally appear after liquidity sweeps, not before.
Psychological Frame
The major risk this week is acting on incomplete data.
The shutdown left a statistical gap that has not yet been resolved.
Professionals avoid committing capital until visibility improves.
The appropriate approach for the week is simple: observe first, act later.
— CORE5DAN
Institutional Logic. Modern Technology. Real Freedom.
Trade ideas

DXY holding longs after correction-on my pairs with US dollar I'm still long for the following weeks. After It's correction the dollar should continue It's long movement.
I'm holding my longs on USD/CAD, USD/CHF, USD/JPY, GBP/USD.

DXY Near Key Liquidity Pools — Which One Gets Taken First?NY Session Update
The Dollar opens New York trading holding firm in mid-range, rotating around the 0.50 region near 98.828.
The session begins with a steady structure, and flow remains shaped primarily by the broader macro tone rather than intraday volatility.
The Dollar spent the week under steady pressure as investors reassessed U.S. growth momentum. Several datasets were delayed, and the backlog created uncertainty around how strong the underlying economy actually is. The tone from the Federal Reserve shifted subtly toward patience — less focus on tightening, more on maintaining optionality.
At the same time, global risk appetite improved. Equities held firm, and capital rotated into other major currencies, reducing the Dollar’s safe-haven advantage. That combination — softer growth signals, stabilizing risk, and non-committal policy language — kept the Dollar pinned in mid-range structure.
Looking ahead, the next meaningful movement will likely come from surprise prints rather than scheduled events. Employment data, inflation momentum, and backlog clears remain the pressure points. Until those catalysts hit, the Dollar stays in observation mode: stable, compressed, and sensitive to macro tone rather than intraday noise.
NEXT WEEK’S U.S. DOLLAR DRIVERS
Inflation releases – Headline and core CPI/PPI data will test momentum in pricing pressure.
Employment & labour data – Wage momentum, participation and unemployment trends remain under the microscope.
Policy tone from the Federal Reserve – Speeches and any shifts in guidance around timing will carry enhanced weight.
Global risk-sentiment flow – Equity performance and risk-asset appetite at the NY open will continue to influence USD positioning.
Data backlog clarity – Delayed prints and residual effects from previous disruptions may create surprises in either direction, affecting Dollar flow.
CORE5 Pillar Overview
MSM — Market Structure Mapping:
Price remains inside weekly balance, with activity clustered around 98.776 — consistent with mid-range conditions.
VFA — Volume Flow Analytics:
The 4H anchored volume node at 98.725 continues to mark the area of most participation.
OFD — Order Flow Dynamics:
Recent activity shows hesitation to move deeper into the lower inefficiency zones.
PEM — Precision Execution Modeling:
Liquidity context remains defined by areas near 98.30 and 99.30, with the broader range limits at 97.672 and 99.985.
This provides the wider map for understanding structural rotation.
CORE5 Rule of the Day
Mid-range moves feed ego, not equity.
—
— CORE5DAN
Institutional Logic. Modern Technology. Real Freedom.

USD Rejected at Resistance- Key Test Ahead for DXYThe US Dollar reversed sharply off pivotal resistance into the November open with DXY poised to mark a second consecutive weekly loss. The focus is now on whether the pullback marks the start of a larger correction or a brief pause within the broader uptrend.
The Dollar has now fallen more than 1.2% off the monthly high with the decline now breaking below the September uptrend. A simple channel extending off the monthly high is guiding this decline with initial support now eyed at 99.68/78- a region defined by the August high-day close, the May low and the 38.2% retracement. Look for a larger reaction there IF reached with a break / close below needed to suggest a more significant high is in place and a larger trend reversal is underway. Subsequent support rests at 98.03 and the 2018 high / 61.8% retracement at 97.71/80.
Weekly open resistance is eyed at 99.62 and is backed closely by the November open at 99.75. A break / close above this threshold would threaten resumption of the September uptrend with key resistance steady at 100.15/35- a region defined by the 2024 low, the 200-day moving average and the 2024 low close. Strength beyond this pivot zone is needed to fuel the next major leg of the US Dollar advance. The next major technical consideration is eyed at the 1.618% extension of the September advance at 101.32.
Bottom line: DXY reversed from key resistance into the monthly open with a break below then September upslope threatening a deeper setback- be on the lookout for a possible exhaustion low in the days ahead. From a trading standpoint, losses would need to be limited to 98.68 IF this is a simple correction with a break above 100.35 needed to mark uptrend resumption.
-MB

DXY FRGNT Weekly Forecast -Q4 | W46 | Y25 |📅 Q4 | W46 | Y25 |
📊 DXY FRGNT Weekly Forecast
🔍 Analysis Approach:
I’m applying Smart Money Concepts, focusing on:
Identifying Points of Interest on the Higher Time Frames (HTFs) 🕰️
Using those POIs to define a clear trading range 📐
Refining those zones on Lower Time Frames (LTFs) 🔎
Waiting for a Break of Structure (BoS) for confirmation ✅
This method allows me to stay precise, disciplined, and aligned with the market narrative, rather than chasing price.
💡 My Motto:
"Capital management, discipline, and consistency in your trading edge."
A positive risk-to-reward ratio, paired with a high win rate, is the backbone of any solid trading plan 📈🔐
⚠️ Losses?
They’re part of the mathematical game of trading 🎲
They don’t define you — they’re necessary, they happen, and we move forward 📊➡️
🙏 I appreciate you taking the time to review my Daily Forecast.
Stay sharp, stay consistent, and protect your capital
— FRNGT 🚀
TVC:DXY

USD Dollar index is higher holding up. TVC:DXY price overall is bullish and looks before it continues with the bullish machine movement it's most likely to grab liquidity first then it continues wit the buys either way anyway can happen.
DXY H1Dollar Index hourly timeframe
Daily FVG ( Remains Open )
H4 BoS
H4 IFVG (Traded too in H1) Thursday
Traded too Daily FVG on Friday
H1 Breakway gap & FVG Created Friday ( Remains Open )
Draw on liquidity H4 Relative EQL @98.64 & Daily Gap @98.00

DXY Bullish Continuation Risks Challenge the 100.20-ResistanceOn the daily chart, the DXY’s rebound from its 17-year support near 96 resembles an inverted head-and-shoulders breakout, currently testing the 100.20 resistance.
A confirmed close above this level would complete the pattern, targeting the 101.80 and 103.40 levels — moves that could potentially pressure GBPUSD toward 1.2940 and 1.2740, as detailed in the following charts.
From the downside, if the DXY retreats below 99.40, the selling pressure on major currencies may ease. In that scenario, the DXY is expected to retest the neckline and validate the inverted head-and-shoulders formation, with the trendline connecting consecutive lower highs from May to August, between 98.50 and 98.00.
- Razan Hilal, CMT

Bullish continuation setup?The US Dollar Index (DXY) is falling towards the pivot which is a pullback support that aligns with the 38.2% Fibonacci retracement and could bounce to the 1st resistance.
Pivot: 99.53
1st Support: 98.55
1st Resistance: 101.46
Disclaimer:
The above opinions given constitute general market commentary, and do not constitute the opinion or advice of IC Markets or any form of personal or investment advice.
Any opinions, news, research, analyses, prices, other information, or links to third-party sites contained on this website are provided on an "as-is" basis, are intended only to be informative, is not an advice nor a recommendation, nor research, or a record of our trading prices, or an offer of, or solicitation for a transaction in any financial instrument and thus should not be treated as such. The information provided does not involve any specific investment objectives, financial situation and needs of any specific person who may receive it. Please be aware, that past performance is not a reliable indicator of future performance and/or results. Past Performance or Forward-looking scenarios based upon the reasonable beliefs of the third-party provider are not a guarantee of future performance. Actual results may differ materially from those anticipated in forward-looking or past performance statements. IC Markets makes no representation or warranty and assumes no liability as to the accuracy or completeness of the information provided, nor any loss arising from any investment based on a recommendation, forecast or any information supplied by any third-party.

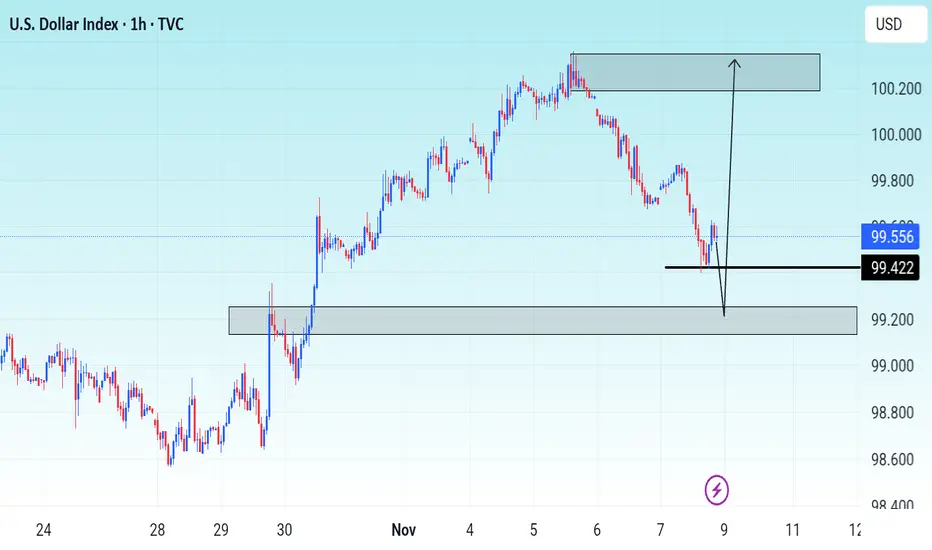
USD Potential Retracement to 99.5I am anticipating a potential retracement on DXY :
Price has run above the recent daily range high. I am now anticipating a potential retracement or pullback.
I will be monitoring H4 and H1 Timeframe price action to see if H1 and H4 lows can start getting taken to validate the idea.
I will also be monitoring the close of Wednesdays Daily Candle.
I am anticipating DXY to pullback to around 99.475 to look for more long positions.
Once dxy has traded back to the key level / support area i will then target 100.360

Bullish momentum set to continue?The US Dollar Index (DXY) is falling towards the pivot, which is a pullback suport and could bounce to the 1st resistance.
Pivot: 99.53
1st Support: 98.55
1st Resistance: 101.46
Disclaimer:
The above opinions given constitute general market commentary, and do not constitute the opinion or advice of IC Markets or any form of personal or investment advice.
Any opinions, news, research, analyses, prices, other information, or links to third-party sites contained on this website are provided on an "as-is" basis, are intended only to be informative, is not an advice nor a recommendation, nor research, or a record of our trading prices, or an offer of, or solicitation for a transaction in any financial instrument and thus should not be treated as such. The information provided does not involve any specific investment objectives, financial situation and needs of any specific person who may receive it. Please be aware, that past performance is not a reliable indicator of future performance and/or results. Past Performance or Forward-looking scenarios based upon the reasonable beliefs of the third-party provider are not a guarantee of future performance. Actual results may differ materially from those anticipated in forward-looking or past performance statements. IC Markets makes no representation or warranty and assumes no liability as to the accuracy or completeness of the information provided, nor any loss arising from any investment based on a recommendation, forecast or any information supplied by any third-party.

DXYSo DXY showing great structure after failing to continue bullish as it did not break above the supply zone and now, moving bearish ensuring the to move towards previous demad zone which price created.

DXY & final liquidityFundamental Analysis :
Based on the current macroeconomic backdrop, the U.S. Dollar Index (DXY) appears to be entering a short-term corrective move to the upside, potentially toward the 100–101 liquidity zone, before resuming its broader bearish trend.
This aligns with the visible Head & Shoulders structure and the small Quasimodo (QM) zone that’s likely to attract liquidity before a larger downside move.
Short-Term View (Correction Toward 101):
Recent U.S. employment and retail sales data have shown relative strength, leading markets to delay expectations for Fed rate cuts.
U.S. 10-year Treasury yields have seen a mild recovery, prompting short-term dollar demand as investors rebalance risk exposure.
The Federal Reserve’s “data-dependent” stance keeps the market uncertain ahead of the next inflation releases, providing a temporary bid for the dollar.
➤ This corrective phase corresponds to the small QM zone (100–101) where liquidity collection and retesting of previous resistance are likely.
Medium- to Long-Term View (Bearish Reversal After 101):
Core inflation (PCE) continues to trend lower, approaching the Fed’s 2.5% target range.
Labor market softness is becoming more visible through higher unemployment and slowing wage growth.
The probability of rate cuts beginning in early 2026 is increasing, which would significantly reduce the dollar’s yield advantage.
Meanwhile, other major economies (Europe, China, Japan) are stabilizing, which could rebalance global demand away from the USD.
Additionally, rising U.S. government debt and fiscal deficit concerns are weighing on real yields and long-term dollar sentiment.
➤ These factors suggest that once liquidity is collected near 101, DXY could begin a new bearish leg toward the 95–92.5 demand zone.
The current upward move in the dollar is likely a final liquidity grab before the next major decline.
From a fundamental perspective, this aligns with short-term resilience in economic data, followed by an eventual shift toward monetary easing and weaker growth momentum — perfectly in line with technical scenario.

DXY Selling view watch chart📉 DXY Update (4H Timeframe)
DXY currently reacting from the 100.300 supply zone, following selling pressure from the 100.000 level.
🔹 Technical Outlook:
Resistance / Supply Zone: 100.000 – 100.300
Support Levels: 99.800 🟡 | 99.500 🟢
Bias: Bearish below 100.000
💡 Price action shows signs of rejection at key resistance. Watch for confirmation before entering. Always trade with discipline and a clear plan.
⚠️ Risk Management Reminder:
Use proper position sizing and always protect your capital — no setup is 100% guaranteed.
👉 Like • Comment • Follow • Share
For more daily technical updates and insights 💹
#DXY #DollarIndex #ForexAnalysis #TechnicalAnalysis #PriceAction #TradingSetup #RiskManagement

DXY Near 100 as Rate-Cut Odds Fade and Uptrend Remains IntactHey Traders,
In today’s trading session we are monitoring the US Dollar Index (DXY) for a buying opportunity around the 100.000 zone. The Index is trading in a broader uptrend and currently is in a correction phase, approaching the trend support/resistance area near 100.000.
Structure:
The prevailing trend remains bullish, though price is consolidating and retesting the support/resistance level at 100.000. A solid rebound here could signal a resumption of the upward trajectory.
Fundamentals:
Recent commentary from the Federal Reserve indicates that a rate cut in December is increasingly unlikely. This hawkish tilt supports the Dollar and reinforces the up-trend scenario.
Next move:
Watching how price behaves around 100.000 — if the level holds, the bias remains bullish; a break below would call structural risk into question.
Trade safe,
Joe.

DOLLAR INDEX 3HR CHART DOLLAR index from TVC broker already attained 100.354 before correction and i see the buying pace to return into 100$ and above despite rate cut .the close of the newyork session came back to my demand floor and reacted on long position based on the rule of break and retest.
FUNDAMENTAL OF DOLLAR INDEX .
The U.S. Dollar Index (USDX or DXY) is a measure of the value of the U.S. dollar relative to a basket of six major foreign currencies: the euro (EUR), Japanese yen (JPY), British pound (GBP), Canadian dollar (CAD), Swedish krona (SEK), and Swiss franc (CHF). It was created by the U.S. Federal Reserve in 1973 shortly after the Bretton Woods Agreement dissolved. The index is maintained and published by the Intercontinental Exchange (ICE).
How the Dollar Index Works
The index is a weighted geometric mean of the dollar’s value relative to the six currencies, with the euro having the largest weight (57.6%).
A rise in the index indicates dollar strengthening against these currencies, while a decline indicates dollar weakness.
Impact on Gold Price
Gold is priced in U.S. dollars globally, so its price has an inverse relationship with the dollar index.
When the dollar strengthens (index rises), gold becomes more expensive in other currencies, reducing demand and often causing gold prices to fall.
Conversely, when the dollar weakens (index falls), gold becomes cheaper internationally, increasing demand and driving prices up.
Additionally, gold is viewed as a safe-haven asset, so macroeconomic factors influencing the dollar also indirectly affect gold's price dynamics.
The relationship between the U.S. Dollar Index (DXY) and the U.S. 10-year Treasury yield (US10Y) is closely interconnected, reflecting how currency strength and bond yields interact in financial markets.
Key Points of Dollar Index and US10Y Relationship:
Positive Correlation:
Generally, the Dollar Index and the US 10-year Treasury yield move together. When the 10-year yield rises, it often signals expectations of stronger U.S. economic growth and potential inflation, which tends to boost demand for the U.S. dollar, pushing the Dollar Index higher.
Yield Attraction:
Higher U.S. Treasury yields make U.S. assets more attractive to global investors, increasing the demand for dollars to buy Treasury securities. This capital inflow strengthens the dollar against other currencies, reflected in a rising Dollar Index.
Monetary Policy Expectations:
The 10-year yield is influenced by Federal Reserve monetary policy and market expectations. When the Fed signals tightening (rate hikes), yields rise, supporting dollar strength. Conversely, easing tends to lower yields and weigh on the dollar.
Safe-Haven Dynamics:
During economic uncertainty or risk-off events, both U.S. Treasuries and the dollar may see increased demand. This can sometimes cause a decoupling if yields fall (due to bond buying) while the dollar strengthens as a safe haven.
Reasons for Dollar Index Rising Despite Rate Cuts:
Safe-Haven Demand:
Even with rate cuts, in times of global uncertainty or geopolitical tensions, the U.S. dollar remains a preferred safe-haven currency. Investors flock to the dollar for safety, pushing the index higher.
Relative Central Bank Policies:
The dollar’s strength is relative. If other major central banks (ECB, BOJ, BOE,RBA,RBNZ,BOC ) maintain lower rates or ease monetary policy more aggressively, the dollar can strengthen even if the Fed cuts rates.
Market Expectations and Rate Cut Timing:
Rate cuts may have been widely anticipated and priced in ahead of time. The dollar may have declined earlier, and once the cut occurs without negative surprises, it can stabilize or rebound.
Economic Outlook and Inflation:
If the rate cut is seen as precautionary with a still strong U.S. economy or persistent inflation, dollar strength may persist since the Fed is not signaling prolonged easing.
Yield Curve and Bond Flows:
Even with short-term cuts, longer-dated Treasury yields may remain elevated due to inflation or growth expectations, attracting foreign capital and supporting the dollar.
Technical and Positioning Factors:
Trading dynamics, market positioning, and technical support levels can sustain or boost the dollar temporarily irrespective of fundamentals ,such as the break and retest of the daily supply roof and traders took long position on the retest of a broken supply as a new demand floor to close the week touching 100.354 before correction
#US10Y #DXY #dollar

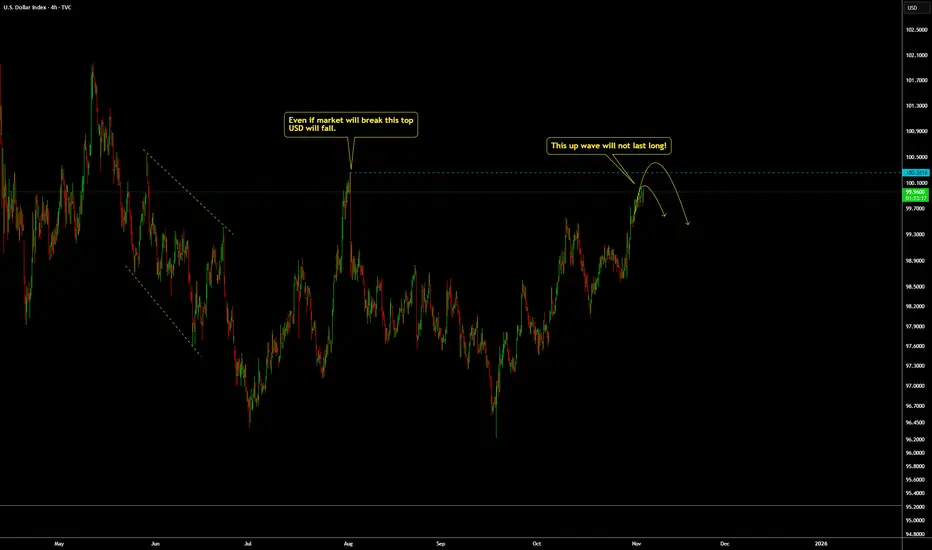
DXY(Dollar Index): This up wave will not last long.For TVC:DXY , don't be trapped with this up wave, it should not last long. What is happening now is only manipulation based on what we see.
Fed will continue to cut rates if not this year, next year and they are printing money, ending the QT and also things are not okay. Based on that, on the fundamental part of things and We Trade Waves wave analysis concept. Any sell setup we get for DXY we will go for it BUT:
Always remember WTW 4 Golder Rules:
1) Do not jump in
2) Do not over risk/trade
3) Do not trade without Stop Loss
4) Never ever add to a losing position!
Trade with care
We Trade Waves
WTW Team
Disclosure: We are part of Trade Nation's Influencer program and receive a monthly fee for using their TradingView charts in our analysis.
US Dollar's Abnormal BehaviorWhy am I saying it abnormal
- because typically DXY tends to weaken with a rate cuts
- In the last 2 month - there were 2 rate cuts,
- but since those "cuts", a declining dollar begins to show upward corrections (or started getting strong)
- Yesterday - ADP released a very strong labor statistics +42K from -29K in the previous month
- Now dollar must continue to strengthen & rise upon such positive data...........
- But today, DXY started with a gap-down and outlook looks further bearish today

DXY Will Go Lower! Short!
Please, check our technical outlook for DXY.
Time Frame: 5h
Current Trend: Bearish
Sentiment: Overbought (based on 7-period RSI)
Forecast: Bearish
The market is approaching a significant resistance area 99.554.
Due to the fact that we see a positive bearish reaction from the underlined area, I strongly believe that sellers will manage to push the price all the way down to 99.097 level.
P.S
We determine oversold/overbought condition with RSI indicator.
When it drops below 30 - the market is considered to be oversold.
When it bounces above 70 - the market is considered to be overbought.
Like and subscribe and comment my ideas if you enjoy them!

US Dollar Index (DXY)- Ready for shorts?I have been waiting for sell confirmations on this since market open this week. Momentum to the upside is really slowing down. We can expect possible shorts from current levels. I am waiting for a break to the downside followed by a correction to enter sells on this. Do not jump in blindly. Manage Risk!
-TD

DXY Weekly OutlookOn the weekly chart, the DXY has reached the global point B that we marked five weeks ago. This move defined the direction for all dollar-related pairs over the past month and a half. Now it’s time to reassess the chart and outline the key mid-term scenarios.
Plan A:
The key level provides enough volume to trigger a deeper correction. The price bounces from one of the support zones and then continues the main trend. For now, there are no strong arguments on the chart to confirm a trend reversal — the structure remains bullish.
Plan B:
The price reacts to the nearest support area and continues moving upward without a deep correction. This scenario becomes valid only if we see renewed momentum and strong buy-side pressure.
We’re at an important turning point. Watch how the price reacts around point B — this will determine the next phase for the dollar.

A clear long DXY coming weeksAccording to the monthly chart, DXY will push higher to reach 50% of the previous bearish leg, see weekly and 4h charts for more details.

DXY — London Session🧭 Market Context
Dollar capped down overnight from 99.762 to 99.704 but still trades above the key bullish structure point at 99.525. The structure remains bullish overall, yet price keeps failing to break through 99.875 — the current cap. London session has filled yesterday’s balance range, leaving us in neutral territory.
We’re sitting on zero deviation — meaning equal chance to push higher or rotate lower.
Before taking any position, we need confirmation.
📈 Technical Frame DSM + VFA
Structure stays constructive but momentum is fading.
Volume shows thinning participation near 99.875 — professionals aren’t chasing.
If we see clear volume conviction through that level, we likely drive higher and fill the capped zone. If price slips below 99.525, expect a liquidity sweep into the lower volume pocket near 99.40. Right now, this is observation mode — not engagement mode.
🌍 Fundamental Frame (Macro Logic)
Overnight softness came from mild risk-on sentiment — Asia equities up, yields down.
Still, the Fed’s tone stays restrictive, and dollar demand remains under the surface.
This move looks more like positioning ahead of NFP than any real shift in trend.
🏛️ Coach’s Lens
When the market sits in balance, patience becomes the edge.
Professionals wait for clarity; amateurs act on hope.
Bias follows structure — not emotion.
🎯 Operator Rule
Confirmation defines conviction.
— CORE5DAN
Institutional Logic. Modern Technology. Real Freedom.
