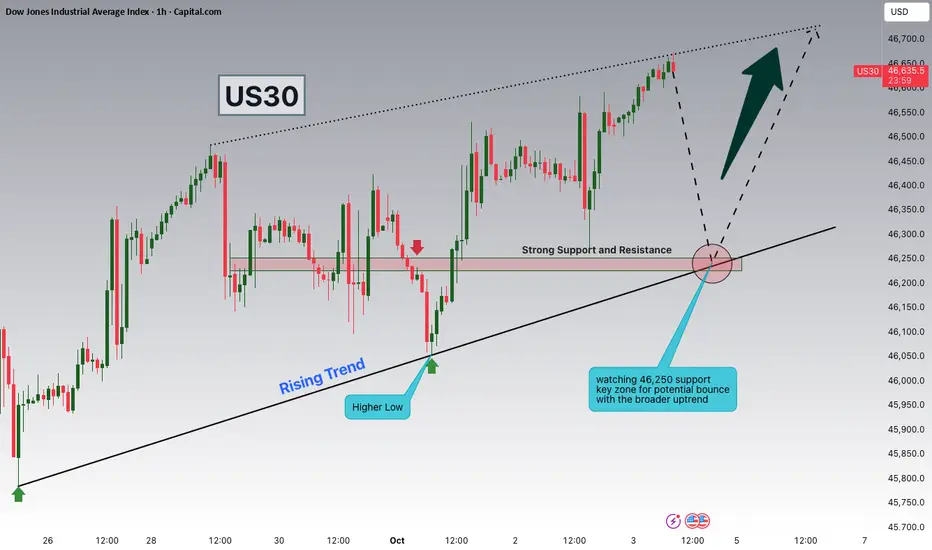
Dow Jones Watching 46,250 Support for Potential ContinuationHey Traders, in today’s trading session we are monitoring US30 for a potential buying opportunity around the 46,250 zone. The Dow Jones is trading in an uptrend and currently in a correction phase, with price moving toward this key support/resistance level.
Structure: The broader trend remains bullish, with pullbacks serving as corrections within the uptrend.
Key level in focus: 46,250 — an important support zone where price could stabilize and attract buyers.
Next move: Holding above 46,250 could open the door for continuation toward higher highs, while a breakdown would suggest a deeper retracement.
Trade safe,
Joe.
US30 trade ideas
US30 Will Collapse! SELL!
My dear followers,
This is my opinion on the US30 next move:
The asset is approaching an important pivot point 46.762
Bias - Bearish
Technical Indicators: Supper Trend generates a clear short signal while Pivot Point HL is currently determining the overall Bearish trend of the market.
Goal - 46.525
About Used Indicators:
For more efficient signals, super-trend is used in combination with other indicators like Pivot Points.
Disclosure: I am part of Trade Nation's Influencer program and receive a monthly fee for using their TradingView charts in my analysis.
———————————
WISH YOU ALL LUCK
DOW JONES Can the 4H MA100 initiate a comeback??Dow Jones (DJI) has been trading within a 2-month Channel Up and today touched its 4H MA100 (green trend-line) for a second time after September 25.
Both in terms of price and 4H RSI action, this sequence is similar to the September 02 rebound fractal, which also following a Bull Flag, it touched the 4H MA100 for a 2nd time and then moved on to a rally that peaked on the 1.5 Fibonacci extension.
The 1.5 Fib ext also priced the Higher High of the first Bullish Leg of the pattern, thus offers currently the highest probability for our next Higher High. Our long Target is slightly below it at 47000, representing a +2.80% rise from the recent Low.
-------------------------------------------------------------------------------
** Please LIKE 👍, FOLLOW ✅, SHARE 🙌 and COMMENT ✍ if you enjoy this idea! Also share your ideas and charts in the comments section below! This is best way to keep it relevant, support us, keep the content here free and allow the idea to reach as many people as possible. **
-------------------------------------------------------------------------------
💸💸💸💸💸💸
👇 👇 👇 👇 👇 👇

$us30Dirty 30….
She’s hunting $46,900+
Layered in as and willing to go $46,606 which holds key to pricing a long or short!!!
Let’s get it!!!!

US30Trading set up for Monday, us30 is that all-time high, potential short set ups, but then there could be possible longs if bounce off any of these levels?
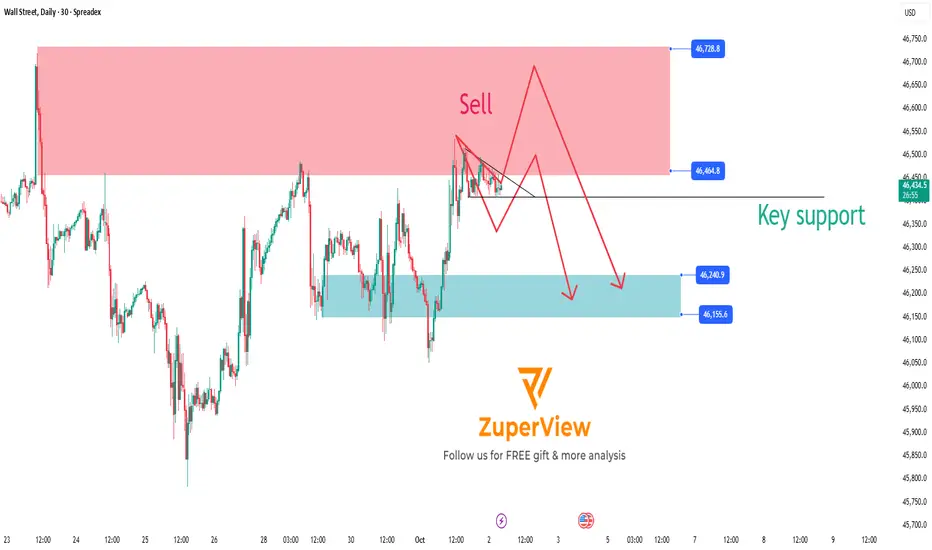
US30: Key support breakdown signals potential sell opportunity
1. Current Market Overview 🌐
The SPREADEX:DJI index is approaching a significant resistance zone where selling pressure is expected to be strong. The price is currently consolidating and moving sideways around this area, preparing for a major move.
2. Technical Signals and Momentum Indicators 📊
Momentum indicators such as MFI, RSI, and Stochastic have all entered the oversold territory, while also showing signs of price compression (consolidation), indicating the market is waiting for the next breakout.
The strong resistance zone and the Overbought/Overextended (OB/OS) signals suggest that buying pressure is weakening, which is favorable for sellers.
3. Sell Scenario on Key Support Breakdown 🔻
If the price breaks below the important Key Support level shown on the chart, this will confirm the beginning of a downtrend.
Traders can consider opening sell positions as soon as the breakout occurs to take advantage of the downward momentum.
The price target is expected to move toward lower support zones where buying interest may emerge to cause a price correction.
4. Risk Management ⚠️
Place stop-loss orders above the resistance zone or the nearest recent highs to protect against unexpected market moves.
Adjust your position size according to your risk tolerance.
5. Conclusion 🔑
The sell setup on US30 is very clear with a strong resistance zone and momentum signals indicating a potential upcoming downtrend.
Main scenario: Breaking the Key Support will trigger a strong decline, providing a profitable trading opportunity for sellers.
Wait for a confirmed support break before entering the trade to ensure safety and effectiveness.
Please like and comment below to support our traders. Your reactions will motivate us to do more analysis in the future 🙏✨
Harry Andrew @ ZuperView
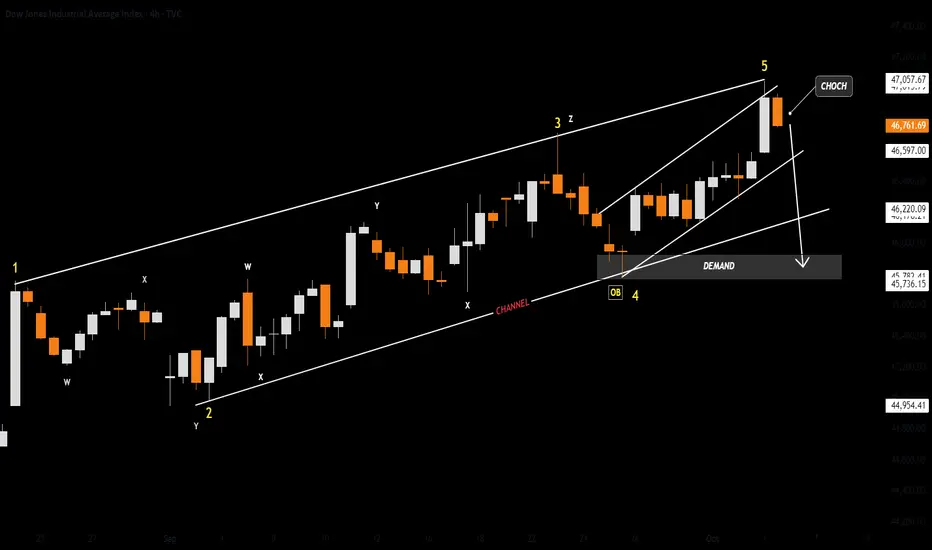
US30DJI - Dow Jones
- Break of Structure
- Bullish Channel as an corrective pattern in Short Time Frame
- Completed " 12345 " Impulsive Waves
- Change of Characteristics
- Order Block
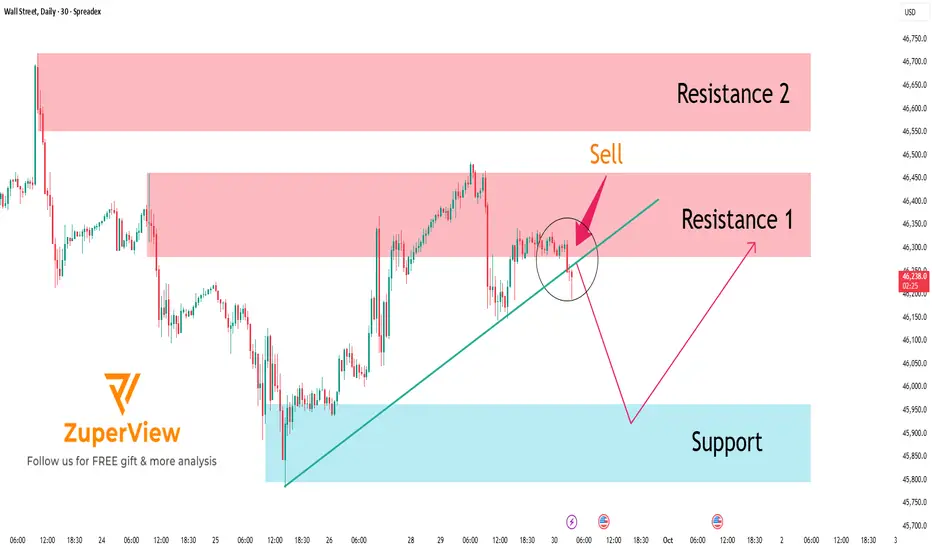
US30: Rejects Resistance – Bearish Move in Progress
The SPREADEX:DJI index is currently forming a bearish short-term structure, especially after price entered the Resistance Zone 1 (46,279 – 46,445) — a key area where sellers have clearly stepped in with strong rejection.
🚨 CLEAR REVERSAL SIGNALS
At Resistance 1, we saw multiple rejection candles with strong bearish bodies.
Additionally, the MA Plot has turned downward, signaling a possible shift in trend.
Price also touched the 4-level structure zone of support/resistance, adding confluence to the area.
Immediately after, the market reversed and dropped sharply with strong bearish candles, confirming the presence of selling pressure and strengthening the short bias.
📉 PREFERRED SCENARIO – SHORT WITH THE TREND
With the current momentum, the preferred scenario is:
🔻 Price is likely to continue dropping toward the Support Zone: 45,459 – 45,798
This zone serves as a logical short-term target for any short positions taken at Resistance 1. Once price reaches this area, traders can consider partial or full take-profits, depending on market reaction.
🧠 TRADE IDEA
Action: 🔻 Short
Entry Zone: 46,279 – 46,445
Stop Loss: Above 46,550
Take Profit: 45,800 – 45,500
✅ CONCLUSION
US30 is under visible selling pressure after rejecting Resistance 1 and reacting strongly at multiple confluence levels. The technical setup favors a trend-following short strategy, with proper risk management and patience around key levels to confirm next moves.
Please like and comment to support our traders. Your feedback motivates us to produce more analysis in the future 🙏✨
DOW JONES GENERATIONAL TOPI believe total collapse is imminent. Not to be spreading panic, but the times we live in rhyme almost perfectly with historical moments like the Great Depression or WW2, while on the same time huge global debt ( over 200% of global GDP ), demographics, policies and geopolitical tensions lead to the conclusion that a historical turning point may has arrived, and it is probably time for financial markets to revert back, not just to a fair value, but to a real discounted value.

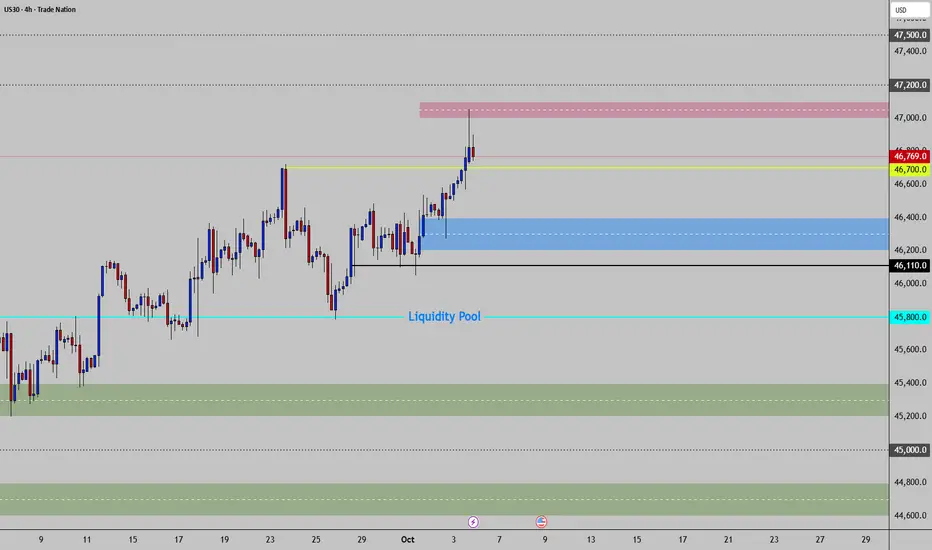
US30 - High Volume Control & Liquidity🚨My personal view:
➡️The Low Season/3rd Quarter is behind us.
➡️Liquidity is crucial for fresh acceleration in the High Season/Last quarter.
------------------------------------------------------------------------------------------------------------
🎯 KEY PIVOT
📍 Zone Type: DEMAND
📊 Price Range: 46,200-46,400
📏 Distance: 569 points below current price with strong support history
📊 MAIN BIAS
🔵 Bias: BULLISH
📌 Context: Strong uptrend near all-time highs
💎 DIAMOND EDGE - Primary Setup
🎲 Direction: Long from current levels targeting 47,000-47,100
🔍 Confirmations:
✅Bullish momentum continuation above 46,700
✅Bullish momentum continuation above KEY PIVOT @ 46,200-46,400
✅Break above 47,000 with strong volume
⚠️ NOTE:
✅Price 231 points from resistance. Watch for rejection at 47,000-47,100.
🎯 Bullish Extension Targets - Discovery
T1: 47,200
T2: 47,500
-------------------------------------------------------------------------------------------------------------
🔄 BIAS FLIP SETUP- BEARISH🔴
💡 46,100-46,400 critical support - break changes structure.
⚡ Triggers:
➡️Multiple Rejection @ 47,000-47,100 Confirming Resistance as Supply Zone.
➡️Then Clear and decisive break below 46,200
🎲 Direction: Short from 46,100
🔍 Confirmations:
🟧Bearish rejection wicks at 47,000-47,100
🟧Break and close below 46,200
🎯 Targets:
T1: 45,600 - 45,800 ➡️➡️LIQUIDITY
T2: 45,200-45,400
T3: 44,600-44,800
⚠️ SESSION RULES
❌Avoid chasing between levels.
✅Use your 50% markers as targets in-between key high-volume areas.
🕐 Trade only NYSE - US session (9:30am-4pm EST)
📰 Monitor Fed policy, economic data
Will DOW JONES Repeat History???The Dow Jones 125-Year Timeline
- The oldest US Stock index is at the 125-year resistance trendline.
- The last time it perfectly tested the trendline - a period of The Great Depression started - 1929
- After, which the Dow fell around 90% - Check the blue supporting trendline.
A similar trendline could be perfectly drawn:
- The support of the trendline is 90% lower than the current market levels

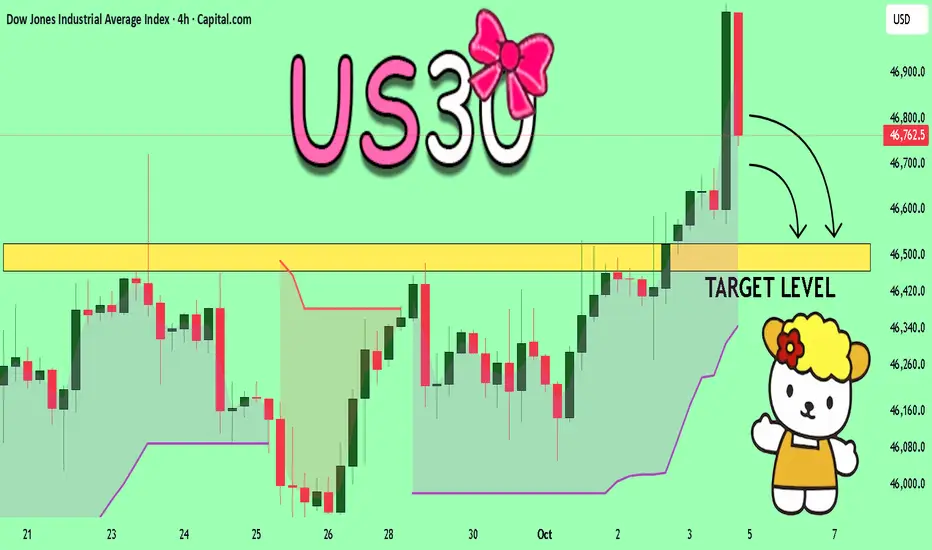
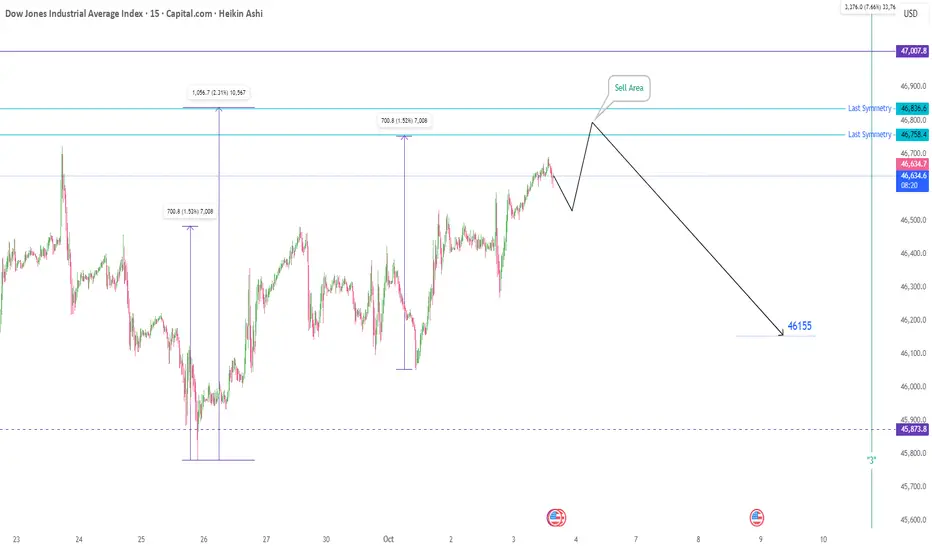
Us30 in FridayToday is Friday, the last trading day of the week. Despite the absence of major economic news releases, the following forecast for the Dow Jones Index is highly probable.
Upon market open and with an increase in trading volume, we anticipate an upward move. After registering a new price high, the index is expected to decline to approximately the 46,160 level.
Entering short positions within the specified target zone presents a favorable opportunity to capture profits. May it be profitable.
Please note: This is solely a trading idea. The responsibility for any trading decision rests entirely with the individual.
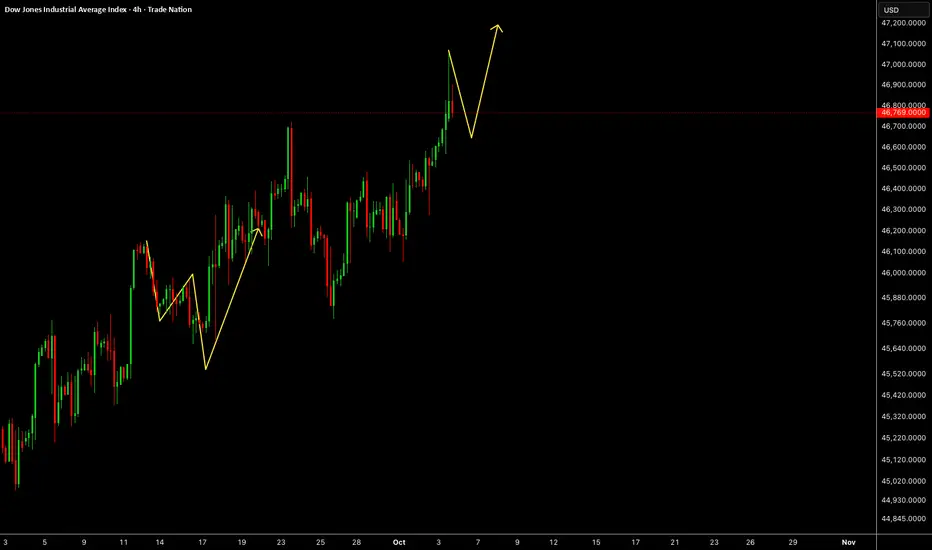
Decrease in the first two days of the week and then a new highFor the next two days, the Dow Jones index will follow the trend shown. First, there will be a downward movement, and after the cycle closes, the movement will increase and grow towards a new price record at the ceiling.

To you in comment…Us30…
FYI…. How far I’m willing to take it. 👀
Let’s get it!!!
Ny active!!!!
Bag or Dust 🏦

Dow Jones Swing Trade Setup – Is 48,000 the Next Stop?📈 US30 "Dow Jones Industrial Average" CFD: Thief's Wealth Strategy Map (Swing/Day Trade) 🚨
🎯 Swing/Day Trade Setup: US30 (Dow Jones Industrial Average CFD)
Get ready to sneak into the market with the Thief Strategy — a cheeky, layered limit-order approach to steal profits from the Wall Street shadows! 😎 This bullish plan is designed for swing or day trading, with a professional yet playful vibe to maximize your market heist. Let’s break it down! 🕵️♂️
🧠 Trade Idea: Bullish Heist on US30 🚀
Asset: US30 (Dow Jones Industrial Average Index CFD)
Market: Wealth Strategy Map (Swing/Day Trade)
Outlook: Bullish 📈
Strategy: The Thief Strategy — using multiple buy limit orders in a layered entry style to catch the best price levels. Think of it as setting traps for profits! 🕸️
📝 The Thief’s Plan: Layered Entry & Key Levels
🔑 Entry Strategy:
Deploy multiple buy limit orders to layer your entries like a master thief:
🎯 46,500
🎯 46,600
🎯 46,700
🎯 46,800
Pro Tip: Feel free to add more layers based on your risk appetite or market conditions. The more traps, the merrier! 😜
Flexible Entry: You can enter at any price level within this range, but layering helps you average into the position like a sneaky pro.
🔐 Stop Loss (SL):
Set at 46,300 — the Thief’s escape hatch! 🚪
Note: Dear Ladies & Gentlemen (Thief OGs 🕶️), this SL is my suggestion, but it’s your heist! Adjust based on your risk tolerance and account size. Only risk what you can afford to lose!
🎯 Take Profit (TP):
Primary target: 47,600 — a juicy profit zone before the Police Barricade (resistance) at 48,000.
Why 47,600? This level avoids the overbought trap and potential reversal at 48,000, where strong resistance and market shenanigans may lurk. 🕵️♂️
Note: Thief OGs, this TP is my call, but you’re the boss! Take profits at your own discretion and secure the bag. 💰
🔍 Why This Setup? Key Analysis Points
Market Context: The US30 is showing bullish momentum, supported by recent economic data and market sentiment (check social posts and financial news for real-time vibes).
Technical View:
The layered entry approach leverages potential pullbacks within a bullish trend, maximizing your entry efficiency.
The 46,300 SL is placed below key support to protect against sudden reversals.
The 48,000 level acts as a major resistance (overbought zone + psychological barrier), making 47,600 a safer TP.
Risk Management: The Thief Strategy spreads risk across multiple entry points, reducing the impact of volatility spikes.
💹 Related Pairs to Watch (Correlated Assets in USD)
To boost your market awareness, keep an eye on these correlated assets:
SP:SPX (S&P 500 Index CFD): Moves closely with US30 due to shared exposure to U.S. large-cap stocks. A bullish US30 often aligns with SPX strength. 📈
PEPPERSTONE:NAS100 (Nasdaq 100 Index CFD): Tech-heavy index that can amplify or diverge from US30 moves. Watch for tech sector momentum. 💻
FX:USDJPY (Forex Pair): A stronger USD often supports bullish US equity indices like US30. Monitor for USD strength or Yen weakness. 💵
Key Correlation Insight: If SP:SPX and PEPPERSTONE:NAS100 show similar bullish patterns, it reinforces the US30 setup. Conversely, a sharp USDJPY drop could signal caution for US indices.
⚠️ Disclaimer
This Thief Style trading strategy is just for fun and educational purposes! 😜 Trading involves risks, and past performance doesn’t guarantee future results. Always conduct your own analysis, manage risk wisely, and only trade what you can afford to lose.
✨ If you find value in my analysis, a 👍 and 🚀 boost is much appreciated — it helps me share more setups with the community!
#US30 #DowJones #ThiefStrategy #SwingTrading #DayTrading #Bullish #TechnicalAnalysis #TradingView #WealthStrategy

Is the Dow Jones still bullish? Yes.
Hello everyone
I think Dow Jones has the potential to grow further and if the conditions set in the figure below are met, it can be said that it can easily reach the set target. What do you think, friend? Leave me a comment

ANALYSIS OF THE CURRENT 5-YEAR BULL CYCLEWe would look at the 20 year cycle in the stock market, there are two individual 20-year cycles running together at a time. One cycle defines tops and the other identifies the major market lows. We would also look at the 20- year periodicity of repeating market fractals and the 5-year bull cycle that commences at the beginning of each 20-year cycle.
In subsequent updates we will identify the 8 - 13 subdivision of the 20-year cycle. To make the chart clean we have only indicated the cycle that defines bottoms. Top cycles will be identified in the description and both cycles combined on one linear scale to see how they relate to the 5-year bull cycle.
Our pivot point is taken at the 22nd August 1921 low.
First Cycle duration:
22/08/1921 - 27/04/1942 = (7553 days /1079 weeks /248.2 months)
= 20 years, 08 months, 05 days.
Cycle 2:
27/04/1942 - 25/06/1962 = (7364 days / 1052 weeks / 242 months)
= 20 years, 01 month, 29 days.
Cycle 3:
25/06/1962 - 16/08/1982 = (7357 days / 1051 weeks / 241.7 months)
= 20 years, 01 months, 22 days
Cycle 4:
16/08/1982 - 07/10/2002 = (7352 days / 1051 weeks / 241.7 months)
= 20 years, 01 month, 21 days
Cycle 5:
07/10/2002 - 10/10/2022 = (7308 days / 1044 weeks / 240.1 months)
= 20 years, 0 month, 03 days
By observation, cycle 3 and 4 have the same duration 7357 days while cycle 2 is (+7 days) off 7357 days, i.e 1 candle on the weekly timeframe. Now, looking at the beginning points of each cycle, within the identified ellipses we see a striking fractal that has been consistent in all 5 cycles.
Cycle 1 and 2
Cycle 3 and 4
Cycle 5 and 6
The 20-year cycle that defines tops are on :
27th May 1946
7th February 1966
24th August 1987
8th October 2007
XX - XX - 2027
Cycle 1 origin point is on 22/08/1921 but has a split focus at two points, one on the 1921 pivot and the other on the much popular May 1924 low.
Representing both cycles (Bottoms and tops)
This shows that between the two origin points is approximately a 5-year cycle
This cycle is actually an astrocycle and varies according to the changing speed.
By observation, Fractal 1 is very much identical to fractal 4 and fracal 2 very much identical to 5. A time span of 60 years averagely separate fractals 1 and 4 as well as 2 and 5. This leaves the 1962 - 1966 cycle, 60 years from 1962 puts the origin for the new identical fractal at the October 2022 low.
The above justifies that if the cycle is not inverted then a point on the current price action should not be broken. Also it negates the numerous calls for a crash that has been chanted since the 2020 low and never materialized.
HOWEVER, there is the 101-year cycle which alternate tops for bottoms and vice versa after its completion, and considering the pivot from 22/08/1921 the 101 years ended at the October 2022 low.
Interesting... check back as we would go through the numerical expansions that shed more light on what to expect forward, price levels, and time resistances.
Thanks for your time, all opinions are much appreciated, questions would be answered too.
Good luck.

US30 – Bearish Below 46,300 With Downside Targets at 46,120 US30 – Overview
US30 is holding a bearish bias after stabilizing below 46,300.
As long as price trades below the pivot, the index is expected to extend the decline toward 46,120, with a further drop to 46,000 possible.
A confirmed 1H close below 46,000 would strengthen the bearish trend and expose deeper support at 45,690.
On the other hand, a 1H close above 46,300 would neutralize the bearish pressure and support a rebound toward 46,400 – 46,470.
Pivot: 46,300
Support: 46,120 – 46,000 – 45,690
Resistance: 46,400 – 46,470 – 46,620

US30US30 needs some more correction before pushing up.
Disclosure: We are part of Trade Nation's Influencer program and receive a monthly fee for using their TradingView charts in our analysis.
us30I don’t usually trade US30, but price action is clear enough for me to read. Looks like a solid buy setup.
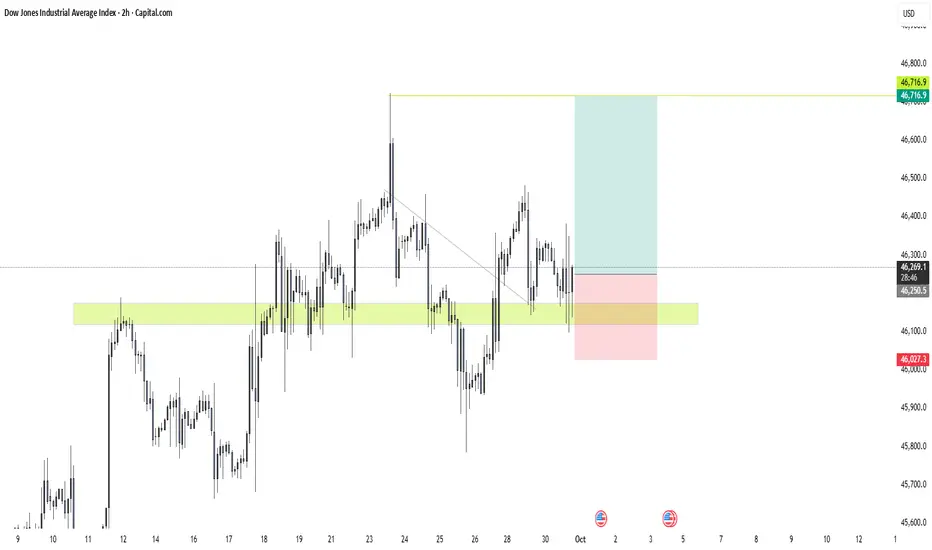
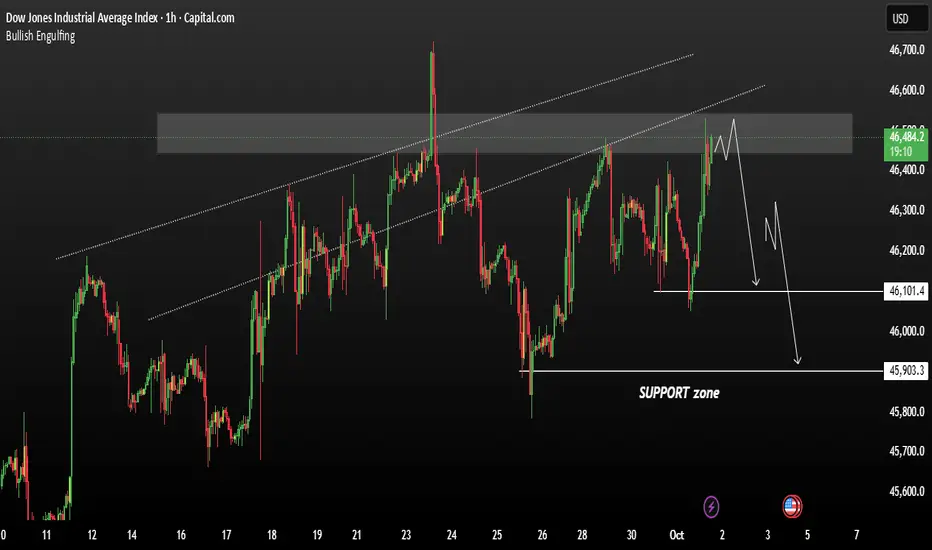
US30 currently consolidating near a key resistance zone US30 is currently consolidating near a key resistance zone likely around the yearly high / major supply level. This resistance has already been tested once previously, where price reversed downward sharply — showing sellers are active here The current sideways movement suggests the market is indecisive or absorbing liquidity before a larger move. If bearish momentum builds, potential support zone we could expect downside target 46,100 – 45,900 falling Range.
You may Find more details in the chart.
Trade wisely Best Of Luck.
Ps. Support with like and comments for better analysis Thanks for Supporting.
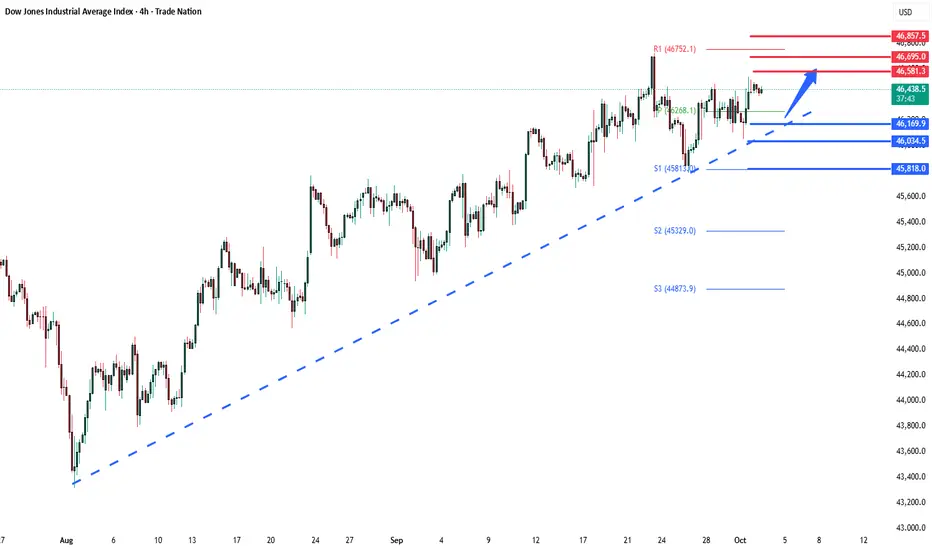
Dow Key Trading LevelsKey Support and Resistance Levels
Resistance Level 1: 46580
Resistance Level 2: 46690
Resistance Level 3: 46850
Support Level 1: 46170
Support Level 2: 46040
Support Level 3: 45800
This communication is for informational purposes only and should not be viewed as any form of recommendation as to a particular course of action or as investment advice. It is not intended as an offer or solicitation for the purchase or sale of any financial instrument or as an official confirmation of any transaction. Opinions, estimates and assumptions expressed herein are made as of the date of this communication and are subject to change without notice. This communication has been prepared based upon information, including market prices, data and other information, believed to be reliable; however, Trade Nation does not warrant its completeness or accuracy. All market prices and market data contained in or attached to this communication are indicative and subject to change without notice.