US30 hits new all-time high amid robust AI fever
US equities rallied to fresh record highs, fueled by the Fed’s rate cut, resilient US economic data, and optimism over progress in US-China trade negotiations. Ongoing enthusiasm for AI also boosted technology stocks.
Nvidia (NVDA) drove the strongest market reaction after announcing a \$5 bln purchase of more than 4% of Intel (INTC). Sentiment was further buoyed by reports that Chinese regulators halted their antitrust probe into Google (GOOGL), ending a long-running investigation into Android’s dominance.
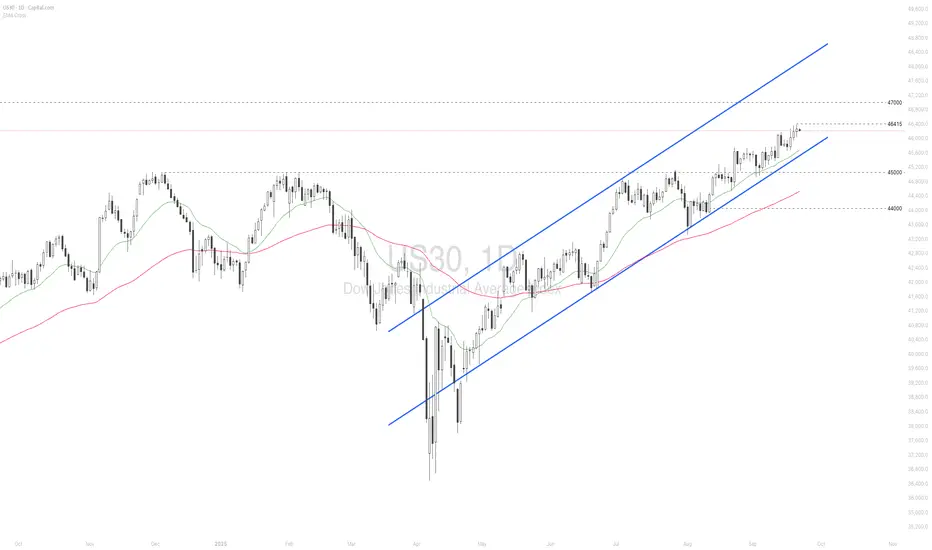
US30 maintained a solid uptrend within the ascending channel, setting a new high. The index holds above both EMAs, indicating the potential continuation of the bullish momentum. If US30 breaches above the 46415 high, the index may gain upward momentum toward the psychological resistance at 47000. Conversely, if US30 breaks below EMA21 and the channel’s lower bound, the index could retreat toward 45000.
US30 trade ideas
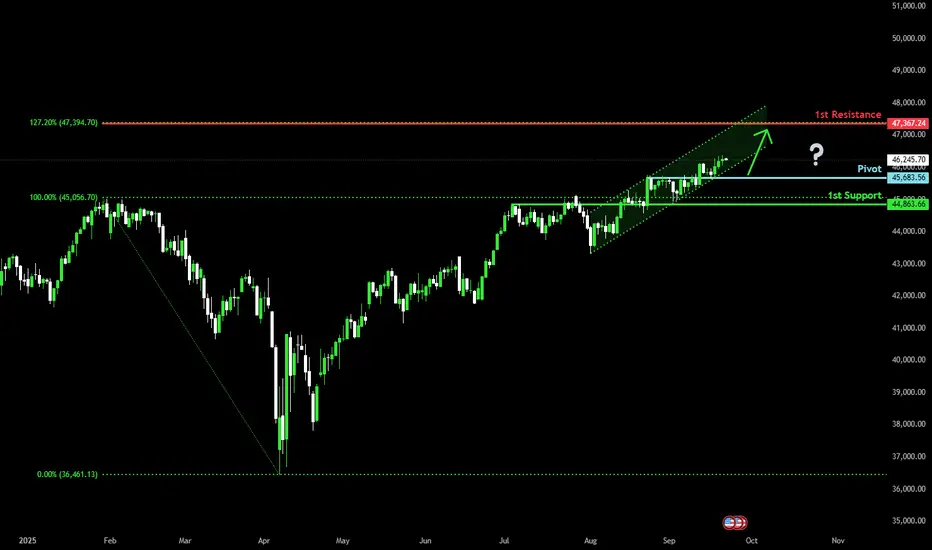
Bullish momentum to extend?Dow Jones (US30) is falling towards the pivot and oculd bounce to the 1st resistance.
Pivot: 45,683.56
1st Support: 44,863.66
1st Resistance: 47,367.24
Disclaimer:
The above opinions given constitute general market commentary, and do not constitute the opinion or advice of IC Markets or any form of personal or investment advice.
Any opinions, news, research, analyses, prices, other information, or links to third-party sites contained on this website are provided on an "as-is" basis, are intended only to be informative, is not an advice nor a recommendation, nor research, or a record of our trading prices, or an offer of, or solicitation for a transaction in any financial instrument and thus should not be treated as such. The information provided does not involve any specific investment objectives, financial situation and needs of any specific person who may receive it. Please be aware, that past performance is not a reliable indicator of future performance and/or results. Past Performance or Forward-looking scenarios based upon the reasonable beliefs of the third-party provider are not a guarantee of future performance. Actual results may differ materially from those anticipated in forward-looking or past performance statements. IC Markets makes no representation or warranty and assumes no liability as to the accuracy or completeness of the information provided, nor any loss arising from any investment based on a recommendation, forecast or any information supplied by any third-party.
US30Success in forex and stocks comes from a combination of knowledge, discipline, and patience. Understanding market trends, economic factors, and company
fundamentals is crucial, but equally important is controlling emotions and sticking to a well-planned strategy. Continuous learning, adapting to changing conditions, and managing risk wisely can turn opportunities into consistent growth over time.
Consistency, not luck, separates successful traders from the rest.

uptrend It is expected that the resistance area will be broken and the continuation of the upward trend will be formed and will continue until the specified Fibonacci levels.
If the support area is broken, a continuation of the downtrend is possible.

US30 - Bullish Path Toward 48,000The market remains strongly bullish with no clear signs of correction, even in lower timeframes.
Active targets are 46,550, 47,300 (key level), and 47,690, with the next major target at 48,000.
Beyond this, 48,920 has also been identified as a potential extension.
While higher targets exist, they belong to a larger fractal and are not yet confirmed.
The deepest possible correction could reach the 45,300 area, which may provide a good long opportunity.
Short positions are not recommended due to high risk and strong buying pressure.

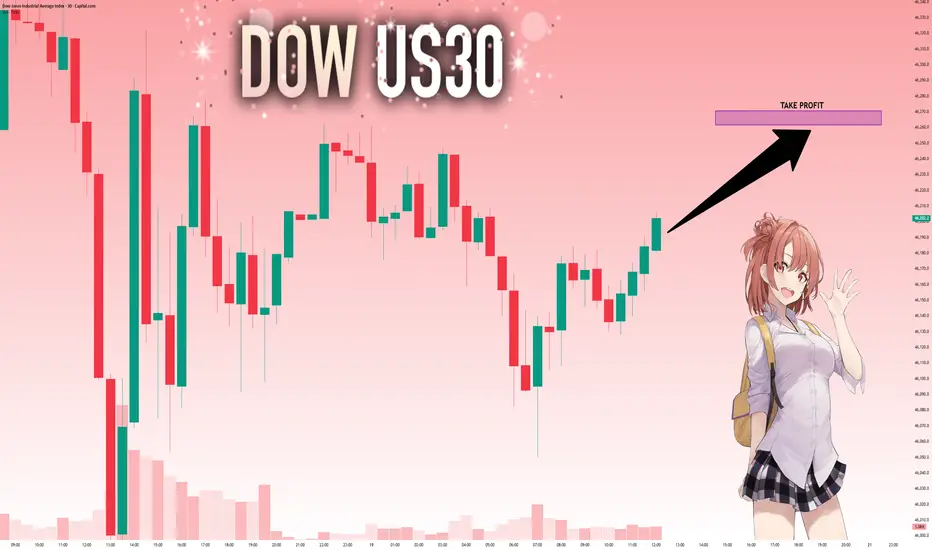
US30US30 needs a small drop and another push up towards 46.5K level.
Disclosure: We are part of Trade Nation's Influencer program and receive a monthly fee for using their TradingView charts in our analysis.

US30 Will Collapse! SELL!
My dear friends,
My technical analysis for US30 is below:
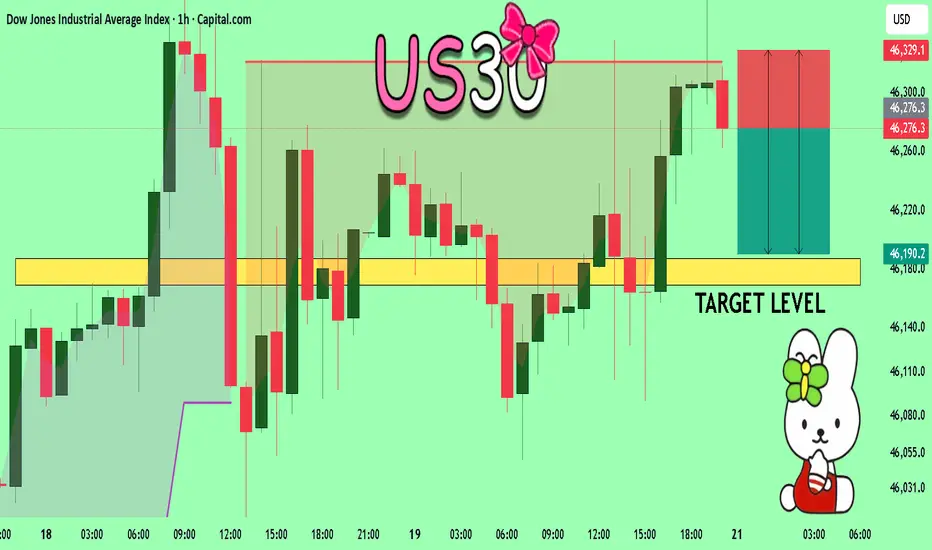
The market is trading on 46276 pivot level.
Bias - Bearish
Technical Indicators: Both Super Trend & Pivot HL indicate a highly probable Bearish continuation.
Target - 46187
Recommended Stop Loss - 46329
About Used Indicators:
A pivot point is a technical analysis indicator, or calculations, used to determine the overall trend of the market over different time frames.
Disclosure: I am part of Trade Nation's Influencer program and receive a monthly fee for using their TradingView charts in my analysis.
———————————
WISH YOU ALL LUCK
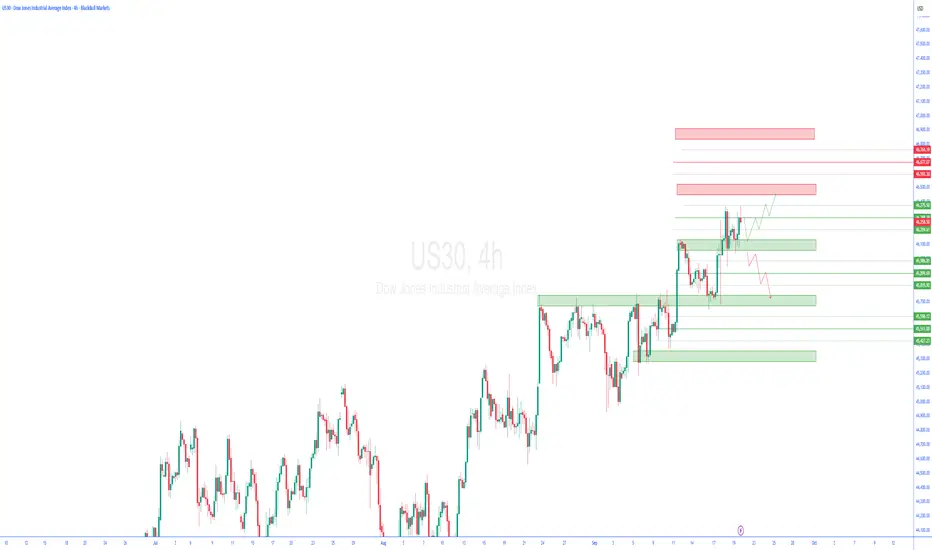
us30 4hTrading Perspectives for the Upcoming Week
In this series of analyses, we have reviewed short-term trading perspectives and outlooks.
As can be seen, in each analysis there is a significant support/resistance zone near the current asset price. The market’s reaction to or break of this level will determine the future price trend up to the next specified levels.
Important Note: The purpose of these trading perspectives is to examine key price levels and the market’s potential reactions to them. The analyses provided are by no means trading signals!
Key Levels & Trend Confirmation – US30US30 Update
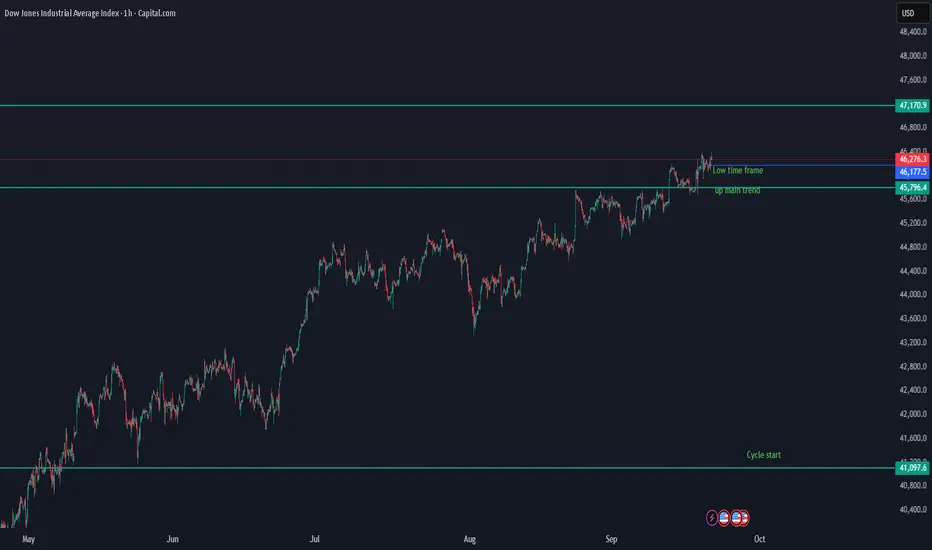
We use advanced data that counts the start of the cycle and all important key levels.
On the low time frame, US30 is holding above the breakout zone (46,177 – 46,214), showing early signs of continuation.
Key levels:
46,214 → first support on the low time frame. Holding this level keeps bullish momentum intact.
46,177 → important confirmation level for the main uptrend. If US30 closes below this, it could trigger a deeper pullback.
As long as price holds above these zones, US30 remains in a bullish structure with potential to push higher.
Downside risk: A breakdown below 46,177 would invalidate the current momentum and open space for correction toward 45,796 support.
Major cycle level: 41,097 remains the cycle start and must-hold support in the bigger picture. Losing this level would shift the cycle to red.
📌 Summary
Above 46,214 – 46,177 → bullish continuation remains in play.
Break below 46,177 → correction risk, watch 45,796 as next support.
Cycle start at 41,097 → key long-term level to keep the broader bullish cycle alive.
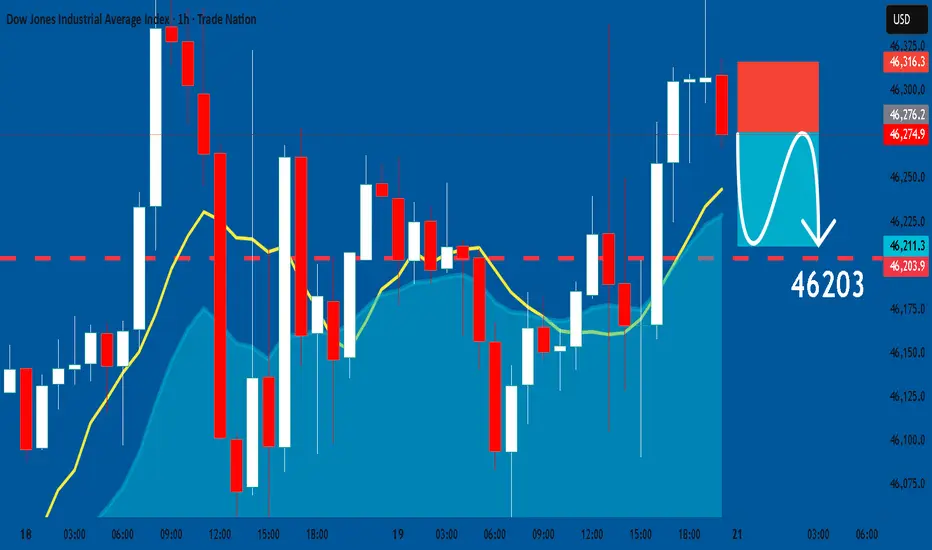
US30: Short Signal Explained
US30
- Classic bearish formation
- Our team expects pullback
SUGGESTED TRADE:
Swing Trade
Short US30
Entry - 46276
Sl - 46316
Tp - 46203
Our Risk - 1%
Start protection of your profits from lower levels
Disclosure: I am part of Trade Nation's Influencer program and receive a monthly fee for using their TradingView charts in my analysis.
❤️ Please, support our work with like & comment! ❤️
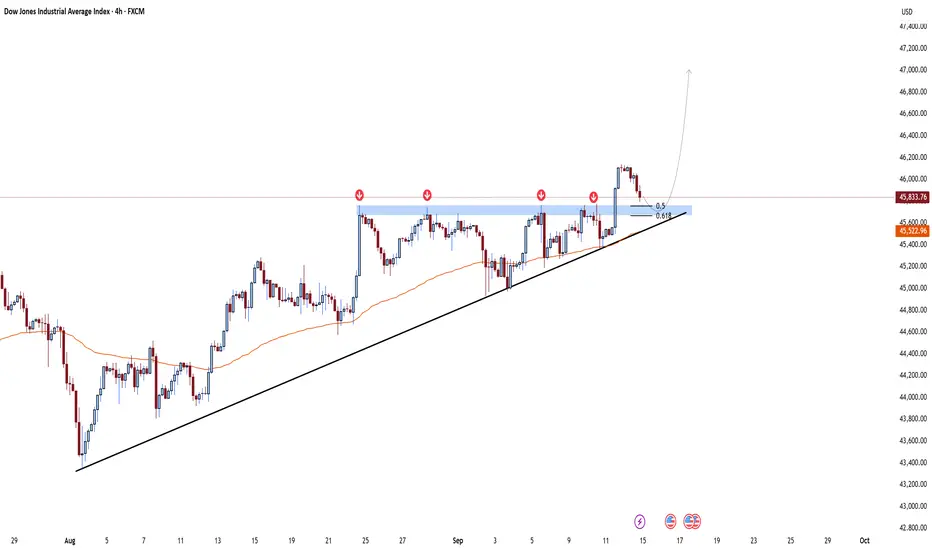
US30 4H📊 Dow Jones (4H) Analysis
The Dow just broke through the 45,700 resistance and is now pulling back to retest that same level as support.
✅ Key points:
The 45,700 zone, which acted as resistance before, could flip into strong support now.
Fibonacci retracements (0.5 & 0.618) line up right in this area, adding more confluence.
The ascending trendline and moving average are also sitting below price, keeping the bullish structure intact.
🎯 Targets:
Short-term: 46,200 – 46,400
Medium-term (measured move from the ascending triangle): 47,000 – 47,200
⚠️ Invalidation:
If price loses the 45,500 – 45,600 zone, we could see a deeper correction back to 45,000 – 45,200.
---
📌 Summary:
As long as the pullback into 45,700 holds, the bullish scenario stays in play and higher targets remain on the table.
---
🔥 What do you think? Is this just a clean retest before a push to 47,200, or will the Dow drop back below support?
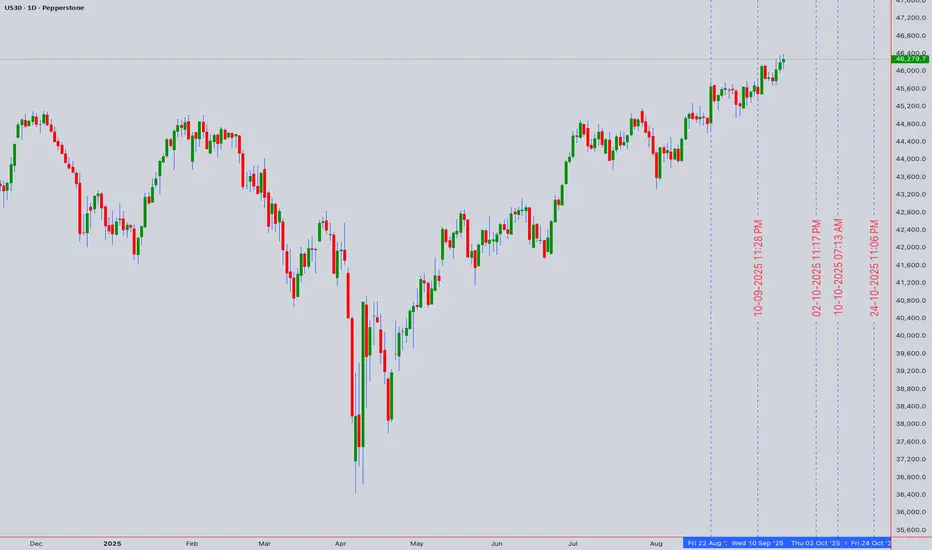
US30 (Dow Jones CFD) Forecast📊 US30 (Dow Jones CFD) Forecast 🔮
Closing Price: 46,279.7 (20th Sept 2025, 12:50 AM UTC+4)
🔥 Technical Outlook (Intraday + Swing)
⏱ Intraday Analysis (5m – 4H)
✅ Buy Zone: 46,050 – 46,150 🎯
🚀 Upside Targets: 46,420 → 46,580 → 46,750 🏆
❌ Sell Zone: 46,600 – 46,700 📉
📉 Downside Targets: 46,380 → 46,200 → 45,950 ⚠️
🔔 Watch for MA Golden Cross & VWAP bounce intraday.
📆 Swing Trading Analysis (Daily – Weekly)
🛡 Major Support: 45,800 – 45,500 🪙
📈 Swing Buy Entry: 45,600 – 45,800
🎯 Swing Bullish Targets: 46,950 → 47,320 → 47,900 🌟
📉 Swing Sell Entry: Below 45,480 ❗
🎯 Swing Bearish Targets: 45,200 → 44,780 → 44,350 🕳
📚 Methodology Applied
📌 Chart Patterns: Head & Shoulders ⚠️, potential Bull Trap 🚨.
📌 Harmonics & Fib Levels: 0.618 pullback aligns near 45,950.
📌 Elliott Wave Count: Wave 3 extension may still be active 🔄.
📌 Ichimoku Cloud: Price above Kumo = bullish bias ☁️✅.
📌 Wyckoff: Distribution signals visible at 46,700 zone 🏦.
📌 RSI: 63 intraday → nearing overbought, but not extreme.
📌 Bollinger Bands: Upper band hit near 46,750 = resistance 🎯.
📌 VWAP: Anchored VWAP support ~46,100 = key intraday pivot.
⚖️ Market Context
📰 US Fed stance & inflation numbers remain catalysts.
🌍 Geopolitical tensions add volatility risk.
💵 Dollar Index strength can cap upside.
🎯 Trading Plan Summary
📊 Intraday Bias: Range-bound → Scalps between 46,100 – 46,700.
🚀 Swing Bias: Bullish above 45,800, bearish below 45,500.
🔑 Risk Mgmt: Always apply SL 80–120 pts (intraday) & 200–300 pts (swing).
⚠️ Note: This analysis is for educational purposes 📚. Trade with discipline, risk management, and DYOR 🔍.
For individuals seeking to enhance their trading abilities based on the analyses provided, I recommend exploring the mentoring program offered by Shunya Trade. (Website: shunya dot trade)
I would appreciate your feedback on this analysis, as it will serve as a valuable resource for future endeavors.
Sincerely,
Shunya.Trade
Website: shunya dot trade
📝 TRADING CHECKLIST
Before entering any position:
- ✅ Confirm volume supports move
- ✅ Check RSI for divergences
- ✅ Verify multiple timeframe alignment
- ✅ Set stop loss before entry
- ✅ Calculate position size
- ✅ Review correlation with DXY/SPX
- ✅ Check economic calendar
- ✅ Assess market sentiment
⚠️Disclaimer: This post is intended solely for educational purposes and does not constitute investment advice, financial advice, or trading recommendations. The views expressed herein are derived from technical analysis and are shared for informational purposes only. The stock market inherently carries risks, including the potential for capital loss. Therefore, readers are strongly advised to exercise prudent judgment before making any investment decisions. We assume no liability for any actions taken based on this content. For personalized guidance, it is recommended to consult a certified financial advisor.
XAUUSD long idea for 4hr playout looking at this setup to playout as we seem to be in CSD range and are coming from the lower bands of the CSD. Next two sessions should play out with something like this.

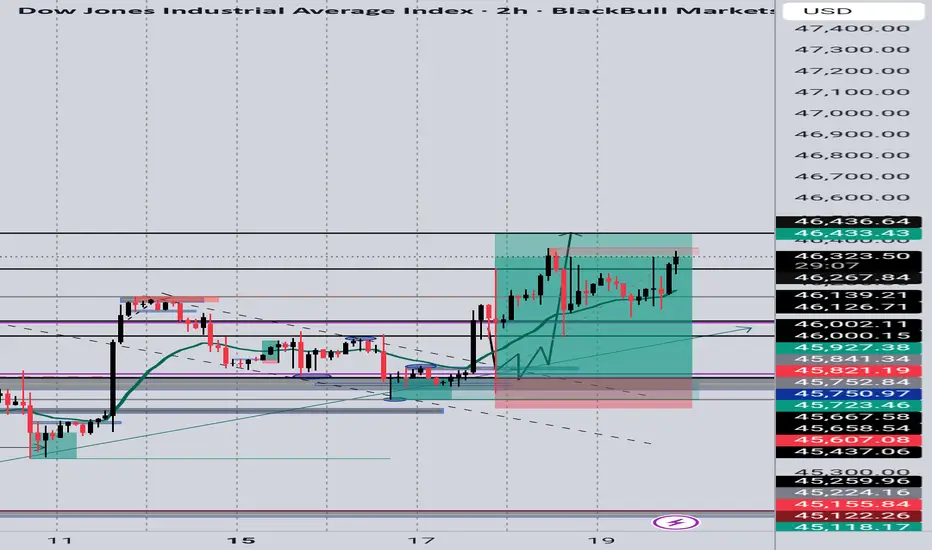
US30 (Dow Jones) Update
US30 (Dow Jones) Update
✅ Reversal entry played out perfectly from support around 45,750.
🎯 Target zone at 46,433 reached with precision.
📌 Clean bullish move respecting market structure – trade delivered perfect results.
📊 Professional Technical Style
US30 respected the reversal zone around 45,750 and pushed higher in line with expectations. Price action confirmed the bullish structure, leading to a strong rally into the 46,433 resistance area, successfully hitting target. A textbook reversal setup that delivered clean results.
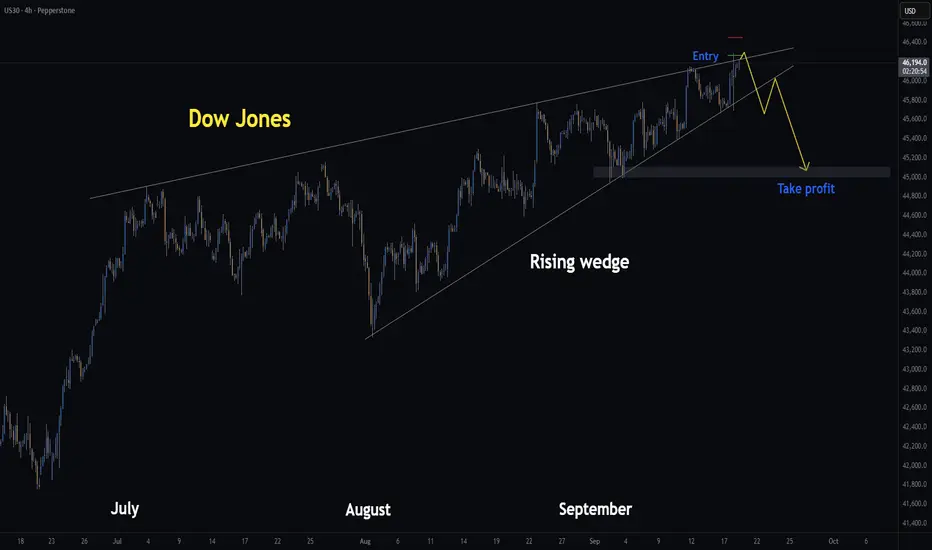
DowJones | H4 Rising Wedge | GTradingMethodHello Traders,
Yesterday I shared a short setup on the Dow Jones using the rising wedge pattern. I entered at 46,267 and exited with a small profit at 46,179. I exited because I did not like the reaction at that level and anticipating a better entry.
Today, I’m looking to re-enter if price reaches 46,343, which could form a potential double top on the chart.
🧐 Market Overview:
Rising wedges generally act as bearish reversal patterns, that said, the broader market remains bullish following the FOMC, so I’ll be risking less and proceeding with caution.
However, the VIX has been sitting near multi-month lows, which often precedes sharp moves. If volatility picks up post-FOMC, rising wedge patterns could act as early warning signs of a pullback.
So I am willing to risk a small amount and potentially be rewarded BIG!
📊 Trade Plan:
Risk/Reward: 6.7
Entry: 46,343
Stop Loss: 46,539
Take Profit 1 (50%): 45,000
Take Profit 2 (50%): 45,000
Also, if this plays out, I expect NAS and S&P to fall too which will likely drag crypto with it.
Thanks for checking out my post!
I would love to hear if you have any rising wedge trading tips? And if you are trading the Dow Jones or S&P today?
Please note: This is not financial advice. This content is to track my trading journey and for educational purposes only.
DowJones Key Tradin Levels - triple-witching dayKey Support and Resistance Levels
Resistance Level 1: 46415
Resistance Level 2: 46640
Resistance Level 3: 46860
Support Level 1: 45800
Support Level 2: 45600
Support Level 3: 45360
This communication is for informational purposes only and should not be viewed as any form of recommendation as to a particular course of action or as investment advice. It is not intended as an offer or solicitation for the purchase or sale of any financial instrument or as an official confirmation of any transaction. Opinions, estimates and assumptions expressed herein are made as of the date of this communication and are subject to change without notice. This communication has been prepared based upon information, including market prices, data and other information, believed to be reliable; however, Trade Nation does not warrant its completeness or accuracy. All market prices and market data contained in or attached to this communication are indicative and subject to change without notice.

US30: Move Up Expected! Long!
My dear friends,
Today we will analyse US30 together☺️
The recent price action suggests a shift in mid-term momentum. A break above the current local range around 46,200.8 will confirm the new direction upwards with the target being the next key level of 46,261.6 and a reconvened placement of a stop-loss beyond the range.
❤️Sending you lots of Love and Hugs❤️
US30 – Record Highs as Fed Cut and Nvidia Deal Fuel MomentumUS30 – OVERVIEW
U.S. stocks hit fresh record highs on Thursday, supported by the Federal Reserve’s first rate cut of 2025, a drop in jobless claims, and news that Nvidia will invest $5 billion in Intel, boosting sentiment across the tech sector. The upcoming New York session is expected to drive additional volatility.
Technical Analysis
The Dow remains in a sensitive zone near key pivots.
🔹 As long as price trades below 46,250, bearish volatility could emerge, targeting 46,120 and, if broken, 46,000.
🔹 A decisive break above 46,300 would confirm bullish continuation toward 46,400 and 46,520.
Key Levels
Pivot Zone: 46,250 – 46,300
Resistance: 46,400 – 46,520
Support: 46,140 – 46,110 – 46,000
A clean move outside the 46,250–46,300 range will set the next direction, with the U.S. session likely to provide the catalyst for a breakout.

Dow Jones is back in playThe rotation from tech stocks back to the industrial sector is the main trend in late September: Dow Jones gets back in play. The price consolidates in the ascending wedge, and ready to break it to the upside as shown on the chart, with a potential target area above $48000.
The alternative scenario would be a false breakout with a continuation of a consolidation and another attempt to break it closer to PCE index publication on September 25th, 2025.
Don't forget - this is just the idea, always do your own research and never forget to manage yoru risk.

US30 - Potential TargetsDear Friends in Trading,
Bull trend and HL series of demands remain intact despite FOMC week.
Let me know if anything is unclear.
I sincerely hope my point of view offers a valued insight.
Thank you for taking the time study my analysis.

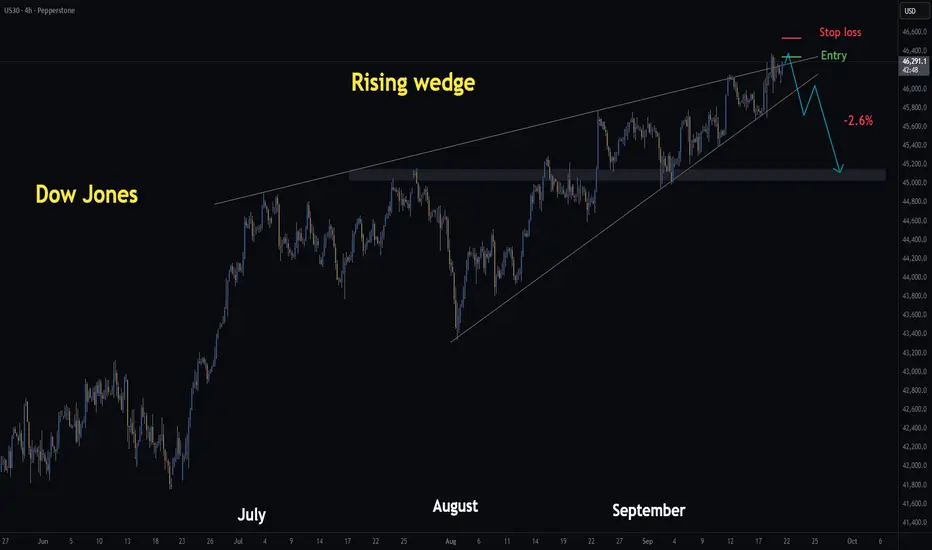
Dow Jones | H4 Rising Wedge | GTRadingMethod👋 Hello Traders.
Yesterday I mentioned I’d be watching for a breakout and retest setup — that plan still stands. However, I’ve also taken a short position off the diagonal resistance line.
🧐 Market Overview:
I’m currently seeing rising wedge structures across Nasdaq, S&P, Russell 2000, and Dow Jones. These patterns typically lean bearish, and I can’t ignore the confluence. That said, wedges can fail, and with the market leaning bullish after of the FOMC announcement, I’m aware this is swimming against the trend.
📊 Trade Plan:
Risk/Reward: 6.7
Entry: 46 267
Stop Loss: 46 450
Take Profit 1 (50%): 45 000
Take Profit 2 (50%): 45 000
(I’m already short from 46 267 and will look to add if price retests that level.)
💡 GTradingMethod Tip:
Bearish patterns like rising wedges can offer high R/R setups, but always remember — strong bullish backdrops (like major data events) can cause them to fail. Risk management is everything.
🙏 Thanks for checking out my post!
Make sure to follow me to catch the next idea and share your thoughts on what you think the markets will do today and how you would trade rising wedges :)
📌 Please note:
This is not financial advice. This content is to track my trading journey and for educational purposes only.
Dow at record highs, outperfoms peers! But are risks brewing?The Dow Jones DJIA surged to new record highs, driven by defensive sector strength and expectations of Fed rate cuts. Dow outperformed due to its heavier weighting in defensive sectors (industrials, financials, consumer staples), which are favoured during economic uncertainty and falling yields. Technical analysis suggests further upside potential, as investors seek stability and dividends in Dow components amid lingering recession risks. However, key support levels must hold to sustain the rally.
The Dow has completed a V-shaped recovery, breaking above previous double-top highs from 2024/2025 (45,150), now acting as support. An open triangle pattern was identified, with the current move likely the fifth wave to the upside. The index trades above all major moving averages, confirming bullish momentum, but RSI shows hidden bullish divergence, supporting the case for continued upside only if support holds after a pullback.
Dow has critical support at 45k, must hold to maintain bullish momentum. A drop below 45,581 could trigger a correction. Short-term upside shows 47k, with a major Fibonacci cluster and technical inflexion in focus. Intermediate levels sit at 46300/45900/45640, with important long-term Targets at 45k, 49500, 50k, 53k.
Risks & Potential Scenarios
Divergence: Despite strong momentum, technical divergence suggests a possible corrective move if the Dow falls below 45581.
Bullish : Holding above 45581 and 45k supports further upside toward 47k and beyond.
Bearish : A break below 45581 could trigger a deeper pullback before any renewed rally.
Market Sentiment :
The bond market’s caution contrasts with stock market optimism, so stay vigilant.
This content is not directed to residents of the EU or UK. Any opinions, news, research, analyses, prices or other information contained on this website is provided as general market commentary and does not constitute investment advice. ThinkMarkets will not accept liability for any loss or damage including, without limitation, to any loss of profit which may arise directly or indirectly from use of or reliance on such information.

BEARISH ESCENARIO15m chart accumulation forming right now, expecting a sweep of liquidity to the upside tomorrow.
