Million dollars analyzing I checked all the timeframes, and from now on, the price is set to increase by 800% strongly. Don't miss this opportunity.
PNUTUSDT.3S trade ideas
PNUT/USDT – Ready for Takeoff? Bullish Setup Ahead!🚀 Trade Setup Details:
🕯 #PNUT/USDT 🔼 Buy | Long 🔼
⌛️ TimeFrame: 1D
--------------------
🛡 Risk Management:
🛡 If Your Account Balance: $1000
🛡 If Your Loss-Limit: 1%
🛡 Then Your Signal Margin: $25.38
--------------------
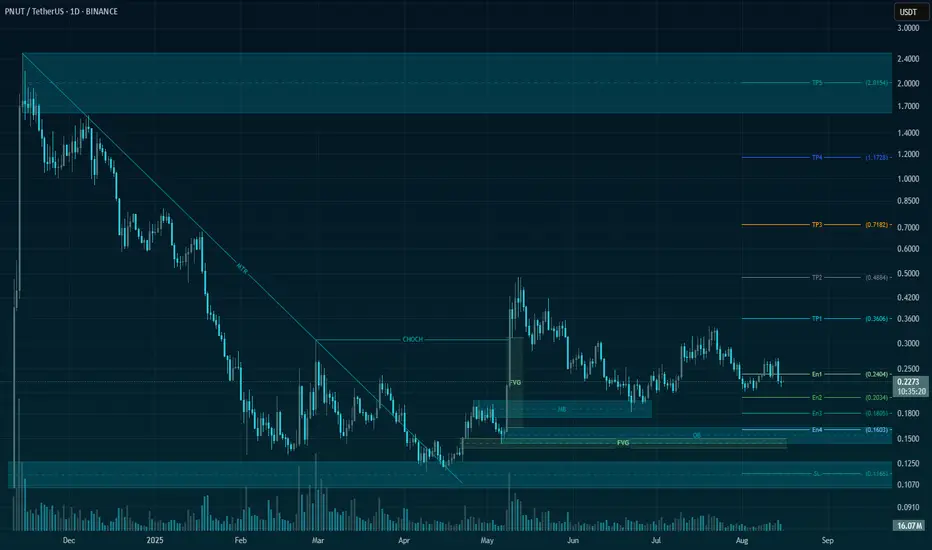
☄️ En1: 0.2404 (Amount: $2.54)
☄️ En2: 0.2033 (Amount: $8.88)
☄️ En3: 0.1805 (Amount: $11.42)
☄️ En4: 0.1602 (Amount: $2.54)
--------------------
☄️ If All Entries Are Activated, Then:
☄️ Average.En: 0.1924 ($25.38)
--------------------
☑️ TP1: 0.3606 (+87.42%) (RR:2.22)
☑️ TP2: 0.4884 (+153.85%) (RR:3.9)
☑️ TP3: 0.7182 (+273.28%) (RR:6.94)
☑️ TP4: 1.1731 (+509.72%) (RR:12.94)
☑️ TP5: 2.0164 (+948.02%) (RR:24.06)
☑️ TP6: Open 🔝
--------------------
❌ SL: 0.1166 (-39.4%) (-$10)
--------------------
💯 Maximum.Lev: 1X
⌛️ Trading Type: Swing Trading
‼️ Signal Risk: 🙂 Low-Risk! 🙂
🔎 Technical Analysis Breakdown:
This technical analysis is based on Price Action, Elliott waves, SMC (Smart Money Concepts), and ICT (Inner Circle Trader) concepts. All entry points, Target Points, and Stop Losses are calculated using professional mathematical formulas. As a result, you can have an optimal trade setup based on great risk management.
📊 Sentiment & Market Context:
PNUT, the native token of the Peanut DeFi ecosystem, is showing signs of a potential reversal after a prolonged downtrend. As a micro-cap DeFi project focused on yield farming and liquidity provision, PNUT remains under the radarmaking it a high-risk, high-reward opportunity.
With the overall crypto market regaining bullish momentum and small-cap tokens starting to catch up, PNUT is positioned well for a possible breakout. Low liquidity means sharp moves are possible, and current price action suggests accumulation at key support zones.
This technical setup aligns with a bullish swing trade, targeting a strong upside while maintaining disciplined risk management.
⚠️ Disclaimer:
Trading involves significant risk, and past performance does not guarantee future results. This analysis is for informational purposes only and should not be considered financial advice. Always conduct your research and trade responsibly.
💡 Stay Updated:
Like this technical analysis? Follow me for more in-depth insights, technical setups, and market updates. Let's trade smarter together!
Above 20%PNUUSDT is setting up for an interesting move. If the price can manage to hit a 20% gain for a long position, it could indicate strong bullish momentum. Furthermore, if it breaks above the trend line resistance, we might see a significant rally that could push the gains well above 300%. It's essential to keep an eye on the market sentiment and volume as we approach these key levels.
It's a time for PNUTUSDT. 50% potential profitOn the Peanut the Squirrel / USDT 4-hour chart, after a prolonged downtrend, the price has stabilized around the $0.19 level, forming a solid support zone. Since then, the market has been gradually recovering, creating higher lows, which suggests a shift in sentiment from bearish to moderately bullish. The moving averages are converging, and the shorter one is attempting to cross above the longer one — a classic signal indicating the possible start of an upward move.
Currently, the price is trading around $0.22, holding above local support and the short-term moving average, which shows that buyers are regaining control. The RSI, after a recent decline, is turning upward without reaching overbought territory, leaving room for further growth.
If bulls manage to maintain the price above $0.21 and break the nearest resistance at $0.23, it could open the way for a continuation toward $0.25 and then $0.28. In the longer term, if the positive momentum holds, the market has the potential to rise toward the $0.32 area, which marks a strong resistance from previous highs.
In summary, the chart structure and technical indicators suggest an increasing likelihood of a continued upward trend, with a potential target around $0.32, as long as the key support at $0.21 remains intact.
Potential TP: 0.32 USD

PNUUSDT — Descending Triangle Accumulation Zone: Major Breakout?🔎 Full Analysis
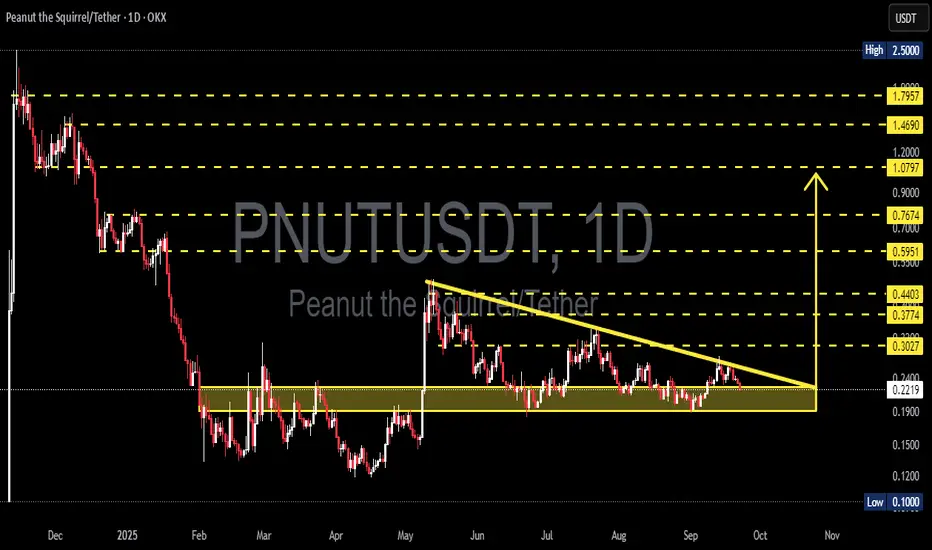
The PNU/USDT (1D) chart shows a clear Descending Triangle pattern that has been forming since May 2025. Price is currently trading around 0.2216 USDT, moving closer to the apex of the pattern — a sign that a big move is likely approaching.
⚙️ Pattern Details
Strong Support (Accumulation Zone): 0.19 – 0.24
This area has been tested multiple times and continues to attract buyers.
Descending Resistance: A downward sloping trendline from May’s high is pressing price lower, forming consecutive lower highs.
Characteristics: While this pattern is typically seen as a bearish continuation, it can also turn into an accumulation base if buyers step in with strong volume.
---
🚀 Bullish Scenario
Confirmation: Daily close above 0.3027 with strong volume.
Step-by-step targets:
First breakout level: 0.3027
Next targets: 0.3774 → 0.415 → 0.4403
Extended target if momentum accelerates: 0.5951
Measured Move Potential: A confirmed breakout projects a move toward 0.415 – 0.44 USDT.
Bullish Narrative: A breakout above the descending trendline could signal the start of a major reversal from long-term accumulation. Buyers regaining control may drive PNU/USDT back toward the 0.40 – 0.60 zone.
---
📉 Bearish Scenario
Confirmation: Daily close below 0.19 with high volume.
Step-by-step targets:
Conservative target: 0.10 USDT (chart low label)
Aggressive measured move target: 0.08 USDT
Bearish Narrative: If 0.19 fails as support, the descending triangle would act as a continuation pattern of the previous downtrend, potentially triggering a deeper breakdown toward 0.10 or even lower.
---
📌 Conclusion
PNU/USDT is at a critical decision point:
Bullish case: Breakout above the trendline could unlock a reversal and rally toward 0.40+.
Bearish case: Breakdown below 0.19 could extend the downtrend to 0.10 or lower.
With price approaching the apex, volatility is expected soon. Traders should wait for daily close + volume confirmation before committing to a position and apply strict risk management to avoid false breakouts.
---
⚡ Key Levels to Watch
Support zone: 0.19 – 0.24
Critical resistance: 0.3027
Breakout targets: 0.3774 → 0.415 → 0.4403 → 0.5951
Breakdown targets: 0.10 – 0.08
---
#PNUT #PNUTUSDT #PeanutTheSquirrel #TechnicalAnalysis #DescendingTriangle #CryptoAnalysis #Altcoin #Breakout #BearishOrBullish #CryptoTrading
PNUT BULL TRAP - to 1880 ??????this analysis reflects only my personal views and is not financial advice. Any profit or loss from actions taken based on this content is solely your own responsibility.

PNUTUSDT 1D#PNUT is moving within a descending triangle on the daily chart. It is currently trading above the daily EMA100 and pressing against the triangle’s descending resistance. In case of a breakout above it, the targets are:
🎯 $0.3227
🎯 $0.3664
🎯 $0.4100
🎯 $0.4721
🎯 $0.5512
⚠️ Always remember to use a tight stop-loss and follow proper risk management.

PNUTUSDT UPDATE#PNUT
UPDATE
PNUT Technical Setup
Pattern : Bullish Falling Wedge pattern
Current Price: $0.2268
Target Price: $0.38
Target % Gain: 60.48%
Technical Analysis: PNUT has broken out of a falling wedge pattern on the daily chart, signaling bullish momentum. Price is retesting the breakout level, and a sustained close above resistance could fuel a move toward $0.38.
Time Frame: 1D
Risk Management Tip: Always use proper risk management.

PNUT/USDT Perpetual Swap on OKX1. Chart Context
Pair: PNUT/USDT Perpetual Swap on OKX
Timeframe: 15m (short-term setup)
Current Price: ~0.2156 USDT
Bias: Long (buy)
2. Trade Setup
Entry Zone: Around 0.2150–0.2160 (current level, near recent local support).
Stop Loss: At 0.2047 (below prior structure lows; invalidation level).
Take Profit: At 0.2329 (upper resistance zone / liquidity pool).
Risk/Reward Ratio: Roughly 1:2 (solid R:R for intraday).
3. Rationale
Liquidity Sweep: Price dipped into a support area and rejected, signaling possible absorption of sell orders.
Trend Reversal Attempt: After a sharp drop, the market is trying to establish a higher low at ~0.2150.
Defined Invalidation: Stop loss sits below prior liquidity grab (0.2047), which means the trade is protected if sellers regain control.
Upside Target: Take profit aligns with previous supply area (~0.2329), which is a logical liquidity target for longs.
4. Trade Management
Partial TP: You could scale out profits at intermediate levels (e.g., 0.2220 and 0.2280) before the final 0.2329 target.
Break-even Move: Once price reaches +1R (around 0.2260), consider moving stop loss to entry for a risk-free trade.
✅ In summary:
This PNUT/USDT long is a short-term counter-trend play with entry near 0.2150, stop at 0.2047, and target at 0.2329. It offers a clean 1:2 R:R setup, based on structure support and liquidity targeting above.
Would you like me to also draw a higher timeframe context (4H/Daily) so you see if this scalp aligns with the bigger trend?

PNUT/USDT – On the Edge of Rebound or Breakdown?📌 Overview:
PNUT/USDT is currently at a major inflection point, following a prolonged downtrend and months of consolidation. The price is once again testing the key demand zone that has acted as a solid support since February 2025. Will this be the beginning of a strong bullish reversal, or the start of a deeper breakdown?
---
🧠 Price Action & Market Structure:
Since peaking around $2.50, PNUT has undergone a sharp decline, now hovering near the critical support area of $0.21–$0.23.
This zone has repeatedly acted as a historical accumulation zone, providing strong bounce reactions in the past.
A potential double bottom pattern is forming – if confirmed, it could ignite a bullish trend.
Multiple resistance levels lie ahead, creating a clear roadmap for staged recovery if momentum shifts.
---
🔼 📈 Bullish Scenario – Potential Reversal in Sight:
If the support holds and bullish structure forms (e.g., bullish engulfing, morning star, or higher high breakout), we could see:
1. A strong rebound from the demand zone ($0.21–$0.23), signaling buyer strength.
2. Upside targets:
$0.3027 (initial resistance and trend reversal confirmation)
$0.4403
$0.5951 (strong historical resistance)
$0.7674 to $1.0797 (major psychological zones)
3. A breakout with strong volume and MA crossover (if used) would further validate the trend change.
---
🔽 📉 Bearish Scenario – Breakdown Risk:
If the support zone fails and price breaks below $0.21, the bearish trend could continue:
1. A clear breakdown below the demand zone opens room to:
$0.1700 (minor support)
$0.1300
$0.1000 (historical low and key psychological level)
2. This would invalidate the potential reversal and reinforce the broader distribution phase.
---
📊 Identified Patterns:
Range-Bound / Accumulation Phase: Price has moved sideways between $0.21–$0.44 since February, suggesting accumulation by long-term players.
Potential Double Bottom: Still forming – confirmation needed via a breakout of the neckline.
Descending Trendline Resistance: Remains overhead and may act as a strong barrier if price attempts to climb.
---
🧭 Key Things Traders Should Watch:
Monitor price reaction in the current demand zone over the next few candles.
Look for volume confirmation on any breakout.
Stay aware of Bitcoin’s trend and macro sentiment, as it may influence volatility in altcoins like PNUT.
---
📝 Conclusion:
PNUT/USDT is now trading at a crucial technical level. The price reaction here will determine the mid- to long-term direction of this asset. Traders should prepare for either a strong reversal or a significant breakdown. This area offers a strategic opportunity to assess both risk and reward potential.
#PNUTUSDT #CryptoBreakout #TechnicalAnalysis #AltcoinSetup #CryptoReversal #PriceAction #SupportAndResistance #CryptoUpdate #BullishVsBearish

$PNUT TO 2.5$ THIS RALLY?🚨 $PNUT breakout from falling wedge confirmed ❗
Target at $0.34 is done for a 70% move off the breakout✅
Now retesting the breakout zone: $0.21–$0.23
Breakout remains intact. Consolidation expected before the next explosive leg. 📈
Local breakout above $0.33 → reopens pathway to:
→ $0.50 → $0.68 → $1.00 → $1.33 → $2.00 → $2.50

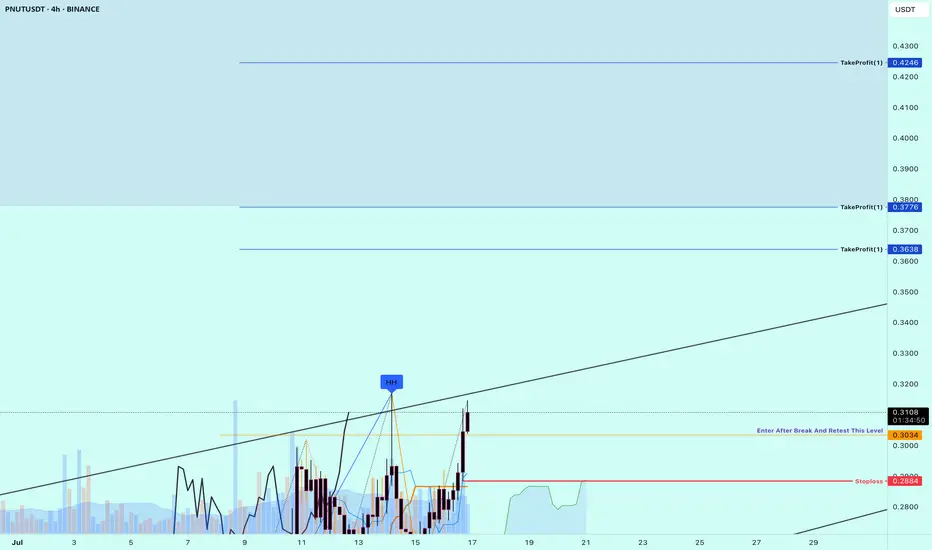
PNUT / USDT Breakout and retest analysisPnut/USDT - Breakout & Retest Analysis
Pnut/USDT has broken out from horizontal resistance, and a retest is currently in progress. If the retest holds, we can expect a strong move towards $0.4 - $0.5.
Bullish Scenario:
Successful retest and holding above the resistance zone should confirm further upside towards $0.4 - $0.5.
Bearish Scenario:
If price fails to hold the breakout level, we may see a pullback and retest of lower levels.
Pro Tip:
Avoid excessive longs. Wait for clear retest confirmation before entering.
Set proper risk management to protect your trades.
Buy Trade Strategy for PNUT: Exploring DeFi Yield Farming PotentDescription:
This trading idea is based on PNUT, the native token of the Peanut DeFi platform, which operates primarily within the SmartBCH ecosystem. PNUT plays a crucial role in powering yield farming, liquidity mining, and governance activities on the platform. With DeFi continuing to expand globally, projects like Peanut aim to offer accessible, low-cost, and efficient tools for users to participate in decentralized finance. The fundamentals of PNUT are supported by its utility, active community, and its positioning in an emerging blockchain environment with room for growth.
However, it is important to understand that PNUT operates in a highly volatile and speculative segment of the crypto market. DeFi protocols are particularly sensitive to shifts in regulation, platform security, and liquidity changes. While there may be upside potential, such assets require strict risk management and an informed investment strategy.
Disclaimer:
This trading idea is for educational purposes only and should not be considered as financial advice. Trading or investing in cryptocurrencies like PNUT involves substantial risk and may result in a complete loss of capital. Always do your own research, assess your financial situation carefully, and consult with a licensed financial advisor before making investment decisions. Past performance is not indicative of future results.
PNUTUSDT UPDATE
Pattern : Falling Wedge Breakout
Current Price: \$0.2842
Target Price: \$0.40, \$0.45
Target % Gain: 100.34%
Technical Analysis: PNUT has broken out of a falling wedge pattern on the 12H chart, signaling a bullish reversal. Volume surged on the breakout, confirming strength. Retest held well, indicating momentum for further upside.
Time Frame: 12H
Risk Management Tip: Always Use proper risk management.

Peanut the Squirrel 1315% Profits Potential · Technical AnalysisI noticed that most of the memecoins have a strong growth potential. Here we have PNUTUSDT and the potential goes easily beyond 1,300%. An easy target is set to 467% so you can imagine. The chart looks strong and you know we focus only on TA.
Good evening my fellow Cryptocurrency trader, I hope you are having a wonderful day.
Peanut the Squirrel. Who am I to judge? RWA, Layer 1, POW, Gaming, DeFi, Infrastructure, NFT, AI... The choice is yours.
Here we have the classic and more than classic higher low. The bottom low and the bullish breakout ending its retrace higher is as easy and simple as it goes. The beauty of TA. You can know where the market is headed based on how the candles behave.
And then, we are back to the EMAs. Notice the blue one because it is the main one I'll be using on the daily timeframe. The huge big candle happens to break above this level. Once this level is conquered as resistance we know the bulls are on. Now the market can rest but it can also move ahead. We have a higher low, PNUTUSDT, and the action happening above EMA89, EMA55 and EMA13; in short, the bulls win.
The next higher high and first target is $1.03. This is followed by $1.59, 467% potential for growth and then the market can continue higher, easily, because we are entering the strongest ever Cryptocurrency bull market.
Namaste.

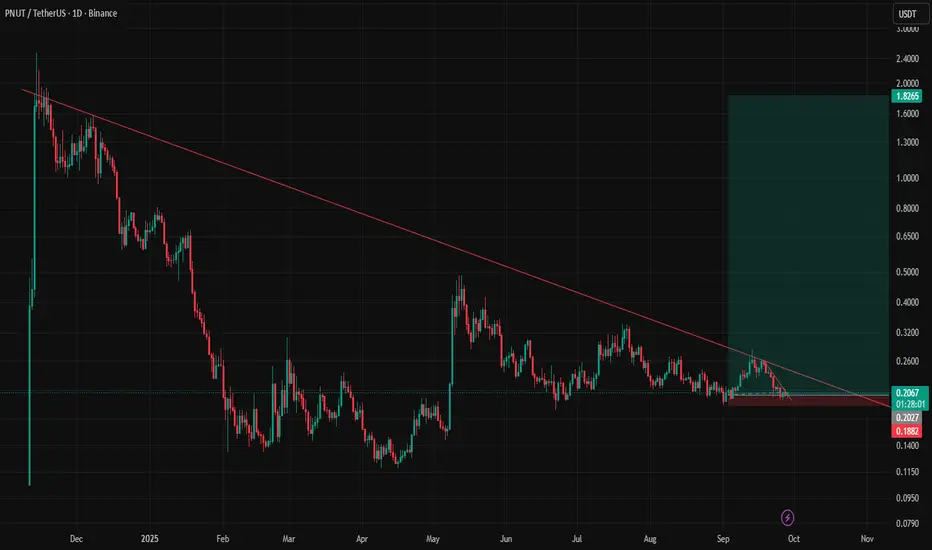
Pnutusdt buy opprotunityPNUTUSDT is showing a well defined bottoming structure, completing a rounded reversal formation. Price is currently building momentum within the buy-back zone, supported by a successful break of the mid-structure line (MSL). Continuation above the IIRL neckline could trigger the next impulsive leg toward the immediate target at 0.8526, with the final setup target projected at 1.9521. Holding above 0.1831 is critical for maintaining bullish structure.

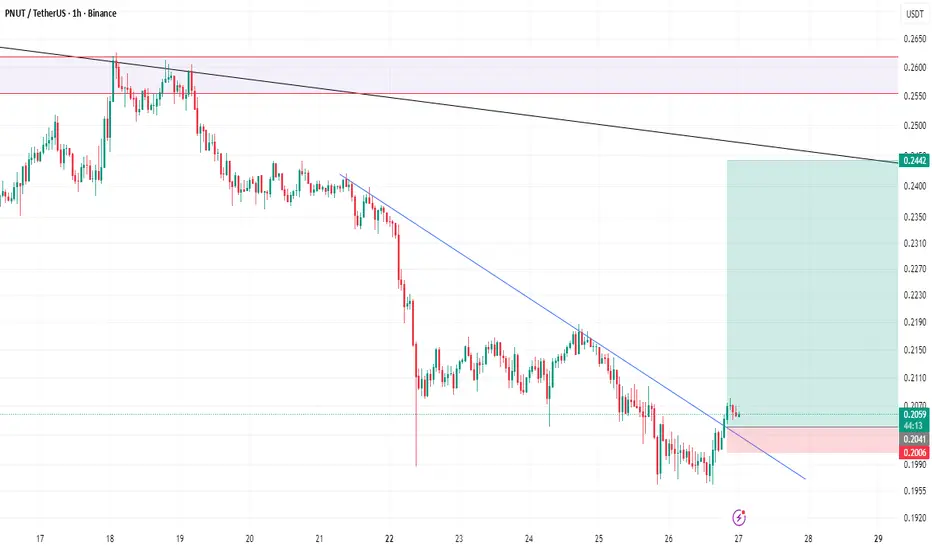
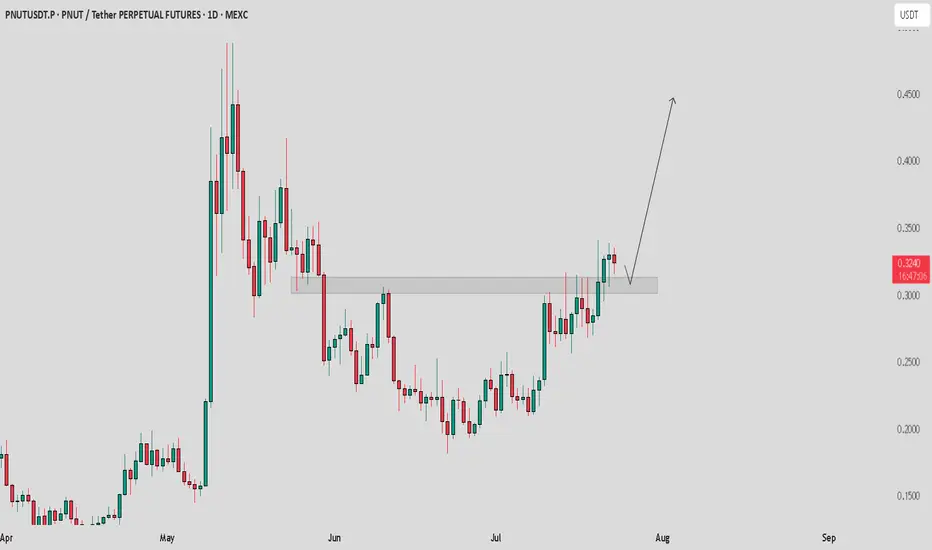
PNUT Just Broke Out – Can It Hold 0.2400?Pair: PNUT/USDT
Timeframe: 4H
Pattern: Symmetrical Triangle (Breakout Confirmed)
PNUT has broken out of the symmetrical triangle, showing early signs of bullish momentum. To confirm strength, price must now hold above the breakout zone near 0.2400.
Bullish continuation:
If it holds, we could see upside targets around 0.2700–0.3000 in the short term. Volume confirmation will be key.
Fakeout risk:
If PNUT fails to sustain above 0.2400, the breakout may fail. Stay patient for a clean retest or follow-through to avoid getting trapped.
Wait and manage risk wisely — the next few candles will confirm the move.

PNUTUSDT 12H#PNUT is on the verge of breaking out above the descending channel resistance and the SMA200 on the 12H timeframe.
In case of a breakout, the targets are:
🎯 $0.2614
🎯 $0.3109
🎯 $0.3509
🎯 $0.3908
🎯 $0.4477
🎯 $0.5202
⚠️ As always, use a tight stop-loss and apply proper risk management.

PNUT/USDT +150%PNUT has completed a breakout and successful retest of its sloping downtrend line from the previous leg, which delivered a +200% move. After a healthy 60% retracement, price action is stabilizing at a key support previous major resistance.
This is a prime opportunity to fill your bags and begin DCA entries from current market price down to $0.18. The first target sits at 0.50 for first buy setup, aligning with previous liquidity zones. If a strong bullish trend continues to develop, we could re-evaluate and extend targets for another potential +200% run.

PNUT/USDT – Bullish Rebound from Channel Support | Long SetupPNUT/USDT is currently respecting the ascending parallel channel on the 4H timeframe. Price bounced off the lower boundary of the channel, showing signs of a potential bullish continuation. A long position is entered near support, with a target toward the upper range of the channel and a tight stop loss just below the structure.
🔹 Entry: ~0.2218
🔹 Stop Loss: ~0.2140 (below channel support)
🔹 Take Profit: ~0.2521 (upper channel resistance)
🔹 Risk-to-Reward: ~4.2R
The trade aligns with the trend structure and offers a favorable R:R setup. Break of the channel may invalidate the setup.

PNUT | Meme Mania Soon?PNUT/USDT presents a compelling bullish setup on the daily timeframe. The price has been consolidating within a strong support zone (green box) and is now approaching two critical breakout levels:
Key Technical Factors:
- Price trading near descending trendline resistance
- 90-day VWAP (red line) acting as dynamic resistance around current levels
- Strong support base established in the $0.15-0.20 range
- RSI showing neutral momentum with room for upside expansion
Bullish Scenario:
A simultaneous break above both the trendline and VWAP-90 would signal a significant shift in momentum. The projected path (purple arrow) targets the upper resistance zone around $0.58-0.65, representing substantial upside potential.
Entry Strategy:
- Conservative: Wait for confirmed breakout above both levels
- Aggressive: Position ahead of breakout with tight risk management
Risk Factors:
Failure to break these levels could result in continued consolidation or retest of support. The setup requires patience as both technical barriers must be cleared convincingly for the bullish thesis to materialize.

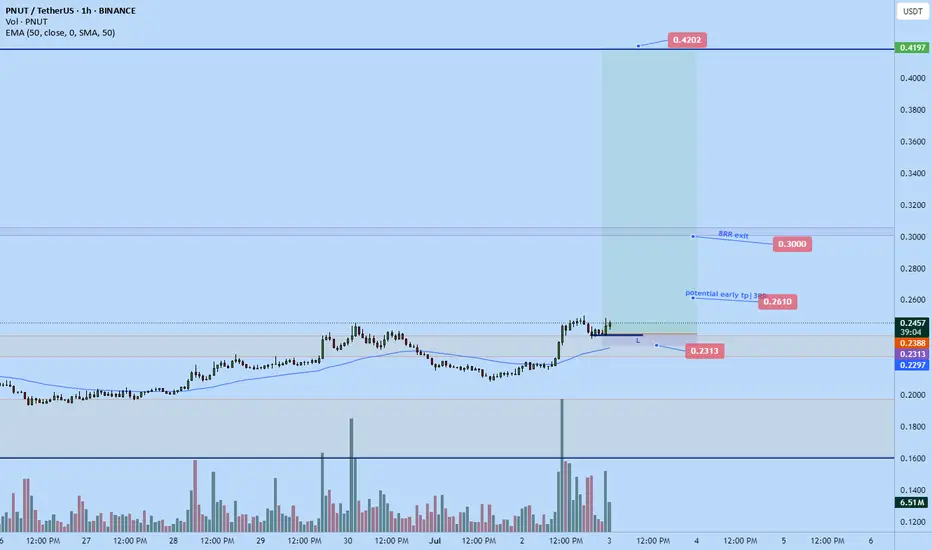
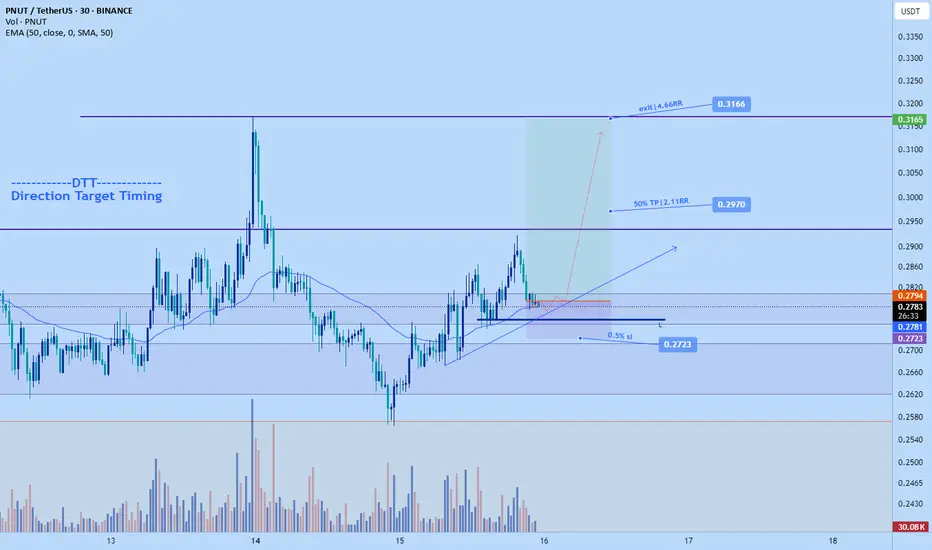
PNUT BIG BIG LONGTIme sensitive. whales are accumulating pnut, about to take off.
Based on my analysis we could pump as high as 0.42 but for today am just aiming for $0.3 which is roughly 8 RR from my entry. More than happy with that
Manage risk if following long though one could size up a little on this setup as its highly probable.
I trade price action don't know how to describe all the confluences it be too long.
DTT setup