POL - Confluence at Demand: Longs on the Trendline?POL BINANCE:POLUSDT has been overall bullish on the daily, moving inside a rising channel. Price is sliding toward the demand zone at $0.19–$0.21, right where the channel’s lower trendline comes in, clean confluence for dip buyers.
This zone is key 🔑. If bulls defend it, I’ll look for a rotation toward $0.25, then $0.29–$0.31 near the channel mid/upper bounds 🚀.
If $0.19 fails on a daily close, I’ll step aside and reassess lower before looking for fresh confirmation.
What’s your move => bid the confluence at $0.19–$0.21, or wait for strength back above $0.25 first? 🤔
⚠️ Disclaimer: This is not financial advice. Always do your own research and manage risk properly.
📚 Stick to your trading plan regarding entries, risk, and management.
Good luck! 🍀
All Strategies Are Good; If Managed Properly!
~Richard Nasr
POLUSDT.3S trade ideas

Polygon (POL): Reached Good Turning Point Before Pump | BullishPOL can give us a good turning point from here if buyers manage to get that market structure break on smaller timeframes.
More in-depth info is in the video—enjoy!
Swallow Academy

Polygon (POL): Loading For Breakout | Good Momentum After 200EMAPolygon has formed a decent bullish trend here where price is looking for a potential breakout, which would give us a very good opportunity for a long position so that's what we are looking for.
A break of 200 EMA is where buyers should establish dominance and then lead the price to upper zones!
Swallow Academy

POL LONG IDEAim taking a long position here for BINANCE:POLUSDT.P
This is risky so I'm not responsible for your losses. DYR
Entry SL TP are visible on the chart.

POLUSDT Technical Analysis (2H Timeframe)Let’s see what opportunities the market might give us to enter! ⚡️
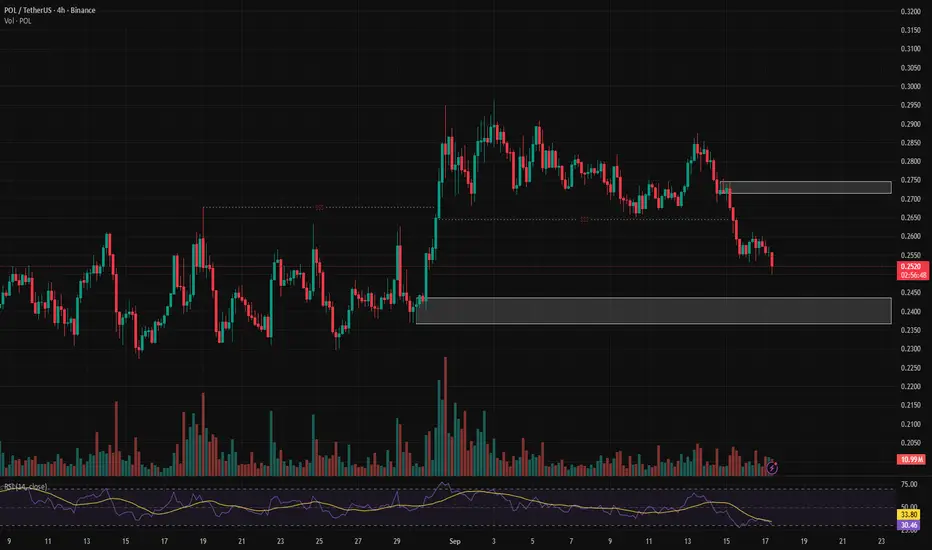
The price of POL has been in a steady downtrend after rejecting the 0.275–0.280 resistance zone. It is now approaching a strong demand zone around 0.238–0.245, where buyers have previously shown significant interest. The RSI is near the oversold area, indicating potential for a short-term relief bounce if buyers step in.
🔹 Key Support Zone: 0.238 – 0.245
🔹 Key Resistance Zone: 0.275 – 0.280
🔹 Likely Scenario: Further drop into the demand zone followed by a possible bullish reaction
⚠️ This analysis is for educational purposes only and should not be considered as financial advice. Always use proper risk management.
POL USDT LONG TRADE SETUPNew Trade Setup: POL-USDT
LONG
Entry: 0.2590 or CMP
Target: TP1: 0.2686, TP2: 0.2783, TP3: 0.2879, TP4: 0.2975
Stoploss: 0.2288
Leverage: 1X
Technical Analysis: POL/USDT is taking support from its support area there is high change of short term of trend reversal, we can see up trend in short term.

matic analysis chart for IRANIANHello dear people of Iran, all the details are clear in the film, and I said that because it is the first time, there are some shortcomings that you should forgive for your greatness. In short, watch it, enjoy it, like it, if you don't enjoy it, sacrifice your head.

POLYGON is best to Bet for ETHHello everyone,Polygon provides compatibility with EVM (Ethereum), which is a big advantage for developers who want to transfer or use existing code.
is a rival to Solana that assists ETH to make transactions faster and cheaper. this time we will not miss a big opportunity, polygon is also owned by softbank. then the best bet at the moment for ETH support is Polygon for me.
Actually the target is high. it can be up to 3-4 dollars, but again, I think the first line that we need to know that it will be support later is around 0.46 USD.
hope the current information is useful for you.
thank you and good luck.

POL/USDT – LPL SetupPOL/USDT – LPL Setup
Price failed to create a new FVG and instead formed a Low Probability Leg (LPL) on this time-frame.This LPL may act as a discount array for a potential move higher.
🚩 Invalidation: If the Daily FVG breaks with a clear breakaway candle, this setup is void.

POL will finally break through??Let’s take a look at POL.
After a long period of sideways movement, the coin finally broke out to the upside. This gives a high probability that, after a small retest, the price will continue upward. What makes me think this way is the strong daily (1D) candle with large volume that broke resistance by itself. To me, the chart looks very positive.
Firstly, a lot of volume has gathered around 0.261, which is now acting as a resistance-turned-support zone. At this exact level, we also have the VAH (Value Area High), shown as the long blue line. Fibonacci retracement levels also support this zone, since we have the 0.5 and 0.686 levels from two different measurements lining up there.
Of course, there’s also a volume gap on the daily candle, and the 0.5 retracement of the large green weekly (1W) candle hasn’t been tested yet. I also assume that bullish divergences will eventually add momentum and help fill this move.
Another possible scenario is if we see a deeper retracement before the pump. In that case, one more zone to look for long opportunities is 0.239–0.248. Here we have:
• the 0.5 and 0.314,0.222 zone from another measurement
• the POC (Point of Control), which aligns with the VAH I mentioned above
• confluence with VWAP, which should meet price exactly at the orange zone
In my opinion, both ranges are strong, and where price eventually finds support depends on how much volume sellers put into the move down.
The last possible support is 0.223–0.215, but I’m not really considering it for now since it’s quite far below the current price.
My plan:
• First entry around 0.26, with stop loss at 0.253
• If that level fails, I’ll look for another entry somewhere in the middle of the zone below, with stop loss placed under it
• Current target: 0.36, but I’ll be watching price action closely
Thanks for taking your time and reading it hope i helped a little.

POL - BULLISH WAVE AWAITEDASX:POL - similar view; I think that a new wave upward is gonna start with this configuration!
Key demand zone to be maintained: 0.2450$

POL - ready to fly!GM TEAM!
I see a Beautifull bullish candle close H4 on PSX:POL 📈
Time to moon?? 🚀

Polygon (POL): Do Not Miss This One | Bullish AFPSX:POL looks very bullish; if you miss this one, honestly, you are lacking fundamentals!
More in-depth info is in the video—enjoy!
Swallow Academy

POLUSDT — Grinding Higher, Testing the 0.29 LidPOL price has been walking up the stairs slowly, but every time it reaches the 0.29 landing, someone slams the door. Let’s map what matters next.
High Timeframes (Weekly → 2D → 12H)
– Weekly: Base from 0.24–0.25, steady HLs. Supply overhead 0.28–0.30. Next 0.315–0.335 if cleared.
– 2D: HH/HL structure intact. Resistance 0.285–0.295, 0.305–0.315. Support 0.262–0.268, then 0.248–0.252.
– 12H: Active 0.26–0.29 range. >0.289 = upside 0.300–0.305 (extension 0.315–0.325). <0.262 = rotate 0.25.
Volume Context
– Biggest build 0.26–0.28.
– Thin prints 0.29–0.30 = fast travel zone if accepted above.
– Slip back under 0.268–0.272 usually reverts to 0.25.
Derivatives (Velo)
– OI up but not blown out.
– Funding neutral to mildly negative.
– CVD down month-long but HLs intact → potential squeeze setup if resistance clears.
– Liquidations modest.
Conclusion
POL remains constructive while ≥0.268 holds. Above 0.289 → 0.300–0.305. Below 0.262 = 0.25 retest.
💡 Pro Tip: In these grind-up structures, breakout scalps only work if you respect failure triggers. When price rejects a lid, it often mean-reverts back to the strongest volume shelf.
Candle Craft | Signal. Structure. Execution.

185 Days range breakout & retest complted! - BullishPSX:POL - SPOT → TP1 ✅ → 6.5% up already 🔥
Following my lines, bull flag on the daily basis, corresponding to the 185 days range area retest!
20 - 30% pump could be see soon 📈
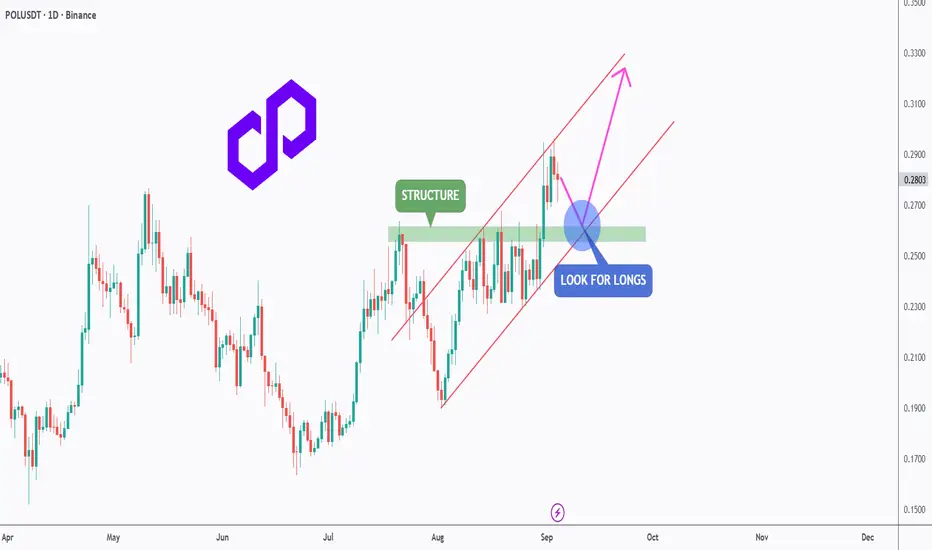
POL - Retest the Channel, Reload for the Next Leg!POLUSDT has been trading inside a clean ascending channel 📈, respecting both support and resistance levels.
After a strong push upward, price is now pulling back toward the previous structure zone around 0.26 – 0.27, which aligns perfectly with the lower bound of the channel.
This area forms a strong confluence (structure + channel support) 🔑, making it an ideal spot to look for long opportunities. As long as this zone holds, bulls 🐂 could regain control and push price toward the next resistance levels in the 0.32.
Patience here is key ⏳ — waiting for confirmation before entering can set up a high-probability continuation trade.
⚠️ Disclaimer: This is not financial advice. Always do your own research and manage risk properly.
📚 Always follow your trading plan regarding entry, risk management, and trade management.
Good luck!
All Strategies Are Good; If Managed Properly!
~Richard Nasr
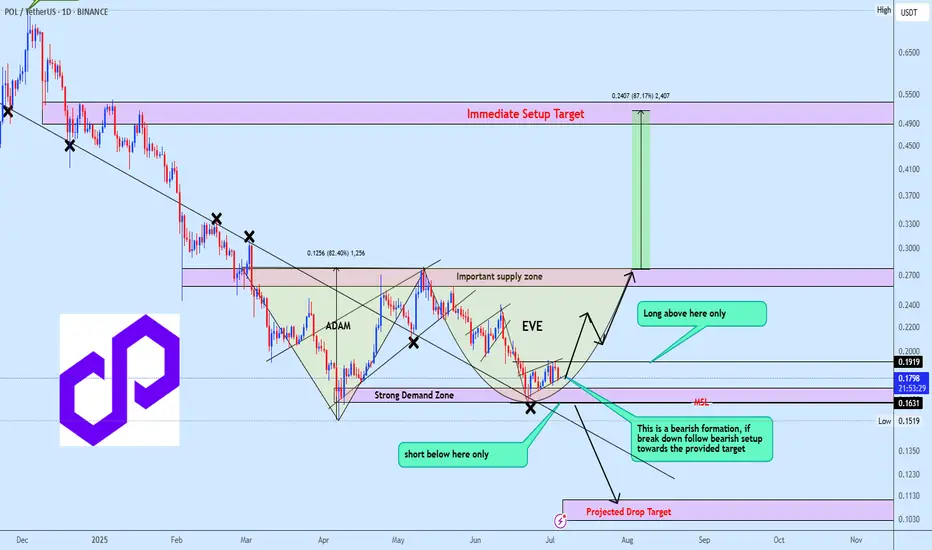
POLUSDT reversal time or bearish ContinuationPOLUSDT is currently shaping a potential Adam and Eve formation, with price consolidating inside a mini bearish flag. A breakdown from the flag would invalidate the bullish setup and likely trigger a continuation toward the projected downside target.
However, if the strong demand zone holds, we could see a bullish reversal unfold, confirming the Adam and Eve structure and opening the path toward the upside projection highlighted on the chart.
At this stage, the focus is on confirmation, not speculation. Waiting for price to validate direction will be key to positioning correctly in this setup.
ArmaX Smart Money Lite | First Public Release🚀 Introducing ArmaX Smart Money Lite
ArmaX Smart Money Lite is the first public release from the ArmaX project, designed around *Smart Money* concepts.
This indicator helps you detect capital inflow and outflow on key candles and flag the very first candle that starts a bullish or bearish leg.
🔑 Features:
- Detects money inflow/outflow (Smart Money activity)
- Flags institutional-style impulse candles
- Focus on key trend-shifting candles
- Lightweight & free public version
⚡ This is just a **preview release**.
The upcoming **Pro version** will include:
✅ On-chain data integration
✅ Order Block detection
✅ Advanced filtering to reduce false signals
✅ Professional dashboard
#ArmaX #SmartMoney #Crypto #Indicator #TradingStrategy #LiteVersion #TechnicalAnalysis

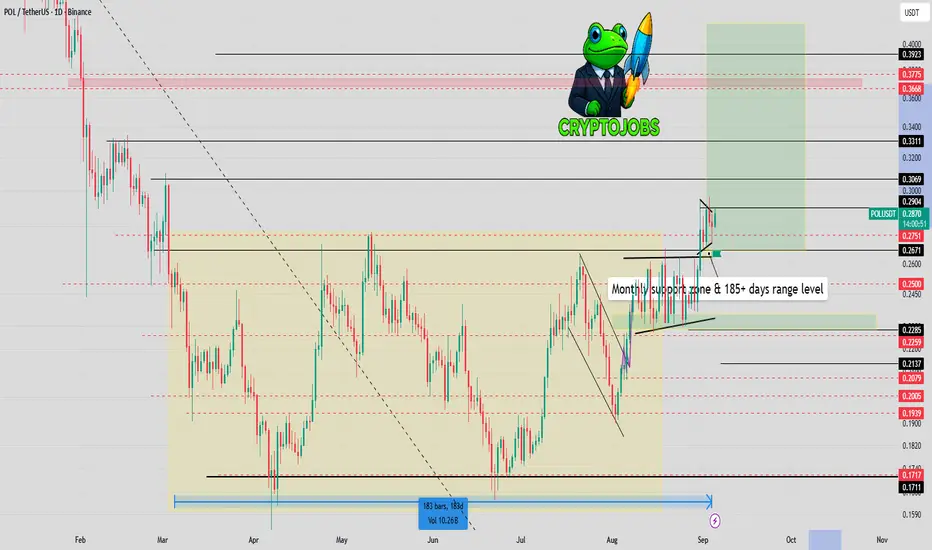
Ready for the POL RallyAfter 180 days of being in a range and below the resistance line, the BINANCE:POLUSDT has finally broken the resistance area and given us the confirmation we need to ascend to higher prices.
However, before the move starts, I would like it to return to the box marked in green on the chart and then begin its upward movement. For the long-term targets, I have marked two red lines, which could be the long-term goals. There is also a possibility that it could reach these targets quickly with sharp moves.
⛔ This is not financial advice; do your own research.

POL breakout POL has been consolidating sideways since March 2025 and is now showing a breakout above 0.26 and 0.28. To account for potential stop hunts during volatile swings, we’ll anchor support at 0.26 instead of 0.28. As long as the price holds above 0.26, the breakout remains intact.

PolyganPolygon is a very strong platform and network, and it is expected that the crypto world will rely more on it in the future. Today, considering its technical potential and quality, and comparing it to its market value, as well as taking into account the market value of similar coins, expecting a price surge for it doesn’t seem far-fetched. I’ve always believed that there’s no exact number for predictions, as everything depends on market conditions, but it seems that the $0.5 mark would be easily achievable for it.

POL/USDT Trade Idea💎 BINANCE:POLUSDT Trade Idea 💎
📊 Pattern spotted: Double Bottom ✅
This setup indicates strong support around 0.2800 and signals a possible bullish reversal.
⚡ Entry (Advanced): 0.2860 – 0.2870
🎯 Target (TP): 0.2960
🛡️ Stop Loss (SL): 0.2800
✨ Risk/Reward: Low Risk – High Profit 🚀
This is an advanced entry with tight SL and strong upside potential.
📈 If the neckline breaks and sustains above, we can expect a bullish move towards the target.
🔑 Summary: Double Bottom gives confidence of reversal 📉➡️📈. Perfect setup for traders who like low loss & high reward opportunities.

POL/USDT – Knocking on the Door of Breakout TerritoryHey there! I'm back on track again :-)
Date: September 2, 2025
POL has been quietly coiling for months, and now it’s pressing right against a key resistance wall. The setup is starting to look like the calm before the storm.
🔍 Technical Snapshot:
Current Price: $0.286
EMA Levels:
4EMA: $0.256
50EMA: $0.238
100EMA: $0.220
200EMA: $0.225
👉 Price is finally trading above all major EMAs for the first time in a while — a textbook early signal of a trend reversal.
📊 Chart Structure & Price Action:
For months, POL has been trapped under the $0.28–0.29 resistance zone.
Each dip has been shallower, forming a staircase of higher lows — a sign of buyers building pressure.
Today’s candle is poking above resistance, showing the market is testing supply.
📉 Supports to Watch:
$0.256 (4EMA, immediate support)
$0.238 (50EMA support)
$0.22 (100/200EMA cluster – strong demand zone)
📈 Targets if Breakout Confirms:
First stop: $0.3915
Next supply zone: $0.4752
Major extension target: $0.5610
📊 Volume & Momentum:
Volume spike today suggests smart money participation.
RSI is trending bullish, but not yet overbought — leaving room for expansion.
🎯 Creative Bullish Outlook:
Think of POL like a spring being compressed for months under that $0.29 lid. Each push lower was weaker than the last, while buyers kept showing up. Now, with volume flowing in, that lid might finally pop.
If price clears $0.29 convincingly, it could ignite a chain reaction of stops and fresh entries, fueling a run toward $0.39 and beyond.
📉 Invalidation:
A rejection and drop back under $0.238 would put the breakout thesis on hold.
Losing $0.22 would flip the chart bearish again.
⚡ Summary:
POL is at a make-or-break level. A confirmed breakout above $0.29 could kickstart a multi-stage rally, targeting $0.39 → $0.47 → $0.56.
