POLYX/USDT — Critical Support: Will It Bounce or Break Down?🔎 Overview
The POLYX/USDT (1W, Binance) chart is currently testing a major historical support zone around $0.0982 – $0.1267. This level has repeatedly absorbed selling pressure over the past two years, making it a psychological and technical pivot that could determine the next big move.
The macro

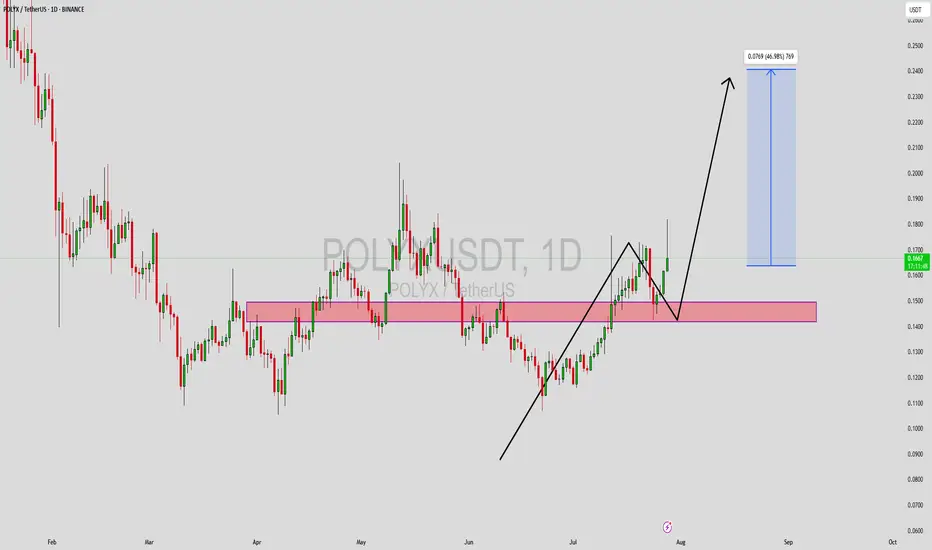
POLYXUSDT.P LONGI am thinking that this will make an inverse head and shoulder.
Lets wait and confirm the pattern.
Only bullish pattern and candle sticks with volume will give us the confirmation..
Lets wait for the confirmation,,
Keep following me guys to post as much as i can do for you guys..
And you gu

POLYXUSDT Forming Falling WedgePOLYXUSDT is currently showcasing a falling wedge pattern, a well-known bullish reversal setup that typically precedes a strong upward breakout. The chart structure reflects tightening price action with lower highs and lower lows, forming a wedge that has now broken to the upside. This pattern, coup
POLYXUSDT 1W AnalysisPOLYX ~ 1W Analysis
#POLYX This is the lowest support for now. Buy from here with a short term target of at least 20%+ from this support.

POLYX: Primed for a Bounce? Long Opportunity at Channel Support.Greetings, fellow traders,
An interesting setup is forming on the BINANCE:POLYXUSDT chart. The price is currently situated near the lower boundary of an established ascending channel, suggesting a potential support zone.
We are identifying a potential long entry under the following conditions:

POLYX Daily Setup – Uptrend or Pullback Ahead?
🔥 POLYX Daily Chart Watch
📈 POLYX is currently forming an ascending channel on the daily timeframe.
👀 Keep an eye on potential continuation upwards or a test of the lower boundary for a bounce.
🚀 Key moves at the channel boundaries will be crucial—watch closely!

POLYXUSDT PERFECT LONG IDEAPOLYXUSDT is looking bullish and will look for long from lower internal liquidity FVG area.

POLYX/USDTKey Level Zone: 0.14320 - 0.14450
HMT v8 detected. The setup looks promising, supported by a previous upward/downward trend with increasing volume and momentum, presenting an excellent reward-to-risk opportunity.
HMT (High Momentum Trending):
HMT is based on trend, momentum, volume, and market str

POLYXUSDT 1WPOLYX ~ 1W Analysis
#POLYX Buy gradually from here with a short -term target of at least 20%+. This is the lowest support for now.

POLYXUSDT | Critical Decision Zones!POLYXUSDT has shown clear signs of distribution, and unfortunately, there is no bullish confirmation at the moment. The price failed to gain strength during this process, signaling potential weakness.
🔴 Short Opportunities at Resistance:
Red boxes mark key resistance zones where sellers are likely

See all ideas
Summarizing what the indicators are suggesting.
Oscillators
Neutral
SellBuy
Strong sellStrong buy
Strong sellSellNeutralBuyStrong buy
Oscillators
Neutral
SellBuy
Strong sellStrong buy
Strong sellSellNeutralBuyStrong buy
Summary
Neutral
SellBuy
Strong sellStrong buy
Strong sellSellNeutralBuyStrong buy
Summary
Neutral
SellBuy
Strong sellStrong buy
Strong sellSellNeutralBuyStrong buy
Summary
Neutral
SellBuy
Strong sellStrong buy
Strong sellSellNeutralBuyStrong buy
Moving Averages
Neutral
SellBuy
Strong sellStrong buy
Strong sellSellNeutralBuyStrong buy
Moving Averages
Neutral
SellBuy
Strong sellStrong buy
Strong sellSellNeutralBuyStrong buy
Displays a symbol's price movements over previous years to identify recurring trends.