#POND/USDT Forming Bullish Momentum#POND
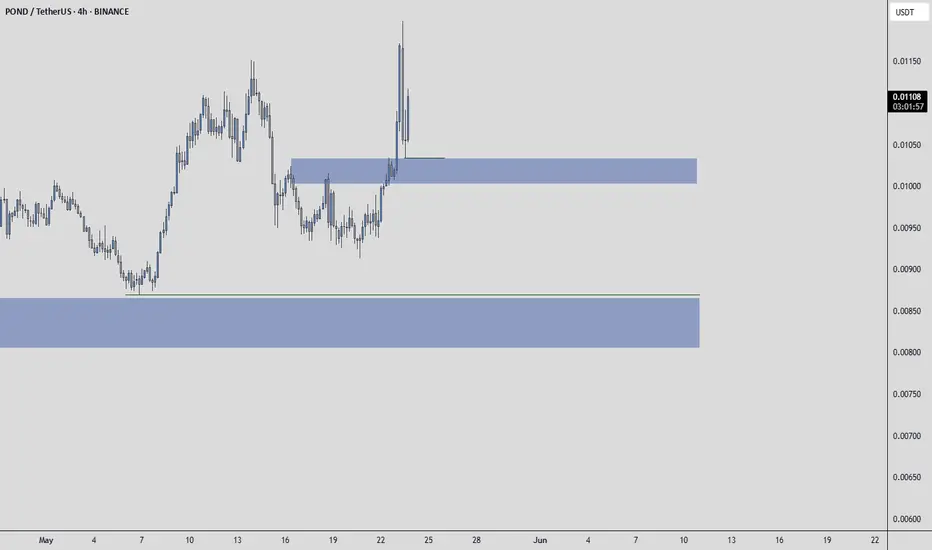
The price is moving within a descending channel on the hourly timeframe. It has reached the lower boundary and is heading towards a breakout, with a retest of the upper boundary expected.
The Relative Strength Index (RSI) is showing a downward trend, approaching the lower boundary, and an up
Related pairs

POND/USDT - Trendline Still in Control, Will Support Hold?On the daily timeframe, POND/USDT remains in a clear bearish trend. Price continues to form lower highs and lower lows, while trading below a well-respected descending trendline that has been tested multiple times and has not yet been broken.
Currently, price is positioned below the trendline, near


POND/USDT — Accumulation at Demand Zone, Reversal or Breakdown?📝 Full Narrative Analysis
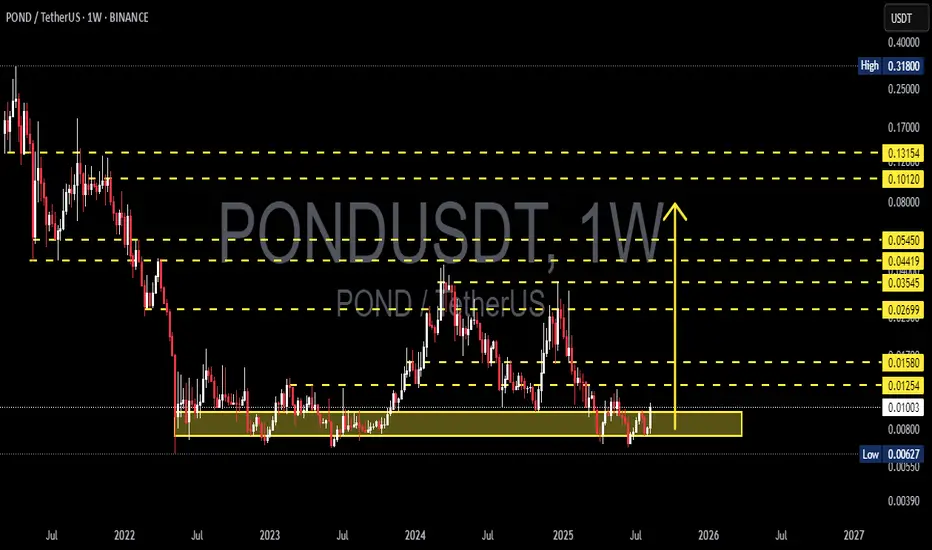
POND/USDT on the weekly timeframe is currently at a decisive point. Since its peak in 2021, price has been in a long-term downtrend. However, what stands out is that since early 2022, POND has consistently held within the strong demand zone between 0.006–0.010 (highlighted

POND (SPOT)BINANCE:PONDUSDT
#POND/ USDT
Entry range (0.00800- 0.00880)
SL 4H close below 0.00760
T1 0.0100
T2 0.0128
T3 0.0149
_______________________________________________________
Golden Advices.
********************
* collect the coin slowly in the entry range.
* Please calculate your losses before

PONDUSDT — Multi-Year Base, Preparing for Potential Reversal?🔎 Overview
The PONDUSDT (1W, Binance) chart shows a long-term accumulation phase since 2022. Price has repeatedly bounced from the strong demand zone at 0.008–0.011, with the historical low marked at 0.00627. This zone acts as a “last line of defense” for buyers.
If this level continues to hold, P
POND/USDT AT A BREAK LEVELPOND/USDT: If it breaks and holds above $0.00938 with confirmation, it could get interesting over time. For now, I’m just watching to see how it behaves; without confirmation, it remains risky.
When it's able to confirm the $0,00938 with confirmation, the coin could break to up $0,012
We will follo

PONDUSDT 1W Analysis POND ~ 1W Analysis
#POND This is the lowest support for now. Buy on a retest of this support block with a short term target of at least 15%+ from here.

PONDUSDT | Buyers Showing Real PresenceUnlike many altcoins, PONDUSDT is showing clear signs of buyer strength. The blue boxes below represent well-defined demand zones that could reward patient entries.
If you prefer waiting for price to pull into those zones, you're thinking long-term. But even entering here with a market buy isn’t a
Pondusdt Buy opportunityThe previously discussed breakout from the wedge structure on POND propelled the price toward the projected target.
Following this move, a deep corrective phase ensued, bringing the price into a key support zone. This area of interest is expected to serve as a strong re-accumulation zone, while t

See all ideas
Summarizing what the indicators are suggesting.
Oscillators
Neutral
SellBuy
Strong sellStrong buy
Strong sellSellNeutralBuyStrong buy
Oscillators
Neutral
SellBuy
Strong sellStrong buy
Strong sellSellNeutralBuyStrong buy
Summary
Neutral
SellBuy
Strong sellStrong buy
Strong sellSellNeutralBuyStrong buy
Summary
Neutral
SellBuy
Strong sellStrong buy
Strong sellSellNeutralBuyStrong buy
Summary
Neutral
SellBuy
Strong sellStrong buy
Strong sellSellNeutralBuyStrong buy
Moving Averages
Neutral
SellBuy
Strong sellStrong buy
Strong sellSellNeutralBuyStrong buy
Moving Averages
Neutral
SellBuy
Strong sellStrong buy
Strong sellSellNeutralBuyStrong buy
Displays a symbol's price movements over previous years to identify recurring trends.
Frequently Asked Questions
The current price of POND / TetherUS (POND) is 0.00263 USDT — it hasn't changed in the past 24 hours. Try placing this info into the context by checking out what coins are also gaining and losing at the moment and seeing POND price chart.
POND / TetherUS price has fallen by −1.88% over the last week, its month performance shows a −33.92% decrease, and as for the last year, POND / TetherUS has decreased by −80.05%. See more dynamics on POND price chart.
Keep track of coins' changes with our Crypto Coins Heatmap.
Keep track of coins' changes with our Crypto Coins Heatmap.
POND / TetherUS (POND) reached its highest price on Apr 5, 2021 — it amounted to 0.31800 USDT. Find more insights on the POND price chart.
See the list of crypto gainers and choose what best fits your strategy.
See the list of crypto gainers and choose what best fits your strategy.
POND / TetherUS (POND) reached the lowest price of 0.00243 USDT on Feb 6, 2026. View more POND / TetherUS dynamics on the price chart.
See the list of crypto losers to find unexpected opportunities.
See the list of crypto losers to find unexpected opportunities.
The safest choice when buying POND is to go to a well-known crypto exchange. Some of the popular names are Binance, Coinbase, Kraken. But you'll have to find a reliable broker and create an account first. You can trade POND right from TradingView charts — just choose a broker and connect to your account.
Crypto markets are famous for their volatility, so one should study all the available stats before adding crypto assets to their portfolio. Very often it's technical analysis that comes in handy. We prepared technical ratings for POND / TetherUS (POND): today its technical analysis shows the sell signal, and according to the 1 week rating POND shows the sell signal. And you'd better dig deeper and study 1 month rating too — it's sell. Find inspiration in POND / TetherUS trading ideas and keep track of what's moving crypto markets with our crypto news feed.
POND / TetherUS (POND) is just as reliable as any other crypto asset — this corner of the world market is highly volatile. Today, for instance, POND / TetherUS is estimated as 1.54% volatile. The only thing it means is that you must prepare and examine all available information before making a decision. And if you're not sure about POND / TetherUS, you can find more inspiration in our curated watchlists.
You can discuss POND / TetherUS (POND) with other users in our public chats, Minds or in the comments to Ideas.