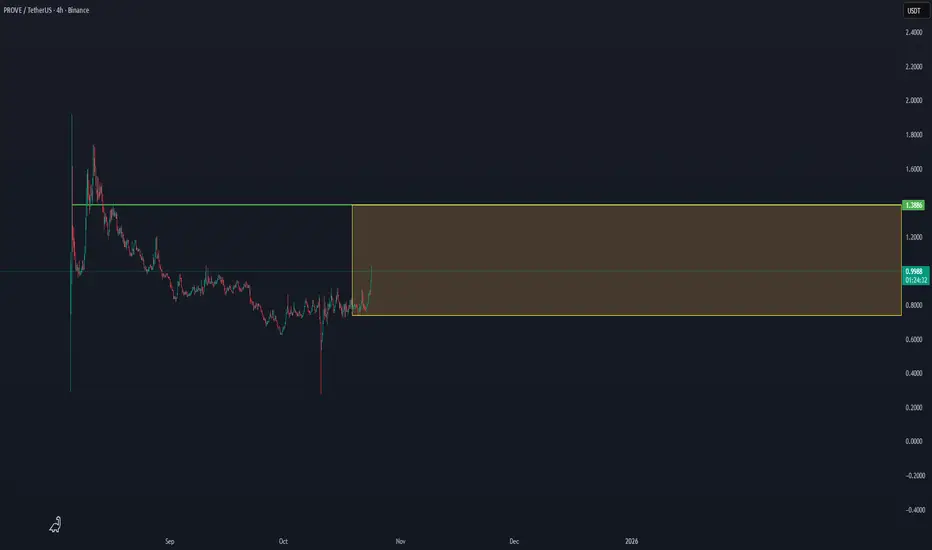
PROVE/USDT — Volume Range Expansion Forming, Eyeing $1.38 PROVE/USDT — Volume Range Expansion Forming, Eyeing $1.38 Breakout 🚀
Prove Network (PROVE) is gaining momentum after a long accumulation phase, now trading near the mid-point of its volume box between $0.74 – $1.38.
This structure indicates a potential accumulation-to-expansion pattern, where susta
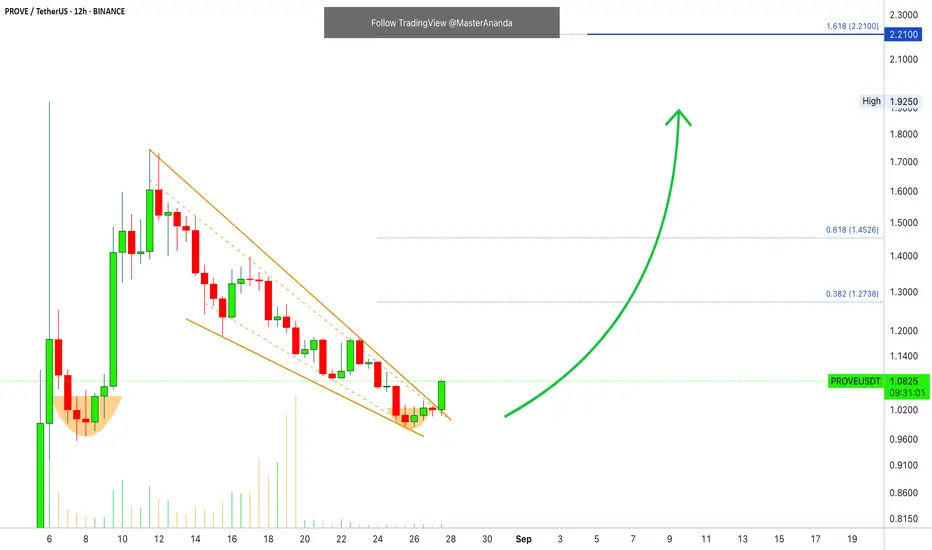
PROVEUSDT Forming Falling WedgePROVEUSDT is displaying a falling wedge pattern, one of the most reliable bullish reversal formations in technical analysis. This pattern often signifies that downward momentum is losing strength and that a potential trend reversal to the upside may be imminent. The price action within the wedge sug

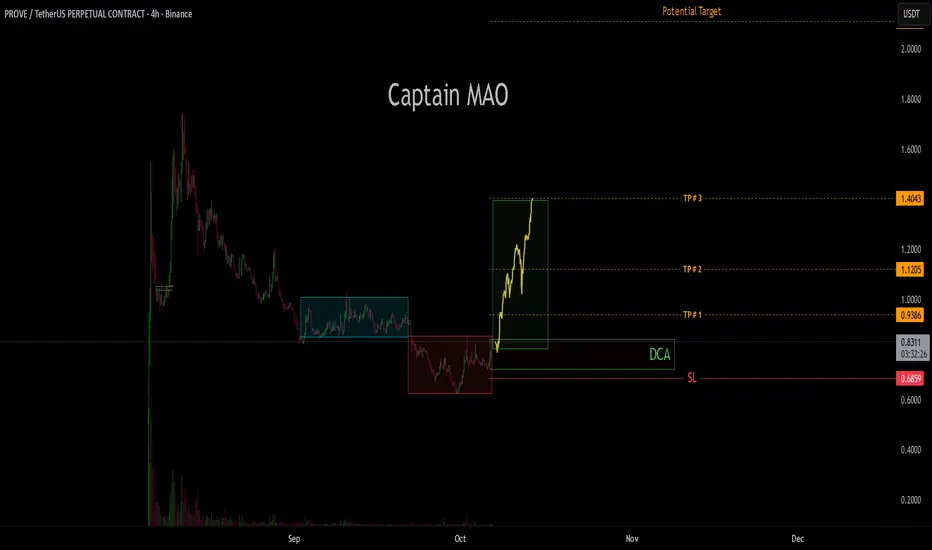
PROVE/USDT – Distribution and Manipulation Phases Complete, Expa
PROVE has completed a clear three phase market cycle distribution, manipulation, and now expansion. After a prolonged period of supply absorption and structural manipulation near the lows, price action is showing early signs of trend reversal and expansion readiness.
PROVEUSDT UPDATE#PROVE
UPDATE
PROVE Technical Setup
Pattern: Bullish falling wedge breakout
Current Price: $0.7489
Target Price: $1.41
Target % Gain: 85.91%
$PROVE is breaking out of a falling wedge pattern on the 1D timeframe. The breakout suggests strong bullish momentum with a target near $1.41, offering nea

PROVEUSDT Forming Falling WedgePROVEUSDT is showing a classic falling wedge pattern, which is one of the strongest bullish reversal signals in technical analysis. This structure forms when price action trends lower while converging within a narrowing channel, suggesting that bearish momentum is fading and bulls are preparing to t

PROVEUSDT Forming Bullish ContinuationPROVEUSDT is showing a strong bullish continuation pattern, signaling the possibility of a powerful upward move in the coming days. After consolidating within a well-defined range, the breakout structure is now becoming clear, with price action building momentum. The setup suggests that the pair has

Prove Possible buying zoneBINANCE:PROVEUSDT has reached a good support area and has shown a positive reaction once, and most likely after the retest we can expect a good rise to $1.3.
⛔ Disclaimer: No Guarantee of Profit or Loss
Please be aware that all investments, trading, and financial decisions involve risk. The info

Prove · Futures Trade-NumbersHere we have an easy chart setup. It will be a great one with Bitcoin just turning green. This whole market is about to blow up.
The chart is good here PROVEUSDT. We have a perfect falling wedge pattern, with the trend-lines matching perfectly the candle wicks. What's better is the current bullish
PROVE : PROVE Find out.Hello friends🙌
✅We have come with an analysis of the PROVE currency, which has just been listed and is in a good range. If this pattern fails, you can enter a purchase transaction in steps and with risk and capital management. We have also specified the stop loss for you and the targets are also sp

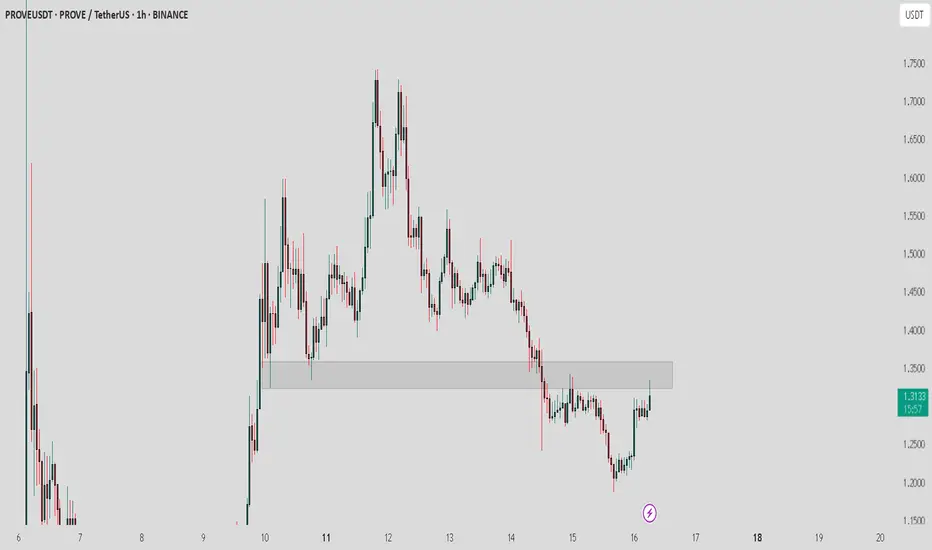
PROVE / USDT : Testing horizontal resistancePROVE/USDT - Testing Horizontal Resistance
PROVE/USDT is currently facing horizontal resistance. Keep a close watch as a strong breakout above this level could trigger a significant move towards $1.5 - $1.7.
Stay alert for confirmation of the breakout for the next potential upward move.
See all ideas
Summarizing what the indicators are suggesting.
Oscillators
Neutral
SellBuy
Strong sellStrong buy
Strong sellSellNeutralBuyStrong buy
Oscillators
Neutral
SellBuy
Strong sellStrong buy
Strong sellSellNeutralBuyStrong buy
Summary
Neutral
SellBuy
Strong sellStrong buy
Strong sellSellNeutralBuyStrong buy
Summary
Neutral
SellBuy
Strong sellStrong buy
Strong sellSellNeutralBuyStrong buy
Summary
Neutral
SellBuy
Strong sellStrong buy
Strong sellSellNeutralBuyStrong buy
Moving Averages
Neutral
SellBuy
Strong sellStrong buy
Strong sellSellNeutralBuyStrong buy
Moving Averages
Neutral
SellBuy
Strong sellStrong buy
Strong sellSellNeutralBuyStrong buy