Sniper Entry For $PUMPFor this, you can set orders around the $0.0063 area. Liquidity might get tapped around that region before the next leg up.

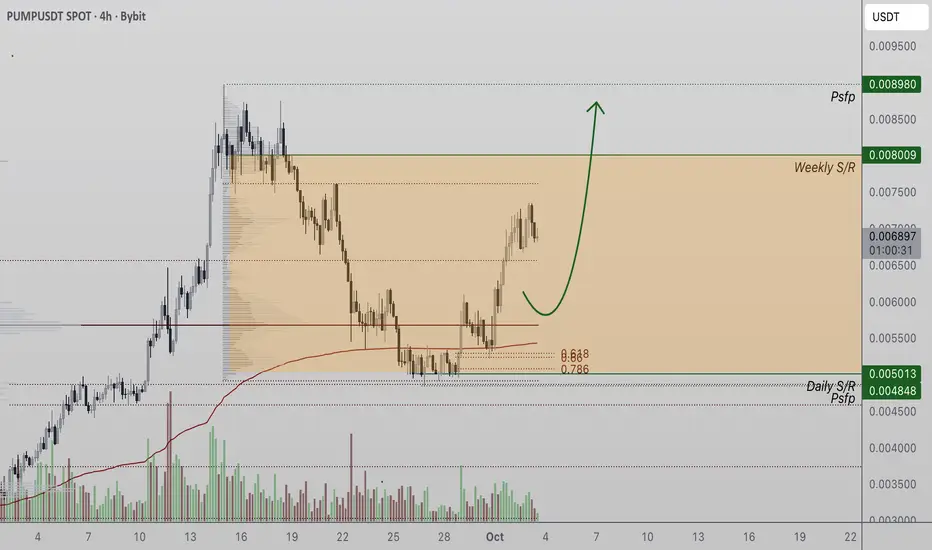
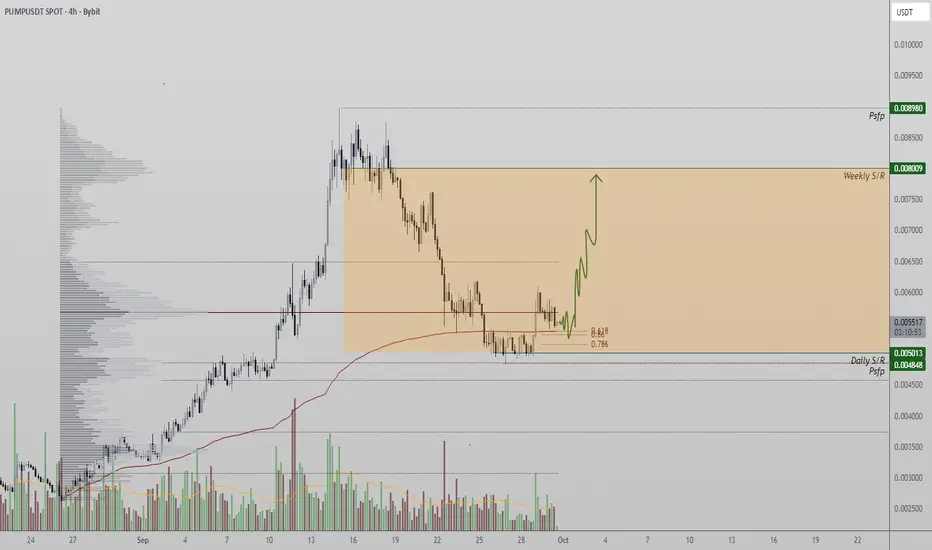
PumpToken Defends Support and Eyes Higher RotationPumpToken has staged a bullish rebound from a critical daily support level that aligned with the 0.618 Fibonacci retracement and a VWAP flip. This reaction has powered price into higher timeframe resistance, with bulls now eyeing continuation if momentum sustains.
The recent price action on PumpTok
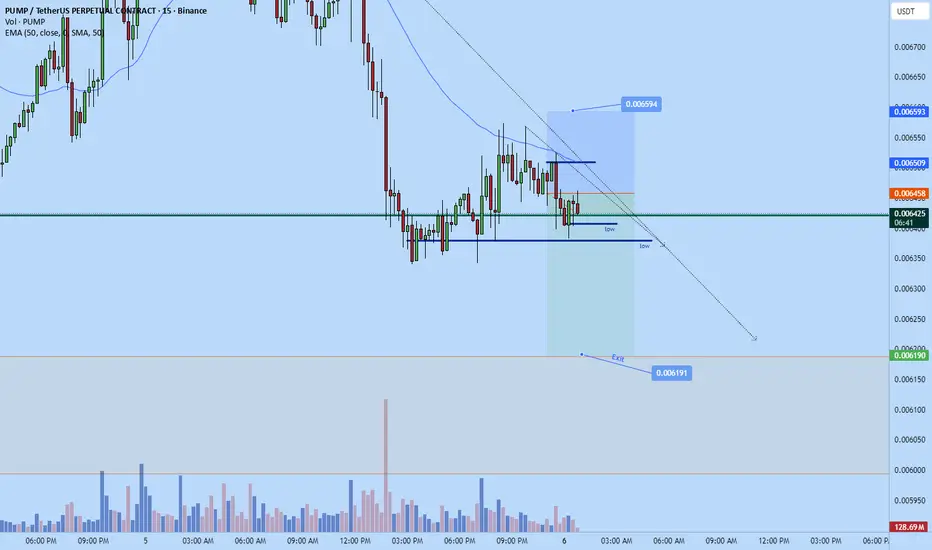
Pumpcoin short to $0.0061Just opened a new short awhile ago on pumpcoin.
Sl: 0.006985
TP: 0.0061
Exit area though is around $0.006145, Prior resistance on daily might get some demand there .
Yall if interested can perhaps used a tigher sl but preferably above $0.006985

PUMPUSDT Forming Bullish WavePUMPUSDT is showing strong bullish signs as it forms a bullish wave pattern, which often signals the continuation of upward momentum in the market. The chart setup reflects a healthy recovery from consolidation zones, supported by strong buying pressure and increasing market participation. With good
PUMP | Technical & Fundamental InsightsDescription:
PUMP has recently shown increased market attention, reflecting growing community interest and speculative momentum. From a fundamental perspective, this asset is highly driven by sentiment, liquidity inflows, and overall market conditions rather than traditional intrinsic value. Monito

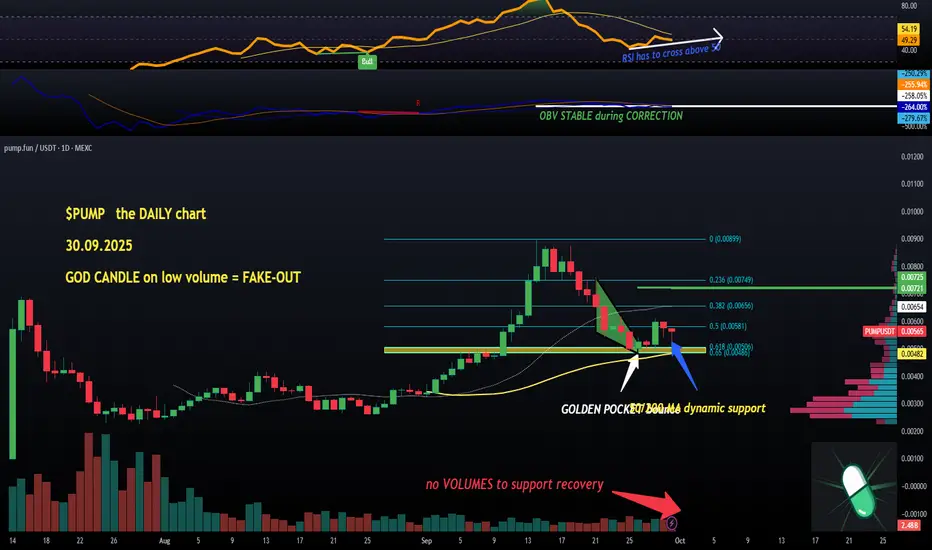
$PUMP (1-day): GOD CANDLE + LOW VOLUME = FAKE-OUT?NYSE:PUMP had a GOD CANDLE (16%+ in marketcap, currently at $1.97B) last Sunday and many people rushed in while I stood by and red-flagged that whole surge as suspicious due to low volumes.
And it turned out to be a fake-out which trapped many bulls around 0.6c.
So now, looking at the heatmap (la
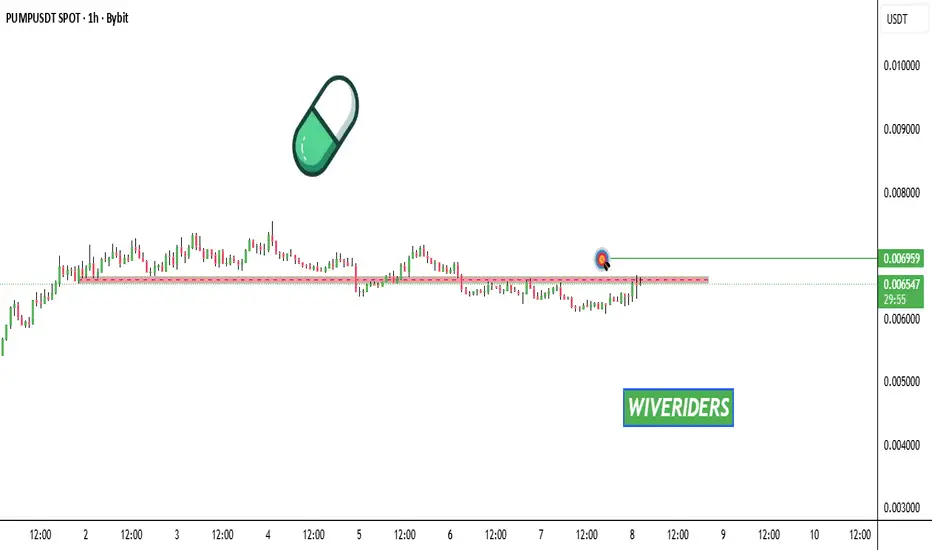
$PUMP Update📊 NYSE:PUMP Update
NYSE:PUMP is testing the red resistance zone 🔴
If it breaks out, the first target will be the green line level 🟢
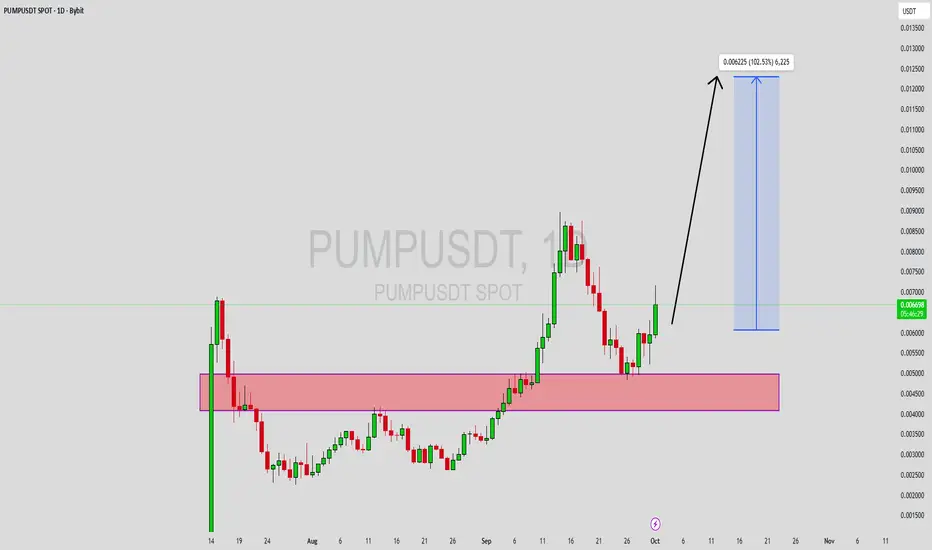
PUMP – Bounce From $1 Fibonacci Support Reclaims Key Levels
PUMP has rebounded sharply after a steep correction, finding support at the $1 level in confluence with the 0.618 Fibonacci retracement. Price is now consolidating above VWAP and the point of control.
After losing weekly resistance, PUMP underwent a heavy corrective move that pushed price down to
$PUMP - GOD CANDLE, no volume though. WATCH OUTOuch, last nite I made 2 posts about NYSE:PUMP being the top of my watchlist and it just printed a GOD CANDLE on the DAILY chart.
On Sunday, when I don't usually trade. Annoying.
We will see if the move is valid on shorter timeframes tommorow, but for now it's a low-volume daily Sunday candle.

Pumpcoin scalp short Just opened up a short on pumpcoin
sl: 0.006594
tp: 0.006191
Time sensitive
2RR based on my entry
See all ideas
Summarizing what the indicators are suggesting.
Oscillators
Neutral
SellBuy
Strong sellStrong buy
Strong sellSellNeutralBuyStrong buy
Oscillators
Neutral
SellBuy
Strong sellStrong buy
Strong sellSellNeutralBuyStrong buy
Summary
Neutral
SellBuy
Strong sellStrong buy
Strong sellSellNeutralBuyStrong buy
Summary
Neutral
SellBuy
Strong sellStrong buy
Strong sellSellNeutralBuyStrong buy
Summary
Neutral
SellBuy
Strong sellStrong buy
Strong sellSellNeutralBuyStrong buy
Moving Averages
Neutral
SellBuy
Strong sellStrong buy
Strong sellSellNeutralBuyStrong buy
Moving Averages
Neutral
SellBuy
Strong sellStrong buy
Strong sellSellNeutralBuyStrong buy