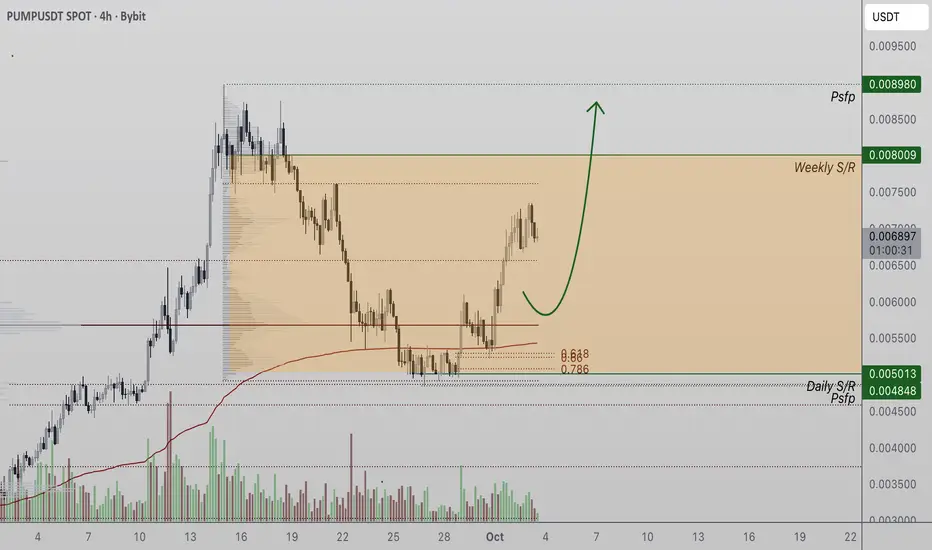
PumpToken Defends Support and Eyes Higher RotationPumpToken has staged a bullish rebound from a critical daily support level that aligned with the 0.618 Fibonacci retracement and a VWAP flip. This reaction has powered price into higher timeframe resistance, with bulls now eyeing continuation if momentum sustains.
The recent price action on PumpToken demonstrates the strength of technical confluence zones in guiding market direction. After testing a cluster of supports, including a golden-ratio Fibonacci retracement and VWAP reinforcement, PumpToken reacted decisively to the upside. The move pushed price into a higher-timeframe weekly resistance, setting the stage for a potential macro continuation. However, the market is now in a period of consolidation that could either evolve into a breakout or a corrective structure before resumption of the trend.
Key Technical Points:
PumpToken defended daily support at the 0.618 Fibonacci retracement.
A VWAP flip added confluence, triggering a powerful bullish rally.
Price is consolidating under weekly resistance, forming a corrective structure.
Main Analysis:
PumpToken’s reaction from the 0.618 Fibonacci retracement zone underlines the importance of golden-ratio levels in cryptocurrency price action. Historically, this level has often been a pivot for continuation moves in trending markets. In this case, the bounce was amplified by a VWAP flip, which highlighted renewed interest from market participants at a technically significant level.
The bullish response propelled PumpToken into higher timeframe resistance, where sellers have temporarily capped further upside. Price is now consolidating in a corrective loop, with both bulls and bears vying for control. The range-bound action is creating an equilibrium zone from which the next directional move will emerge. If price can break above the range high, this would unlock the potential for continuation of the macro uptrend, taking PumpToken to new higher levels.
Corrections in bullish structures should not be overlooked as signs of weakness. Instead, they often provide the healthy retracement required to shake out weak hands and build fresh positioning. PumpToken’s current sideways action can be interpreted as such—a period of market digestion before the next expansion. Volume trends remain consistent, suggesting that interest has not waned despite the consolidation.
The weekly resistance overhead is a critical barrier. Multiple rejections at this level would signal the possibility of deeper corrective action, perhaps a retest of the breakout support zones below. However, as long as price holds above the Fibonacci retracement and VWAP flip region, bulls maintain control of the structure.
What to Expect in the Coming Price Action:
PumpToken’s outlook remains bullish while support holds. If buyers maintain control, a breakout from the current range could trigger an expansion toward higher highs, confirming continuation of the macro uptrend. Conversely, failure to reclaim above the weekly resistance could extend the consolidation phase, offering another retest of support before any decisive move higher.
PUMPUSDT.3S trade ideas
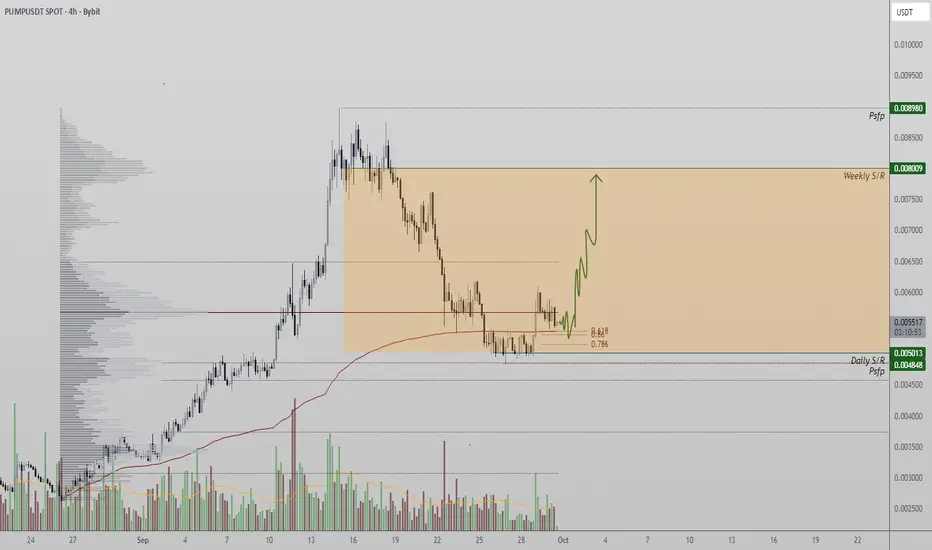
PUMP – Bounce From $1 Fibonacci Support Reclaims Key Levels
PUMP has rebounded sharply after a steep correction, finding support at the $1 level in confluence with the 0.618 Fibonacci retracement. Price is now consolidating above VWAP and the point of control.
After losing weekly resistance, PUMP underwent a heavy corrective move that pushed price down to daily support. This region provided strong technical alignment, triggering a bullish rally. The asset is currently testing critical levels that may define its next move.
Key Technical Points:
- Correction halted at $1, aligning with the 0.618 Fibonacci retracement.
- Price has reclaimed the point of control and VWAP support.
- Holding these levels could establish a higher low and rotation into resistance.
PUMP’s recovery highlights the significance of the $1 Fibonacci level as a structural pivot. The bullish impulse from this zone has brought the asset back above VWAP and the POC, confirming short-term strength. Consolidation above these metrics would suggest buyers are preparing to build a higher low, reinforcing bullish continuation.
Failure to maintain these supports, however, could reopen the path toward deeper retracement zones. Market participants will closely monitor order flow and volume in this region to confirm momentum strength.
What to Expect in the Coming Price Action:
If VWAP and the POC hold, PUMP could rotate toward higher resistance levels. Losing these supports would weaken the bullish thesis and expose downside risk.
PUMPUSDT Forming Bullish WavePUMPUSDT is showing strong bullish signs as it forms a bullish wave pattern, which often signals the continuation of upward momentum in the market. The chart setup reflects a healthy recovery from consolidation zones, supported by strong buying pressure and increasing market participation. With good volume activity, the conditions are aligning for a potential breakout, targeting a gain projection of nearly 90% to 100%+.
The bullish wave structure indicates that buyers are stepping in at key levels, driving prices higher and building confidence among traders. This technical setup often attracts more participants as breakout signals become clearer, pushing the asset into stronger bullish territory. If the momentum continues, PUMPUSDT could establish itself as a promising short-term and mid-term opportunity in the crypto market.
Investor interest in this project is visibly increasing, with price action confirming growing accumulation. The breakout target zone, as shown on the chart, highlights a significant upside opportunity that aligns with broader bullish sentiment across altcoins. With market conditions favoring growth, PUMPUSDT could be on track to deliver an impressive performance in the coming days.
✅ Show your support by hitting the like button and
✅ Leaving a comment below! (What is You opinion about this Coin)
Your feedback and engagement keep me inspired to share more insightful market analysis with you!
Pumpcoin short to $0.0061Just opened a new short awhile ago on pumpcoin.
Sl: 0.006985
TP: 0.0061
Exit area though is around $0.006145, Prior resistance on daily might get some demand there .
Yall if interested can perhaps used a tigher sl but preferably above $0.006985

PUMP | Technical & Fundamental InsightsDescription:
PUMP has recently shown increased market attention, reflecting growing community interest and speculative momentum. From a fundamental perspective, this asset is highly driven by sentiment, liquidity inflows, and overall market conditions rather than traditional intrinsic value. Monitoring volume spikes and key support/resistance zones is essential for short-term traders.
This analysis highlights both technical structures and underlying catalysts that could influence upcoming price action. Remember that PUMP remains a high-risk asset with strong volatility potential.
⚠️ Disclaimer:
This content is for educational purposes only and does not represent financial advice. Always conduct your own research before making investment decisions.
#PUMP #Crypto #TechnicalAnalysis #Trading #PriceAction #Fundamentals #Altcoins #MarketInsights #RiskManagement

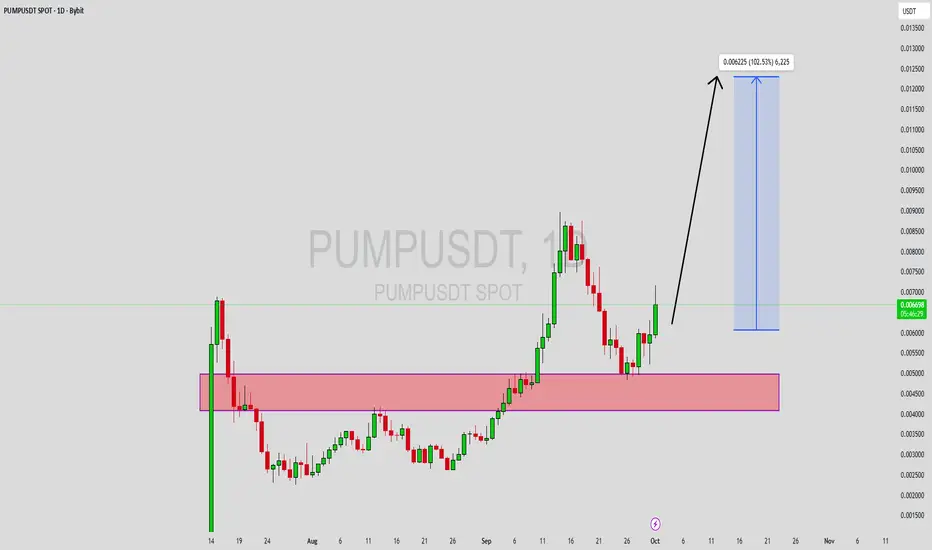
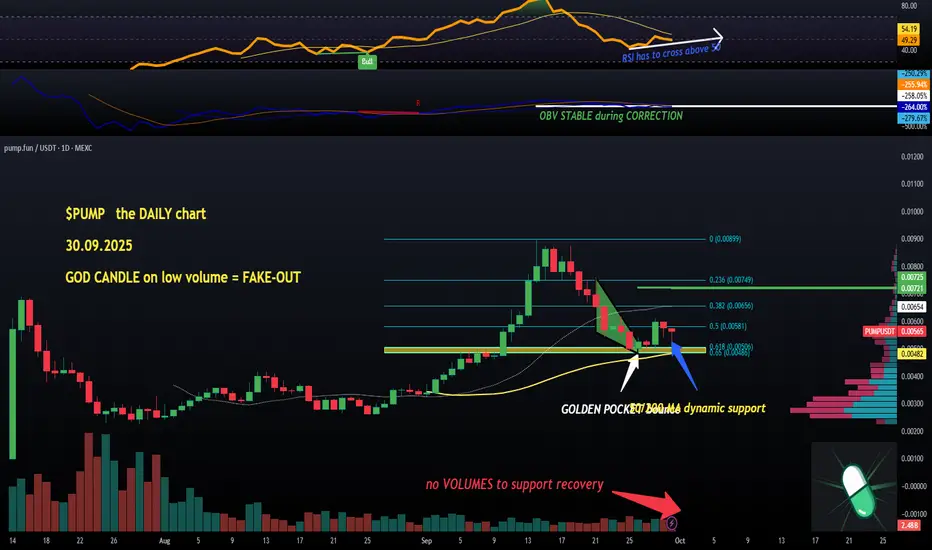
$PUMP (1-day): GOD CANDLE + LOW VOLUME = FAKE-OUT?NYSE:PUMP had a GOD CANDLE (16%+ in marketcap, currently at $1.97B) last Sunday and many people rushed in while I stood by and red-flagged that whole surge as suspicious due to low volumes.
And it turned out to be a fake-out which trapped many bulls around 0.6c.
So now, looking at the heatmap (last month's bit) there is a lot of reasons to drop further and even as low as mid-3cents.
Or #pump it to 0.9c.
Time will tell and more details on shorter timeframes in terms of a possible reversal to the upside, but the DAILY is still missing rising volume candles but I am expecting this to change as soon as the 6c mark is established as support.
With volumes, again, as we need to see real buyers coming back in, the OBV is showing flat action during the recent correction which is a positive.
4-hour chart next.
💙👽
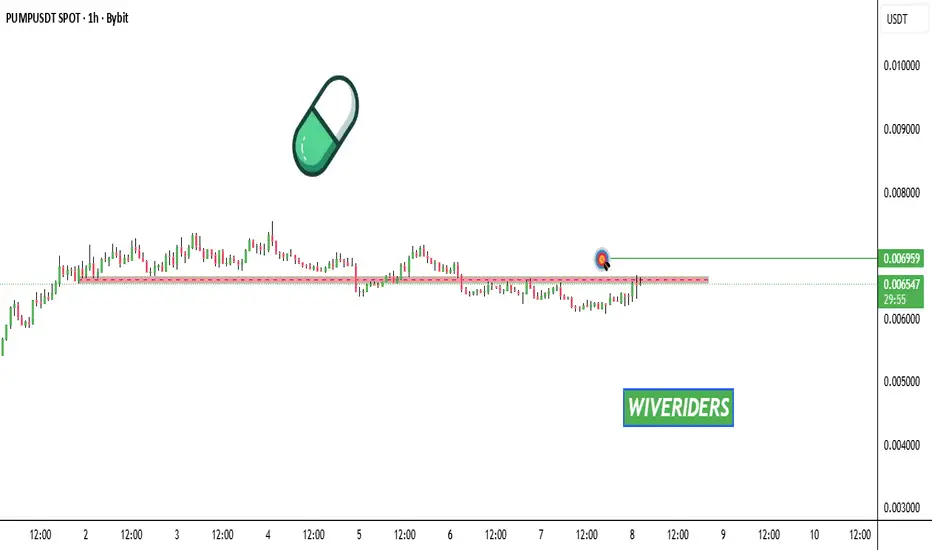
$PUMP Update📊 NYSE:PUMP Update
NYSE:PUMP is testing the red resistance zone 🔴
If it breaks out, the first target will be the green line level 🟢
$PUMP - GOD CANDLE, no volume though. WATCH OUTOuch, last nite I made 2 posts about NYSE:PUMP being the top of my watchlist and it just printed a GOD CANDLE on the DAILY chart.
On Sunday, when I don't usually trade. Annoying.
We will see if the move is valid on shorter timeframes tommorow, but for now it's a low-volume daily Sunday candle.
So watch out, better to miss the action than to get bull-trapped.
No volume, no trade, this is the lesson of the day (or the weekend).
Lots of liquidity trapped above, especially betweem 76c and 78c. This is a magnet and will be useful this week, I reckon💙👽

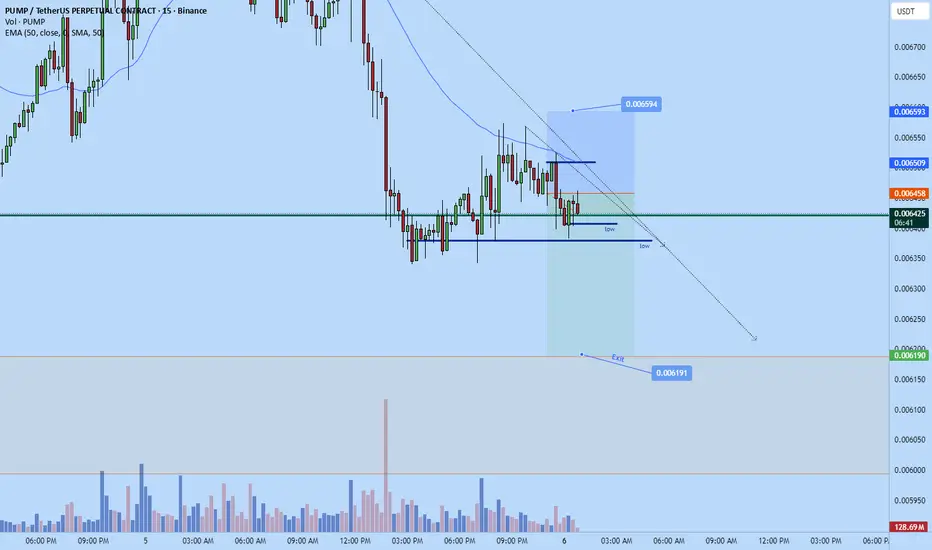
Pumpcoin scalp short Just opened up a short on pumpcoin
sl: 0.006594
tp: 0.006191
Time sensitive
2RR based on my entry

BUY AND HOLDHello friends
Given the potential and good support that this currency has, you can now buy in stages with capital and risk management now that the price has corrected and move with it to the specified goals.
Note that the holding period is at least 3 months, so be patient and observe capital management.
*Trade safely with us*

Long trade
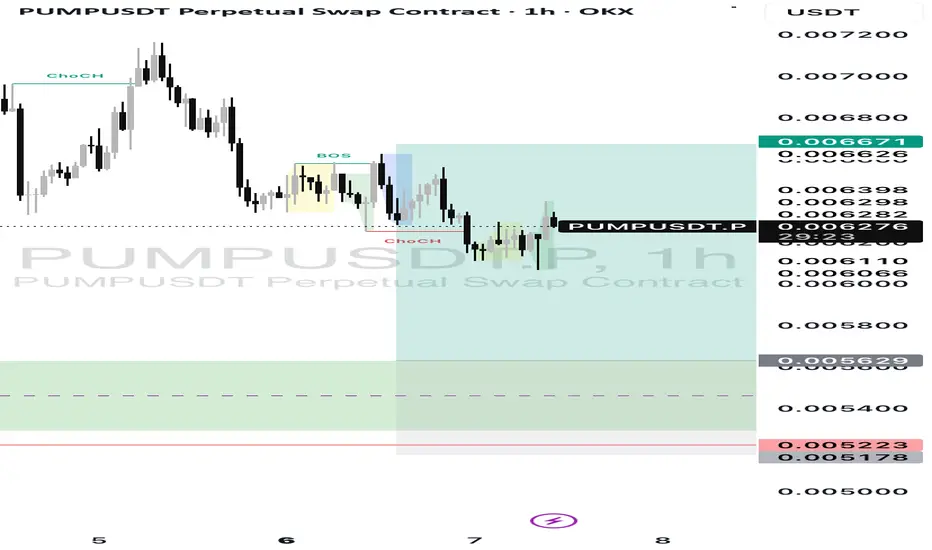
Trade Journal Entry
Pair: PUMPUSDT Perpetual
Trade Type: Buy-side trade
Date: Tue, 30th Sept 2025
Time: 4:00 pm
Session: NY Session PM
Trade Details
Entry: 0.006105
Profit Level (TP): 0.007619 (+24.78%)
Stop Level (SL): 0.005827 (-4.56%
Risk-to-Reward (RR): 5.33
Market Structure & Context
Trend: The Market was in a corrective downtrend, then swept key lows, initiating a bullish reversal.
Low Sweeps: Multiple liquidity sweeps under 0.0058 reinforced a spring-like accumulation setup. Demand Zone (1H): 0.0058–0.0060 acted as the turning point.
Fair Value Gaps (FVG): Price expansion left upside inefficiencies that align with target zones.
Moving Averages: EMA and SMA crossovers supported a bullish shift at entry.
Narrative (Wyckoff / SMC)
Accumulation: Prolonged sideways chop with repeated low sweeps → spring phase.
Confirmation: Strong displacement candle breaking above the structure confirmed bullish intent.
Entry: Aligned with demand retest post-displacement.
Liquidity Draw: Targeting inefficiencies and overhead liquidity at 0.0076.
Key Levels
Entry Zone: 0.0061
Stop: 0.0058
Intermediate Targets: 0.0068 / 0.0072
Final Target: 0.0076
Action Plan
Take partials at 0.0068 (first FVG fill).
Hold the majority position toward the 0.0076 liquidity pool.
If price retraces into 0.0062–0.0063, monitor for add-on opportunities with tight stops.

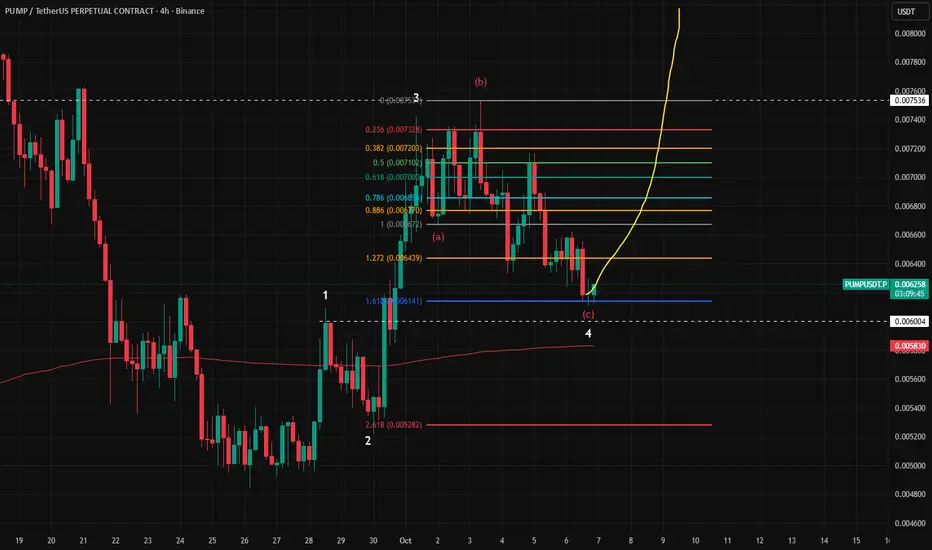
PumpAccording to Elliott Wave analysis we must go back down below the previous low. But the recent ascent wave looks like an x wave from a composite correction wave. In the long term, we are awaiting a rally targeting the previous peak of 0.009. This scenario is canceled by going back to 0.005870

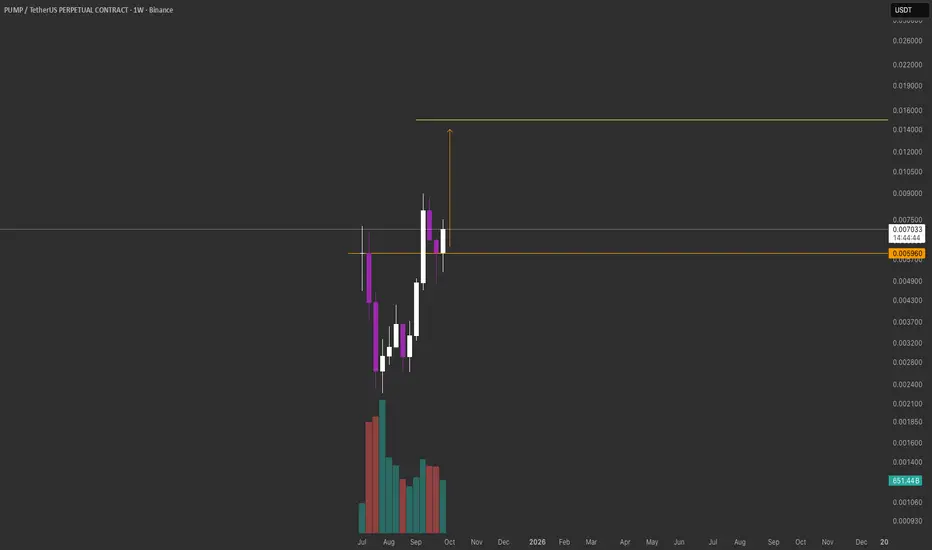
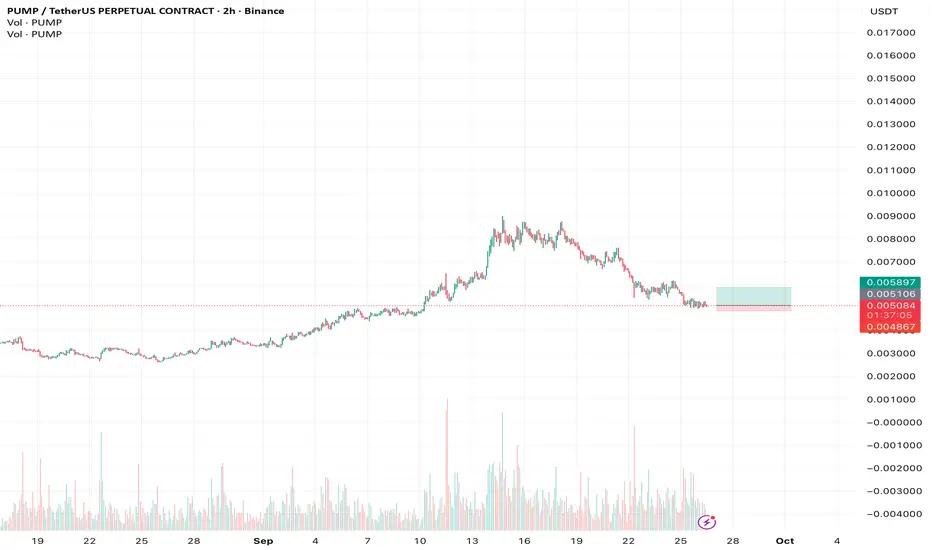
$PUMP looks ready for its next leg up.Weekly structure looks primed for continuation , holding strong above 0.006 with clean volume and no major distribution signs yet.
Clear higher lows and healthy retests, classic signs that smart money’s still in.
Technicals point to 0.15 as the next major target if momentum extends. As long as price holds above 0.0059 , the bullish structure stays valid.
The pattern looks strikingly similar to my previous GETTEX:HYPE call
And now NYSE:PUMP is actively doing buybacks, adding even more strength to the setup.
Not financial advice, just calling it how I see it. DYOR, but don’t sleep on $PUMP.
Crypto Trading Set up on #Pumpusdt Follow this idea and make money
I see #pumpusdt in an uptrend but the current market price is a retracement to a key zone which I have marked on the chart.
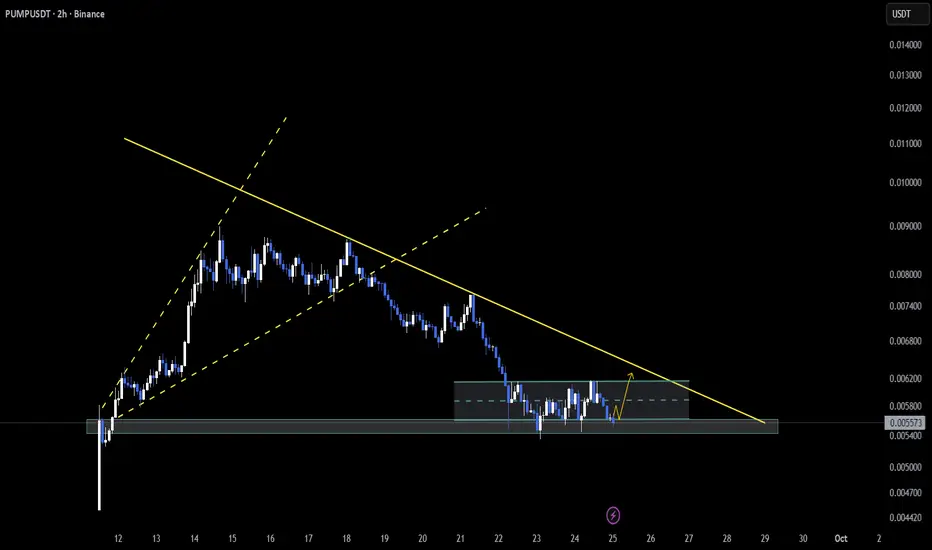
$PUMP falling wedge BREAKOUT after hitting GOLDEN POCKETThat beautiful bounce off the GOLDEN POCKET for NYSE:PUMP I spotted on the DAILY really caught my attention so I analysed the 4-hour chart for a more HD view.
We have got a FALLING WEDGE pattern breakout at the end of a correction which started after hitting the ATH ($0.009) exactly two weeks ago on Sunday.
We have also had a couple of BULL RSI divergences so this is looking extremely promising.
And now we are also seeing rising VOLUME bars, very solid sized ones for a Saturday night.
I am not opening any positions on weekends, but this is super interesting for a LONG, soon💙👽

PUMPFUNI love the sideways RT-Tool channel so much, it not really need confluece because its the algorithm of the market. You just have to have to correct approach on how to pull it. I like this setup and the invlaidation

PUMPPUMP looking good here. Seems to have found support after New Moon retrace to 618 of its prior move...

Move 5 : Let's follow the PUMPPump did a wonderful down, this down is is my view a liquidity generation move. As such, we will long
in : 0.005131
Leverage 17
Obj 1 : 0.005488 ( sell 70% let the rest run )
Ob 2 : until personal satisfaction
SL: 0.004855
Open move :
Move 1+ Move 4 : Long UNIT ( double size )
Closed moves :
Move 2 ( Closed flat )
Move 3 ( -19,7%)
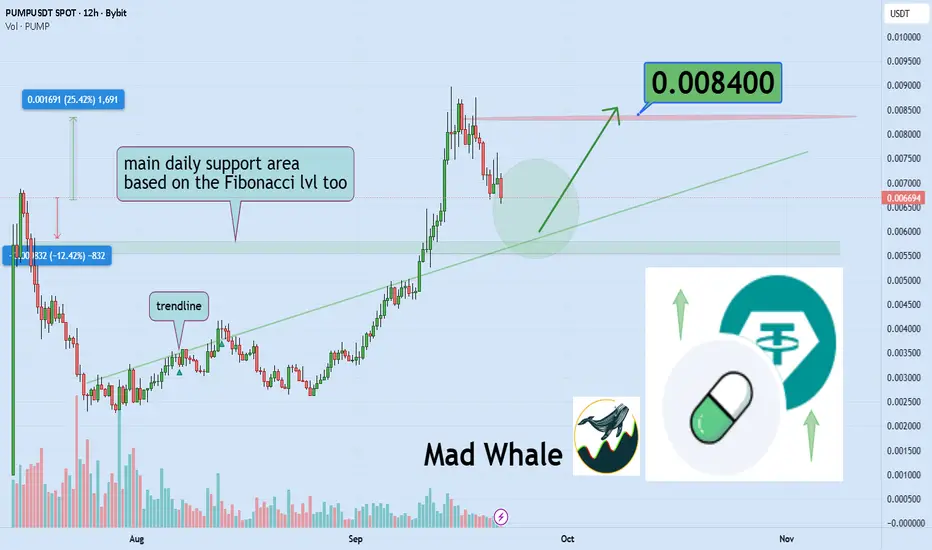
Pump .fun bounce could trigger 24% rally toward 0.0084Hello✌️
Let’s analyze Pump .fun’s price action both technically and fundamentally 📈.
🔍Fundamental analysis:
Pump.fun has been buying back PUMP with platform fees, removing ~1.2% supply each month.
Strong deflationary, but depends on revenues holding above $6M/month.
📊Technical analysis:
PUMP is approaching a key trendline and daily support, with Fibonacci levels holding strong. A sustained bounce could fuel a 24% rally, targeting 0.0084. 📊🚀
📈Using My Analysis to Open Your Position:
You can use my fundamental and technical insights along with the chart. The red and green arrows on the left help you set entry, take-profit, and stop-loss levels, serving as clear signals for your trades.⚡️ Also, please review the TradingView disclaimer carefully.🛡
✨We put love into every post!
Your support inspires us 💛 Drop a comment we’d love to hear from you! Thanks, Mad Whale
PUMP – Resting at Descending Triangle Support📆 On the 4H timeframe, NYSE:PUMP is moving inside a descending triangle and currently holding at horizontal support 🛡️
This zone is pivotal — a bounce could trigger a breakout, while a breakdown may lead to further downside. Observing price reaction here will be key to the next move.
👀 Watch this level closely for confirmation.
Not financial advice.
Sniper Entry For $PUMPFor this, you can set orders around the $0.0063 area. Liquidity might get tapped around that region before the next leg up.

PUMP - Expanded Flat - Near Invalidation LevelLooks like NYSE:PUMP has also finished an oddly structured 5-wave down for an expanded flat finish, coincidentally the 1.618 extension falls JUST above the line of invalidation for wave 1, makes for compelling evidence this could serve as a likely local low.
Wave-Count Confidence: Strong/Above Average
Will add on a note here that has the overall contextual count for PUMP, but all time highs are in the cards and this would be a remarkable entry, especially for you high leveraged son's of guns.