RAREUSDT Forming Bullish PennantRAREUSDT is currently forming a bullish pennant pattern, a strong continuation signal that often leads to sharp upward moves. This setup typically develops after a strong rally, followed by consolidation in a narrowing range, before price resumes its upward trajectory. With good volume confirming th

RAREUSDT UPDATE#RARE
UPDATE
RARE Technical Setup
Pattern: Bullish Falling Wedge Pattern
Current Price: $0.0586
Target Price: $0.0938
Target % Gain: 65.22%
NASDAQ:RARE is breaking out of a falling wedge on the 1D timeframe. Current price is $0.0586 with a target near $0.0938, offering over 65% potential upsid

RAREUSDT — at Critical Accumulation Zone: Breakout or Breakdown?📊 Market Analysis
On the 4D timeframe, RARE/USDT is trading at a crucial pivot zone. The chart structure highlights:
1. Descending Triangle
Clear formation with lower highs pressing price down.
Strong horizontal support between $0.0415 – $0.065 (yellow box).
This pattern often signals bearish c

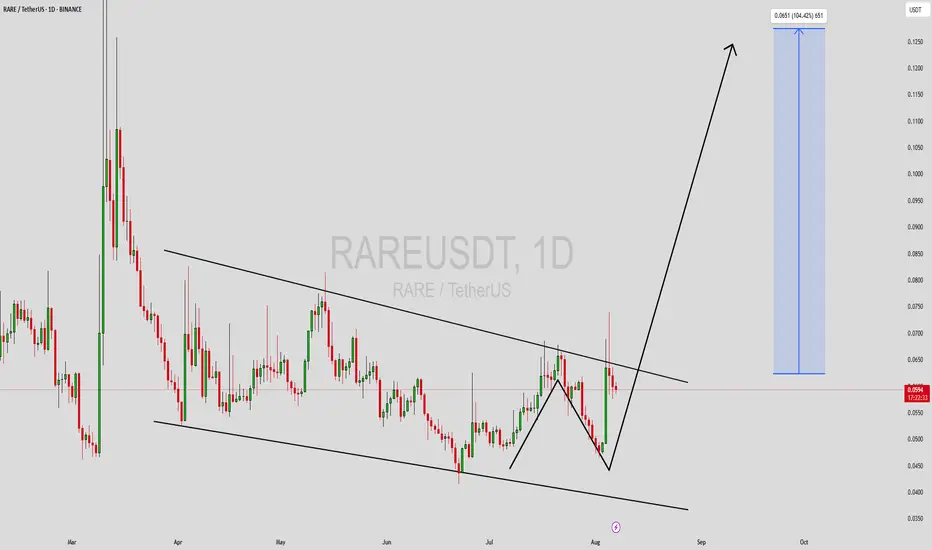
RAREUSDT Forming Bullish WaveRAREUSDT is currently forming a powerful bullish wave pattern on the daily chart, indicating a strong momentum buildup and potential for a massive breakout. This structure is often a hallmark of continued trend movement, especially when supported by increasing volume and investor interest. The price
RARE FLY SOONSuperRare
SuperRare is a NFT art platform on Ethereum
Everything is clear on the chart.
It's time to fly.
I wish everyone abundant profits.
Like and follow
for more.

RARE/USDT – Long-Term SetupRARE is forming a long-term descending triangle and showing signs of accumulation near the bottom range. A breakout from this structure can initiate a trend reversal.
Chart Analysis:
Downtrend line tightening with horizontal support
Current price testing triangle resistance
RSI trending upward (50)

$RAREUSDT Breakout Loading137% Rally in Sight?RARE just bounced strongly from a key support zone, gaining over 20% in a day.
It’s now testing a long-term descending trendline.
A breakout above this level could trigger a bullish reversal, with a potential target around $0.1414, a 137% upside.
DYRO, NFA

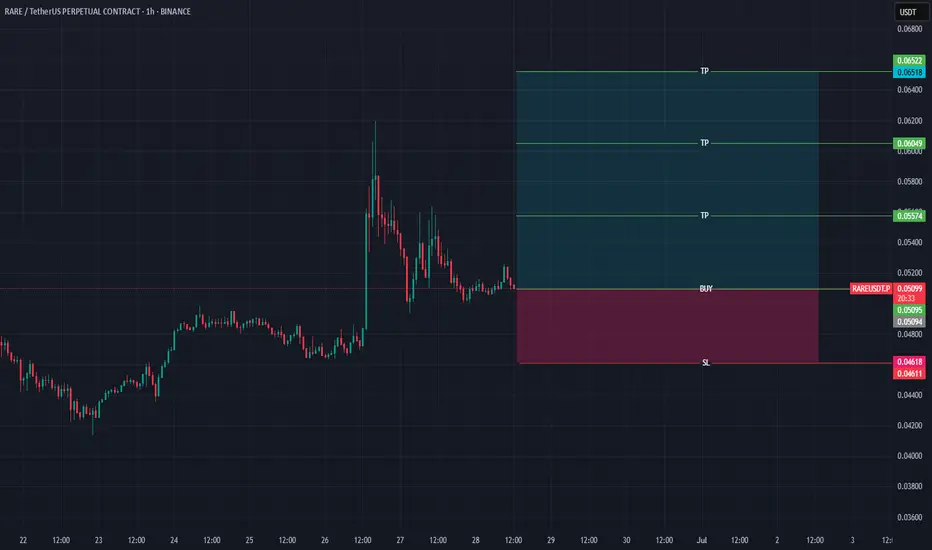
RAREUSDT | Strong Buyers, Clear Demand ZoneRAREUSDT is showing clear signs of strong buyer activity. The blue box below marks a clean demand zone that has held well in the past.
If price revisits that area, I’ll be watching for low-timeframe confirmation. No need to rush — the structure supports patience, and the buyers are doing their part

RAREUSDT 5D AnalysisRARE ~ 5D Analysis
#RARE Buy gradually from here with a short -term target of at least 15%+. This is the lowest support for now.

See all ideas
Summarizing what the indicators are suggesting.
Oscillators
Neutral
SellBuy
Strong sellStrong buy
Strong sellSellNeutralBuyStrong buy
Oscillators
Neutral
SellBuy
Strong sellStrong buy
Strong sellSellNeutralBuyStrong buy
Summary
Neutral
SellBuy
Strong sellStrong buy
Strong sellSellNeutralBuyStrong buy
Summary
Neutral
SellBuy
Strong sellStrong buy
Strong sellSellNeutralBuyStrong buy
Summary
Neutral
SellBuy
Strong sellStrong buy
Strong sellSellNeutralBuyStrong buy
Moving Averages
Neutral
SellBuy
Strong sellStrong buy
Strong sellSellNeutralBuyStrong buy
Moving Averages
Neutral
SellBuy
Strong sellStrong buy
Strong sellSellNeutralBuyStrong buy
Displays a symbol's price movements over previous years to identify recurring trends.