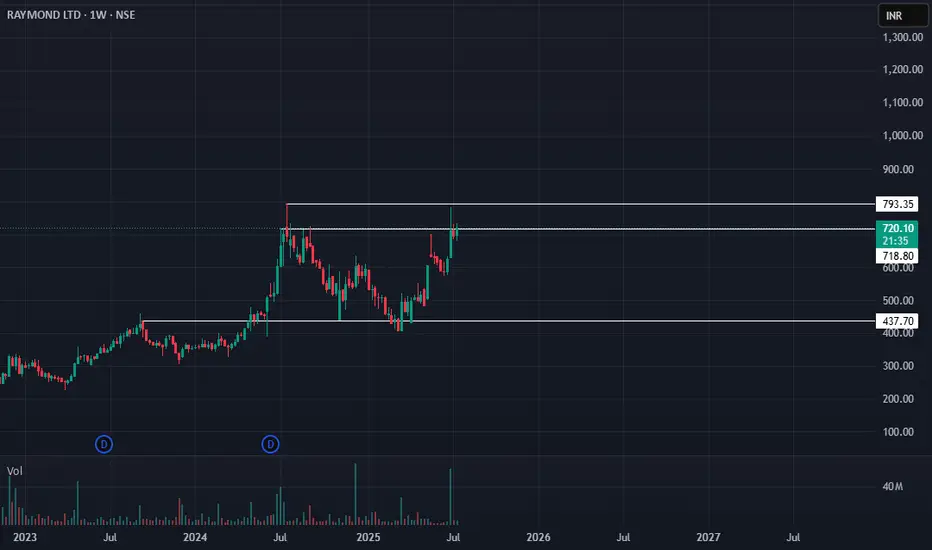
Raymond: Poised for All-Time High Breakout?🚀 Raymond: Poised for All-Time High Breakout? 🚀
💰 CMP: ₹722
🔒 Stop Loss: ₹578
🎯 Targets: ₹780 | ₹828 | ₹880
🔍 Rationale:
Raymond is showing strong signs of an all-time high breakout with its highest weekly close, a successful breakout, small pullback, and resumption of upward momentum. Range break
Next report date
—
Report period
—
EPS estimate
—
Revenue estimate
—
832.40 INR
76.31 B INR
19.23 B INR
33.28 M
About Raymond Limited
Sector
Industry
CEO
Gautam Hari Singhania
Website
Headquarters
Mumbai
Founded
1925
ISIN
INE301A01014
FIGI
BBG000CYLWK5
Raymond Ltd. is a textile and branded clothing company, which engages in the provision of end-to-end solutions for fabrics and garmenting. It operates through the following segments: Textile, Shirting, Apparel, Garmenting, Tools and Hardware, Auto Components, Real Estate Development, and Others. The Textiles segment produces fabric, rugs, blankets, shawls, and furnishing fabric. The Shirting segment provides denim fabric and cotton yarn. The Apparel segment includes branded readymade garments. The Others segment includes non-scheduled airline operations and real estate development. The company was founded on September 10, 1925 and is headquartered in Mumbai, India.
Related stocks
Raymond, 4Hr, Long, ResistanceRaymond is showing a resistance in 4 hour Time Frame. If it closes above 765 then it may go up from here, if it closes above it with Bullish candlestick patterns like Bullish Engulfing, Hammer & Inverted Hammer, Piercing Line, Morning Star, Three White Soldiers, Tweezer Bottoms or Bullish Harami.
E

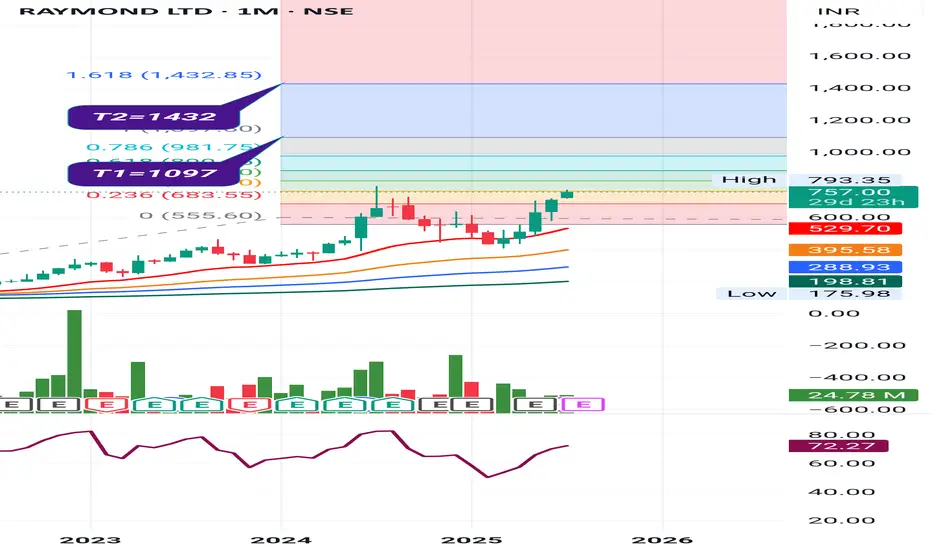
Raymond Ltd Raymond Ltd
P&F on Yearly Basis.
With BO.
EMAs: Widening gaps amongst 20/50/100/200 levels on monthly basis.
Vol. Built-up needs to be watched.
Trail SL with Upside.
Book Profit as per Risk Appetite.
This is an Opinion. Do Your Own Research as well.
Happy Investing.
Raymond: Tall Buildings, Crashing McapMcap 3750
Category Small Cap
Yes its a Small Cap
The main company ( Raymond Lifestyle) with a formidable brand is actually a loss making company with a Mcap of 6000 cr and a quarterly loss of 50 cr.
Badly run company.
SELL Raymond Ltd

Raymond 1 d chart signalling price action Raymond is looking in the uptrend after making a low near 1326. It is reversing from there on daily chart .
Ascending triangle pattern is forming and is about to complete the same .
Volume is Supporting in this uptrend .
RSI momentum is showing intact with higher high with Price in conjunction. Both

Raymond Rockets Past ₹1811! Bullish Targets Await!Raymond on the 4-hour timeframe has initiated a long trade setup, with TP1 already achieved at ₹1811.60. This trade was identified using the Risological Swing Trading Indicator , which confirms the potential for further bullish movement as long as the trend holds steady.
Key Levels:
TP1: ₹1811.

RAYMONDRAYMOND
Good Volume With Trendline Breakout
RSI Above 60
Price Close Above EMA
Buy :- 1837
SL :- 1583
Target :- 1850 / 1960 / 2086 / 2316

RAYMOND LTD S/R Support and Resistance Levels:
Support Levels: These are price points (green line/share) where a downward trend may be halted due to a concentration of buying interest. Imagine them as a safety net where buyers step in, preventing further decline.
Resistance Levels: Conversely, resistance levels (re

Raymond - Risky Whisky🎯The stock is in red as the Raymond Boss is getting divorced. Details here -
x.com
🎯 The price is down about 20% since the news came out, the company is still the same.
🎯Price stands at 1500 i.e. the first psy. Support level
🎯The delivery data shows an accumulation
🎯We may see a quick bounce fro

RAYMONDRAYMOND --TRG 3434 first achieved 2nd resistance 3750-65 . 4876 is also achievable as per fibo ext first will have to see how it reacts at 3750-65 level

See all ideas
Summarizing what the indicators are suggesting.
Neutral
SellBuy
Strong sellStrong buy
Strong sellSellNeutralBuyStrong buy
Neutral
SellBuy
Strong sellStrong buy
Strong sellSellNeutralBuyStrong buy
Neutral
SellBuy
Strong sellStrong buy
Strong sellSellNeutralBuyStrong buy
An aggregate view of professional's ratings.
Neutral
SellBuy
Strong sellStrong buy
Strong sellSellNeutralBuyStrong buy
Neutral
SellBuy
Strong sellStrong buy
Strong sellSellNeutralBuyStrong buy
Neutral
SellBuy
Strong sellStrong buy
Strong sellSellNeutralBuyStrong buy
Displays a symbol's price movements over previous years to identify recurring trends.
Frequently Asked Questions
The current price of RAYMOND is 466.45 INR — it has decreased by −0.33% in the past 24 hours. Watch Raymond Limited stock price performance more closely on the chart.
Depending on the exchange, the stock ticker may vary. For instance, on NSE exchange Raymond Limited stocks are traded under the ticker RAYMOND.
RAYMOND stock has fallen by −4.61% compared to the previous week, the month change is a −18.92% fall, over the last year Raymond Limited has showed a −13.75% decrease.
We've gathered analysts' opinions on Raymond Limited future price: according to them, RAYMOND price has a max estimate of 846.00 INR and a min estimate of 846.00 INR. Watch RAYMOND chart and read a more detailed Raymond Limited stock forecast: see what analysts think of Raymond Limited and suggest that you do with its stocks.
RAYMOND reached its all-time high on Jul 18, 2024 with the price of 793.35 INR, and its all-time low was 10.75 INR and was reached on Apr 28, 1999. View more price dynamics on RAYMOND chart.
See other stocks reaching their highest and lowest prices.
See other stocks reaching their highest and lowest prices.
RAYMOND stock is 1.94% volatile and has beta coefficient of 1.78. Track Raymond Limited stock price on the chart and check out the list of the most volatile stocks — is Raymond Limited there?
Today Raymond Limited has the market capitalization of 31.16 B, it has increased by 3.51% over the last week.
Yes, you can track Raymond Limited financials in yearly and quarterly reports right on TradingView.
Raymond Limited is going to release the next earnings report on Feb 14, 2026. Keep track of upcoming events with our Earnings Calendar.
RAYMOND net income for the last quarter is 113.80 M INR, while the quarter before that showed 53.25 B INR of net income which accounts for −99.79% change. Track more Raymond Limited financial stats to get the full picture.
Yes, RAYMOND dividends are paid annually. The last dividend per share was 10.00 INR. As of today, Dividend Yield (TTM)% is 2.14%. Tracking Raymond Limited dividends might help you take more informed decisions.
Raymond Limited dividend yield was 0.00% in 2024, and payout ratio reached 0.00%. The year before the numbers were 0.55% and 4.06% correspondingly. See high-dividend stocks and find more opportunities for your portfolio.
As of Dec 4, 2025, the company has 375 employees. See our rating of the largest employees — is Raymond Limited on this list?
EBITDA measures a company's operating performance, its growth signifies an improvement in the efficiency of a company. Raymond Limited EBITDA is 2.92 B INR, and current EBITDA margin is 8.52%. See more stats in Raymond Limited financial statements.
Like other stocks, RAYMOND shares are traded on stock exchanges, e.g. Nasdaq, Nyse, Euronext, and the easiest way to buy them is through an online stock broker. To do this, you need to open an account and follow a broker's procedures, then start trading. You can trade Raymond Limited stock right from TradingView charts — choose your broker and connect to your account.
Investing in stocks requires a comprehensive research: you should carefully study all the available data, e.g. company's financials, related news, and its technical analysis. So Raymond Limited technincal analysis shows the strong sell today, and its 1 week rating is sell. Since market conditions are prone to changes, it's worth looking a bit further into the future — according to the 1 month rating Raymond Limited stock shows the neutral signal. See more of Raymond Limited technicals for a more comprehensive analysis.
If you're still not sure, try looking for inspiration in our curated watchlists.
If you're still not sure, try looking for inspiration in our curated watchlists.