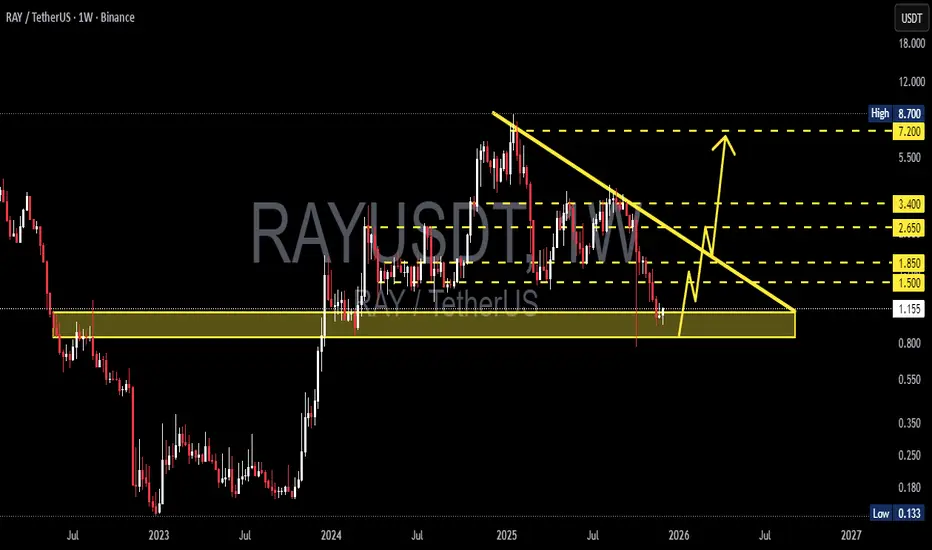
RAYUSDT — Testing Demand Zone?, Reversal or Breakdown Ahead?On the Weekly timeframe, RAYUSDT remains in a clear macro downtrend after forming its peak around the 8.7 USDT region. Following a distribution phase in the mid-range area (2 – 3.5), price continued declining gradually, forming consistent lower highs and lower lows.
Currently, price action is appro
Related pairs

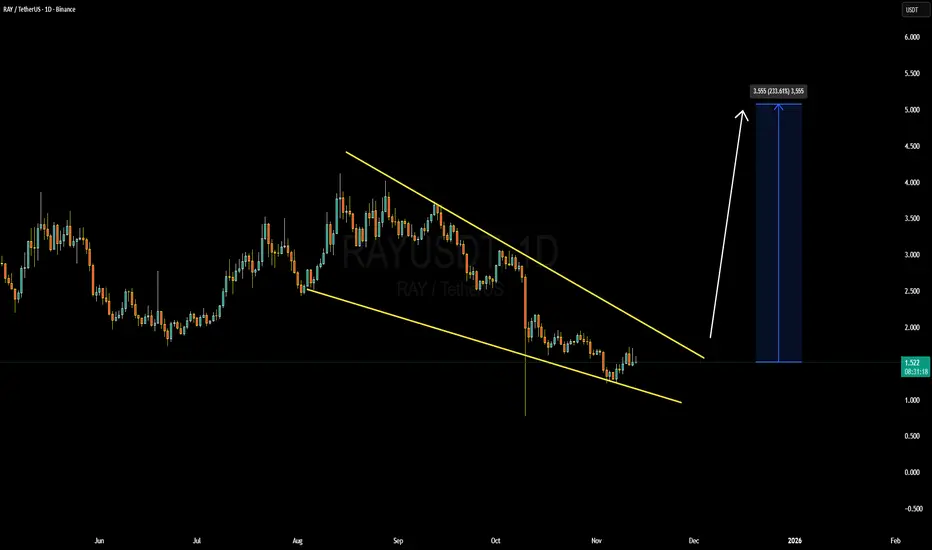
RAYUSDT Forming Bullish MomentumRAYUSDT is forming a clear bullish momentum pattern, a classic bullish reversal signal that often indicates an upcoming breakout. The price has been consolidating within a narrowing range, suggesting that selling pressure is weakening while buyers are beginning to regain control. With consistent vol

NLDN | RAYSOLUSDT PERPETUAL SPECULATION SHORT RAYSOLUSDT 4H Perpetual
SHORT
Entry 1.1306
SL 1.2947
TP 0.8536
Should you find this analysis insightful, I invite you to like or leave a comment. Constructive feedback and suggestions are greatly appreciated. For further analyses, please follow me at @ydnldn.

TradeCityPro | RAY Near Resistance, Watching for Breakout👋 Welcome to TradeCityPro!
In this analysis, I want to review the RAY coin for you — one of the DeFi projects in the Solana ecosystem, which has a market cap of $313 million and is ranked 130th on CoinMarketCap.
🗓 Daily TimeFrame
This coin has a downtrend on the 4-hour timeframe that continued down

RAYUSDT 1D#RAY is moving inside a falling wedge pattern on the daily chart. Enter this coin only after a clean breakout above the wedge. In that case, the potential targets are:
🎯 $1.406
🎯 $1.704
🎯 $1.945
🎯 $2.186
🎯 $2.528
⚠️ Always remember to use a tight stop-loss and maintain proper risk management.

RAYUSDT 12H#RAY is pressing the descending resistance on the 12H chart, and it has even formed a double-bottom pattern. Both the RSI and MACD are bullish as well. With all these factors combined, the probability of breaking above the descending resistance has increased. So keep an eye on it. In case of a break

RAY/USDT – Major Decision Zone at $0.85–$1.10RAY has returned to the same demand zone that triggered every major rally over the past 2 years.
Hold this zone = potential multi-month reversal.
Lose this zone = structural breakdown.”
---
Pattern & Market Structure Explanation
The weekly chart of RAY/USDT is showing one of the clearest macro se
RAYUSDT Forming Falling WedgeRAY/USDT looks like it’s entering a pivotal phase right now. Technically, the price has been consolidating after a corrective pull-back, and what I’m watching is whether RAY can break above its recent consolidation high with volume supporting the move. The project sits within a high-visibility niche
RAYSOL is bullish (1H)From the point marked as start on the chart, it appears that a bullish diametric pattern has formed, showing strong upward movements. We will wait for wave e to complete, and at the end of wave f, we’ll look to enter a buy/long position to capture wave g.
Given the strength of the bullish legs, tak

RAYUSDT 2D#RAY is moving inside a descending triangle on the 2-day chart. Consider buying here and on the support zone. In case of a bounce, the potential targets are:
🎯 $2.380
🎯 $2.939
🎯 $3.391
🎯 $3.844
🎯 $4.488
🎯 $5.308
⚠️ Always remember to use a tight stop-loss and maintain proper risk management.

See all ideas
Summarizing what the indicators are suggesting.
Oscillators
Neutral
SellBuy
Strong sellStrong buy
Strong sellSellNeutralBuyStrong buy
Oscillators
Neutral
SellBuy
Strong sellStrong buy
Strong sellSellNeutralBuyStrong buy
Summary
Neutral
SellBuy
Strong sellStrong buy
Strong sellSellNeutralBuyStrong buy
Summary
Neutral
SellBuy
Strong sellStrong buy
Strong sellSellNeutralBuyStrong buy
Summary
Neutral
SellBuy
Strong sellStrong buy
Strong sellSellNeutralBuyStrong buy
Moving Averages
Neutral
SellBuy
Strong sellStrong buy
Strong sellSellNeutralBuyStrong buy
Moving Averages
Neutral
SellBuy
Strong sellStrong buy
Strong sellSellNeutralBuyStrong buy
Displays a symbol's price movements over previous years to identify recurring trends.
Frequently Asked Questions
The current price of RAY / TetherUS (RAY) is 0.625 USDT — it has fallen −6.02% in the past 24 hours. Try placing this info into the context by checking out what coins are also gaining and losing at the moment and seeing RAY price chart.
RAY / TetherUS price has risen by 1.96% over the last week, its month performance shows a −45.50% decrease, and as for the last year, RAY / TetherUS has decreased by −88.16%. See more dynamics on RAY price chart.
Keep track of coins' changes with our Crypto Coins Heatmap.
Keep track of coins' changes with our Crypto Coins Heatmap.
RAY / TetherUS (RAY) reached its highest price on Aug 28, 2021 — it amounted to 17.800 USDT. Find more insights on the RAY price chart.
See the list of crypto gainers and choose what best fits your strategy.
See the list of crypto gainers and choose what best fits your strategy.
RAY / TetherUS (RAY) reached the lowest price of 0.133 USDT on Dec 29, 2022. View more RAY / TetherUS dynamics on the price chart.
See the list of crypto losers to find unexpected opportunities.
See the list of crypto losers to find unexpected opportunities.
The safest choice when buying RAY is to go to a well-known crypto exchange. Some of the popular names are Binance, Coinbase, Kraken. But you'll have to find a reliable broker and create an account first. You can trade RAY right from TradingView charts — just choose a broker and connect to your account.
Crypto markets are famous for their volatility, so one should study all the available stats before adding crypto assets to their portfolio. Very often it's technical analysis that comes in handy. We prepared technical ratings for RAY / TetherUS (RAY): today its technical analysis shows the sell signal, and according to the 1 week rating RAY shows the sell signal. And you'd better dig deeper and study 1 month rating too — it's sell. Find inspiration in RAY / TetherUS trading ideas and keep track of what's moving crypto markets with our crypto news feed.
RAY / TetherUS (RAY) is just as reliable as any other crypto asset — this corner of the world market is highly volatile. Today, for instance, RAY / TetherUS is estimated as 5.05% volatile. The only thing it means is that you must prepare and examine all available information before making a decision. And if you're not sure about RAY / TetherUS, you can find more inspiration in our curated watchlists.
You can discuss RAY / TetherUS (RAY) with other users in our public chats, Minds or in the comments to Ideas.