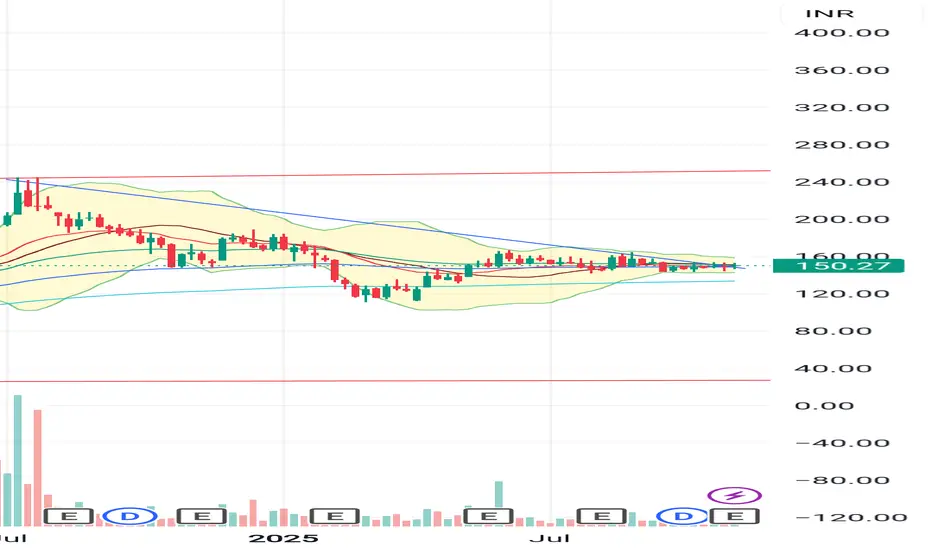
Perfect setup for a swing trade.15 months trendline b.o..3w.m.a.'s converge. Moving in a close range for days. Good results.
5.66 INR
2.42 B INR
70.78 B INR
137.71 M
About Rashtriya Chemicals & Fertilizers Ltd.
Sector
Industry
CEO
Shriniwas C. Mudgerikar
Website
Headquarters
Mumbai
Founded
1978
ISIN
INE027A01015
FIGI
BBG000CYJ3W9
Rashtriya Chemicals & Fertilizers Ltd. is an India based fertilizers manufacturing company. It operates through the following segments: Fertilizers, Industrial Chemicals, and Trading. The Fertilizers segment engages in the production and supply of various grades of fertilizers for agricultural use. The Industrial Chemicals segment engages in the production of various chemicals and supply to diverse industries. The Trading segment represents fertilizers imported or locally sourced and marketed for agricultural use. The company was founded on March 6, 1978 and is headquartered in Mumbai, India.
Related stocks

RCFHi,
Price at lower end of channel so its possible that price will move above from support level.
This idea is for Educational purpose and paper trading only. Please consult your financial advisor before investing or making any position. Facts or Data given above may be slightly incorrect. We are n

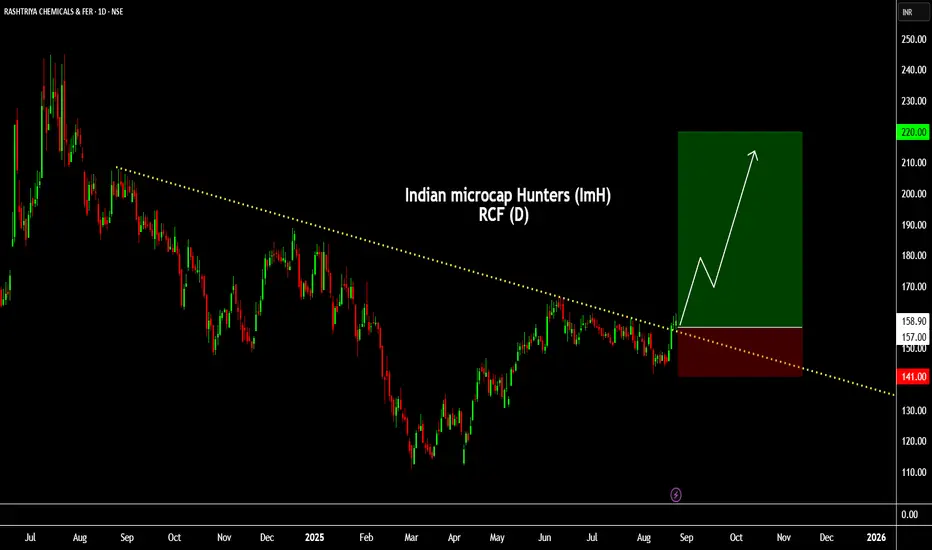
RCF (Swing):RCF (Swing):
RCF is getting ready for the next trend by breaking the falling trendline.
Script has well consolidated and formed a strong base.
Trade offers a RR of more than 1:4.
Check out my earlier views for a better understanding.
Note: Do your own due diligence before taking any action.
RCFRCF
watch above levels. green line is our entry, redline is our SL.
DISCLAIMER : I am NOT a SEBI registered advisor or a financial adviser. All the views are for educational purpose only.

RCF Report
📆 Monthly Time Frame:
📍 Price Action: Price is currently at a major support zone.
🔄 Trend Analysis: Downtrend (Dow Theory) remains intact.
📉 Moving Average: Price is near the 50 EMA.
🔍 Analysis: Price is not strongly bearish but not yet bullish. This zone might indicate a potential trend reve

RCF testing support lineRCF is converging testing 2 trendline and can easily reach 149-147 and move up in near time

(RCF) is Poised for a Breakout: Watch These Key Levels!Rashtriya Chemicals & Fertilizers Ltd. (RCF) stock is showing promising technical setups as it consolidates near critical resistance. With strong price action and a trendline acting as support, the stage may be set for an upward breakout.
Key Levels and Setup
📈 Support Trendline: The stock has cons

A look at RCF..A look at RCF..
SL 150
Target 194, 240
Stock following channel
Double bottom on daily TF
Goverement might be pushing for fertilizer consumptions (in next budget, market already assuming same.)


See all ideas
Summarizing what the indicators are suggesting.
Oscillators
Neutral
SellBuy
Strong sellStrong buy
Strong sellSellNeutralBuyStrong buy
Oscillators
Neutral
SellBuy
Strong sellStrong buy
Strong sellSellNeutralBuyStrong buy
Summary
Neutral
SellBuy
Strong sellStrong buy
Strong sellSellNeutralBuyStrong buy
Summary
Neutral
SellBuy
Strong sellStrong buy
Strong sellSellNeutralBuyStrong buy
Summary
Neutral
SellBuy
Strong sellStrong buy
Strong sellSellNeutralBuyStrong buy
Moving Averages
Neutral
SellBuy
Strong sellStrong buy
Strong sellSellNeutralBuyStrong buy
Moving Averages
Neutral
SellBuy
Strong sellStrong buy
Strong sellSellNeutralBuyStrong buy
Displays a symbol's price movements over previous years to identify recurring trends.
749RCFL28
Rashtriya Chemicals and Fertilizers Limited 7.49% 30-JUN-2028Yield to maturity
—
Maturity date
Jun 30, 2028
799RCFL27
Rashtriya Chemicals and Fertilizers Limited 7.99% 07-AUG-2027Yield to maturity
—
Maturity date
Aug 7, 2027
76RCFL29
Rashtriya Chemicals and Fertilizers Limited 7.6% 25-JUL-2029Yield to maturity
—
Maturity date
Jul 25, 2029
See all RCF bonds
MOSMALL250
Motilal Oswal Nifty Smallcap 250 ETF Units Exchange Traded FundWeight
0.10%
Market value
14.35 K
USD
Explore more ETFs
Frequently Asked Questions
The current price of RCF is 149.09 INR — it has decreased by −1.34% in the past 24 hours. Watch Rashtriya Chemicals & Fertilizers Ltd. stock price performance more closely on the chart.
Depending on the exchange, the stock ticker may vary. For instance, on NSE exchange Rashtriya Chemicals & Fertilizers Ltd. stocks are traded under the ticker RCF.
RCF stock has risen by 0.95% compared to the previous week, the month change is a 0.58% rise, over the last year Rashtriya Chemicals & Fertilizers Ltd. has showed a −3.09% decrease.
RCF stock is 1.65% volatile and has beta coefficient of 2.00. Track Rashtriya Chemicals & Fertilizers Ltd. stock price on the chart and check out the list of the most volatile stocks — is Rashtriya Chemicals & Fertilizers Ltd. there?
Today Rashtriya Chemicals & Fertilizers Ltd. has the market capitalization of 83.88 B, it has increased by 2.15% over the last week.
Yes, you can track Rashtriya Chemicals & Fertilizers Ltd. financials in yearly and quarterly reports right on TradingView.
RCF net income for the last quarter is 1.05 B INR, while the quarter before that showed 544.30 M INR of net income which accounts for 93.55% change. Track more Rashtriya Chemicals & Fertilizers Ltd. financial stats to get the full picture.
Yes, RCF dividends are paid annually. The last dividend per share was 1.32 INR. As of today, Dividend Yield (TTM)% is 0.87%. Tracking Rashtriya Chemicals & Fertilizers Ltd. dividends might help you take more informed decisions.
Rashtriya Chemicals & Fertilizers Ltd. dividend yield was 1.05% in 2024, and payout ratio reached 30.04%. The year before the numbers were 0.97% and 30.37% correspondingly. See high-dividend stocks and find more opportunities for your portfolio.
As of Nov 20, 2025, the company has 5.29 K employees. See our rating of the largest employees — is Rashtriya Chemicals & Fertilizers Ltd. on this list?
EBITDA measures a company's operating performance, its growth signifies an improvement in the efficiency of a company. Rashtriya Chemicals & Fertilizers Ltd. EBITDA is 7.29 B INR, and current EBITDA margin is −129.02%. See more stats in Rashtriya Chemicals & Fertilizers Ltd. financial statements.
Like other stocks, RCF shares are traded on stock exchanges, e.g. Nasdaq, Nyse, Euronext, and the easiest way to buy them is through an online stock broker. To do this, you need to open an account and follow a broker's procedures, then start trading. You can trade Rashtriya Chemicals & Fertilizers Ltd. stock right from TradingView charts — choose your broker and connect to your account.
Investing in stocks requires a comprehensive research: you should carefully study all the available data, e.g. company's financials, related news, and its technical analysis. So Rashtriya Chemicals & Fertilizers Ltd. technincal analysis shows the sell today, and its 1 week rating is neutral. Since market conditions are prone to changes, it's worth looking a bit further into the future — according to the 1 month rating Rashtriya Chemicals & Fertilizers Ltd. stock shows the buy signal. See more of Rashtriya Chemicals & Fertilizers Ltd. technicals for a more comprehensive analysis.
If you're still not sure, try looking for inspiration in our curated watchlists.
If you're still not sure, try looking for inspiration in our curated watchlists.