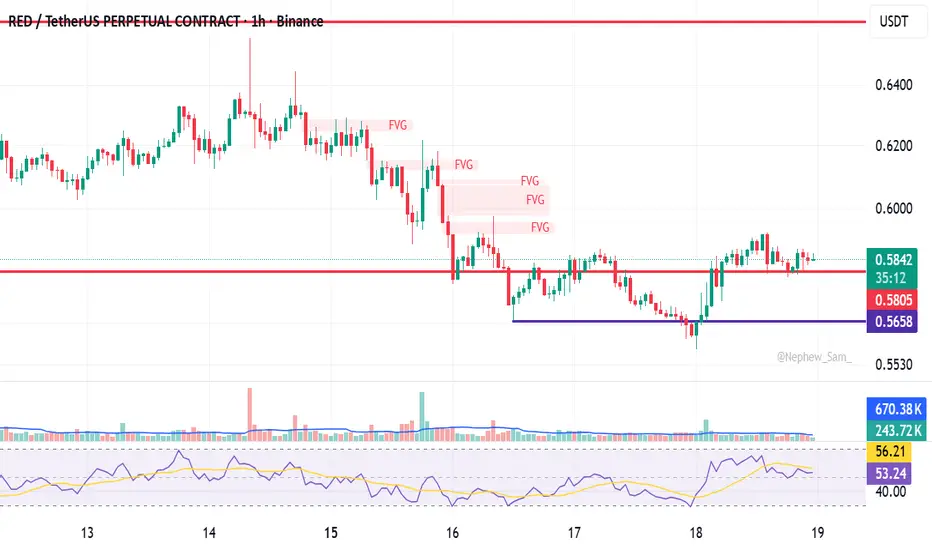
redusdt done a bullish reversal triangle pattern redusdt just done a bullish reversal triangle pattern in 1hr tf.
it looks like is a successful reversal play to continuation pump above the moon.
confluence with other factor:
daily rsi momentum is 59.
still remain in bullish momentum in higher time frame.
REDUSDT.P trade ideas
REDUSDT Forming Falling WedgeREDUSDT is currently forming a falling wedge pattern, a bullish reversal setup that often indicates the end of a downtrend and the beginning of a strong upward move. This structure reflects tightening price action, with lower highs and lower lows converging, typically followed by a breakout to the upside. Based on this setup, REDUSDT is positioned for a potential rally, targeting gains of around 90% to 100%+.
The trading volume is showing stability, which adds confidence to the wedge formation. A steady flow of volume suggests that accumulation is taking place, as investors quietly position themselves ahead of a possible breakout. If momentum builds and breaks past resistance, the move could accelerate quickly, validating the bullish outlook.
Market sentiment around REDUSDT is improving as more investors begin to recognize the strength of this technical setup. The project has been gaining traction, and investor interest is helping fuel speculation about its potential growth. With traders watching closely, a successful breakout could draw even more attention, increasing liquidity and supporting sustained price action.
In summary, REDUSDT is preparing for a significant opportunity, with the falling wedge pattern signaling the likelihood of a bullish move. Combined with solid volume and growing investor interest, the coin looks ready to deliver notable returns in the near future.
✅ Show your support by hitting the like button and
✅ Leaving a comment below! (What is You opinion about this Coin)
Your feedback and engagement keep me inspired to share more insightful market analysis with you!

REDUSDT Forming Falling WedgeREDUSDT is currently forming a falling wedge pattern, a bullish reversal setup that often indicates the end of a downtrend and the beginning of a strong upward move. This structure reflects tightening price action, with lower highs and lower lows converging, typically followed by a breakout to the upside. Based on this setup, REDUSDT is positioned for a potential rally, targeting gains of around 40% to 50%+.
The trading volume is showing stability, which adds confidence to the wedge formation. A steady flow of volume suggests that accumulation is taking place, as investors quietly position themselves ahead of a possible breakout. If momentum builds and breaks past resistance, the move could accelerate quickly, validating the bullish outlook.
Market sentiment around REDUSDT is improving as more investors begin to recognize the strength of this technical setup. The project has been gaining traction, and investor interest is helping fuel speculation about its potential growth. With traders watching closely, a successful breakout could draw even more attention, increasing liquidity and supporting sustained price action.
In summary, REDUSDT is preparing for a significant opportunity, with the falling wedge pattern signaling the likelihood of a bullish move. Combined with solid volume and growing investor interest, the coin looks ready to deliver notable returns in the near future.
✅ Show your support by hitting the like button and
✅ Leaving a comment below! (What is You opinion about this Coin)
Your feedback and engagement keep me inspired to share more insightful market analysis with you!
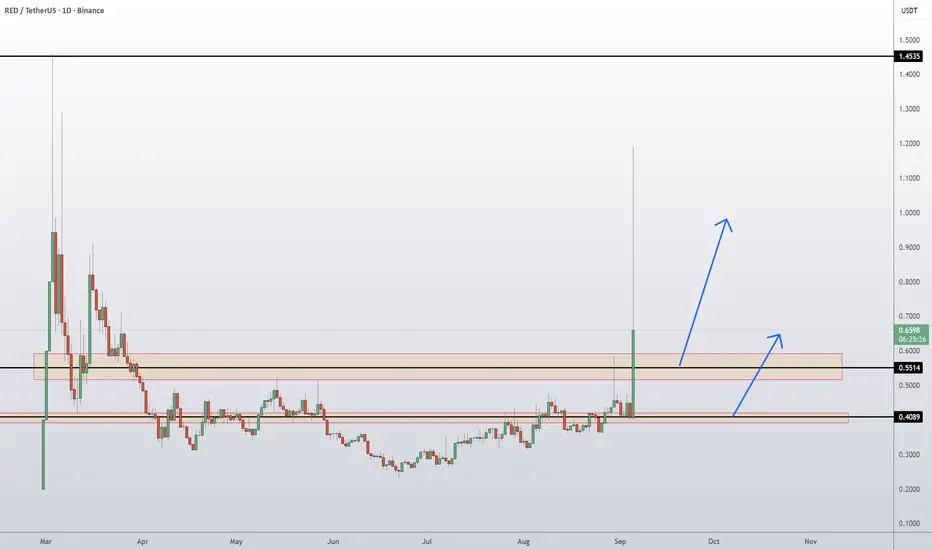
RED Coin RedStone Token Price Prediction and Technical AnalysisRED/USDT has broken out of its long consolidation phase with a sharp rally, showing strong momentum. Price surged above the 0.5514 resistance and is now trading around 0.6703, attempting to hold above this breakout structure. If buyers maintain control, continuation toward the major resistance at 1.4535 is possible. However, if price fails to sustain above the 0.5514–0.70 supply zone, a pullback to retest 0.4089 support could unfold before another leg higher.
📈 Key Levels:
Buy trigger: Successful retest/hold above 0.5514 support-turned-demand
Buy zone: 0.55 – 0.70 region
Target: 1.4535 major resistance
Invalidation: Daily close below 0.4089 (would negate bullish structure)
👉 Follow me for More Real Time Opportunities.
Share your Thoughts if you have any?
SPOT BREAKOUT ALERT - RED/USDT📈SPOT BREAKOUT ALERT 📈
BME:RED is up average +65% today, but I think bulls could push price much higher!
Quick stats:
✅ $2.4B+ TVL, 300k+ users
✅ Live on Binance Loans
✅ Integrated with 50+ protocols, securing 25+ DVNs
✅ Kelp: 2nd largest LRT on ETH
✅ Leading staking infrastructure on BNB Chain
Currently, I expect to see a short term bearish correction before to see a next big move upward!
Key demand zone:
0.570 - 05800 & 0.5300 - 0.500$

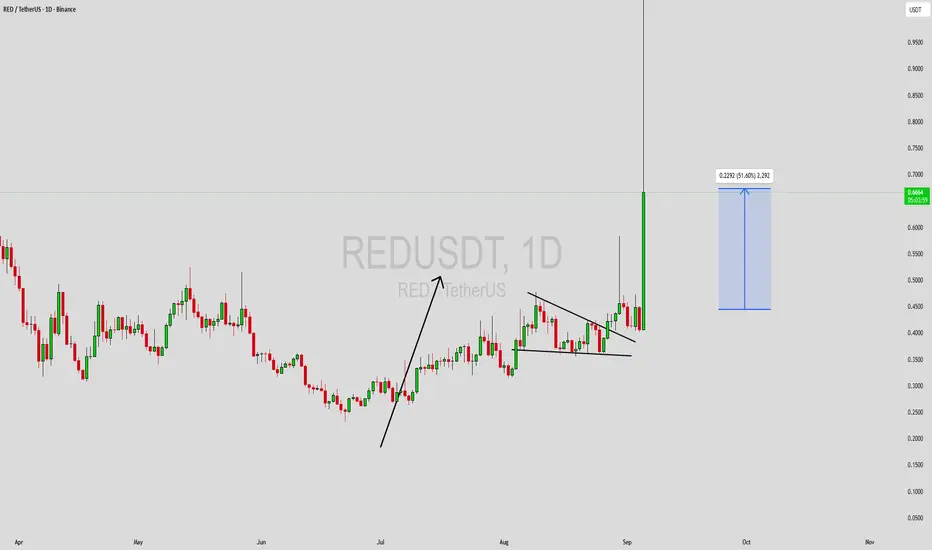
RED/USDT - GOD Candle Over the past two months, RED/USDT has been trending in a sloppy but steady uptrend, signaling accumulation and gradual strength building. Recently, price has successfully reclaimed the $0.35 zone and stabilized above it, a strong indication that buyers are firmly in control.
This reclaim sets the stage for the next expansion move. With momentum aligning, the structure suggests a “God candle” rally may be imminent, with upside potential targeting the $1.00 zone as the final objective.

#RED/USDT – Too Late, or One More Chance?#RED
The price is moving within a descending channel on the 1-hour frame, adhering well to it, and is heading for a strong breakout and retest.
We have a bearish trend on the RSI indicator that is about to be broken and retested, supporting the upside.
There is a major support area (in green) at 0.4320, which represents a strong basis for the upside.
For inquiries, please leave a comment.
We are in a consolidation trend above the 100 moving average.
Entry price: 0.4478
First target: 0.4657
Second target: 0.4885
Third target: 0.5213
Don't forget a simple matter: capital management.
When you reach the first target, save some money and then change your stop-loss order to an entry order.
For inquiries, please leave a comment.
Thank you.

RED Market Update📊 RED Market Update
RED is currently retracing after its recent move 📉
If you missed the first entry or are looking for a re-entry / more accumulation, the smart play is to wait for price to reach the green support zone 🟢
👉 Volume Profile shows strong buyer accumulation at this level.
👉 If price pulls back and confirms a bounce, it could provide a high-probability long setup 🎯
⚠️ Reminder: Patience pays — entering at support with confirmation gives the best risk/reward.

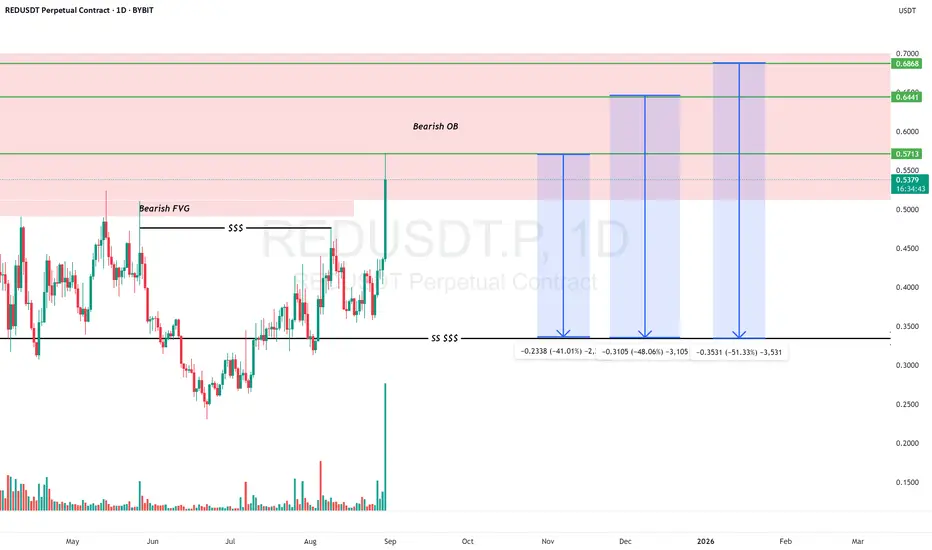
REDUSDT Next Possible MoveLikely a reversal to the downside from $0.5713, $0.6441 or $0.6868 provided the weekly order block is not mitigated.
The preferred position should be a short position.
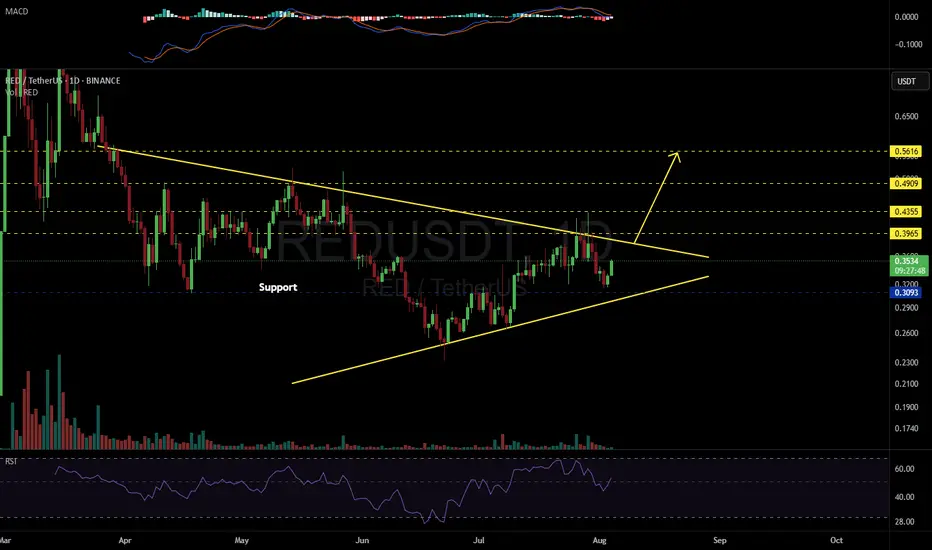
REDUSDT 1D#RED is moving inside a symmetrical triangle on the daily chart.
📌 Consider buying at the current price and near the support level at $0.3093 in case of a dip.
If a breakout occurs above the triangle resistance, the potential upside targets are:
🎯 $0.3965
🎯 $0.4355
🎯 $0.4909
🎯 $0.5616
⚠️ As always, use a tight stop-loss and apply proper risk management.
REDUSDT – Too Late, or One More Chance?It might sound optimistic to expect another clean entry…
But if you’ve followed this market long enough,
you know RED has surprised before — especially when few are watching.
🟦 Blue Box Logic
This zone isn’t fantasy.
It’s drawn based on:
Volume profile imbalances
Areas where CDV has previously shifted early
Past zones where the footprint showed aggressive sellers losing control
🎯 Execution Plan
If RED offers another test of the box:
✅ I’ll watch absorption on footprint
✅ Confirm with CDV stability or rise
✅ Step in only if structure supports the idea
No emotion. No chasing.
📌I keep my charts clean and simple because I believe clarity leads to better decisions.
📌My approach is built on years of experience and a solid track record. I don’t claim to know it all but I’m confident in my ability to spot high-probability setups.
📌If you would like to learn how to use the heatmap, cumulative volume delta and volume footprint techniques that I use below to determine very accurate demand regions, you can send me a private message. I help anyone who wants it completely free of charge.
🔑I have a long list of my proven technique below:
🎯 ZENUSDT.P: Patience & Profitability | %230 Reaction from the Sniper Entry
🐶 DOGEUSDT.P: Next Move
🎨 RENDERUSDT.P: Opportunity of the Month
💎 ETHUSDT.P: Where to Retrace
🟢 BNBUSDT.P: Potential Surge
📊 BTC Dominance: Reaction Zone
🌊 WAVESUSDT.P: Demand Zone Potential
🟣 UNIUSDT.P: Long-Term Trade
🔵 XRPUSDT.P: Entry Zones
🔗 LINKUSDT.P: Follow The River
📈 BTCUSDT.P: Two Key Demand Zones
🟩 POLUSDT: Bullish Momentum
🌟 PENDLEUSDT.P: Where Opportunity Meets Precision
🔥 BTCUSDT.P: Liquidation of Highly Leveraged Longs
🌊 SOLUSDT.P: SOL's Dip - Your Opportunity
🐸 1000PEPEUSDT.P: Prime Bounce Zone Unlocked
🚀 ETHUSDT.P: Set to Explode - Don't Miss This Game Changer
🤖 IQUSDT: Smart Plan
⚡️ PONDUSDT: A Trade Not Taken Is Better Than a Losing One
💼 STMXUSDT: 2 Buying Areas
🐢 TURBOUSDT: Buy Zones and Buyer Presence
🌍 ICPUSDT.P: Massive Upside Potential | Check the Trade Update For Seeing Results
🟠 IDEXUSDT: Spot Buy Area | %26 Profit if You Trade with MSB
📌 USUALUSDT: Buyers Are Active + %70 Profit in Total
🌟 FORTHUSDT: Sniper Entry +%26 Reaction
🐳 QKCUSDT: Sniper Entry +%57 Reaction
📊 BTC.D: Retest of Key Area Highly Likely
📊 XNOUSDT %80 Reaction with a Simple Blue Box!
📊 BELUSDT Amazing %120 Reaction!
📊 Simple Red Box, Extraordinary Results
📊 TIAUSDT | Still No Buyers—Maintaining a Bearish Outlook
📊 OGNUSDT | One of Today’s Highest Volume Gainers – +32.44%
📊 TRXUSDT - I Do My Thing Again
📊 FLOKIUSDT - +%100 From Blue Box!
📊 SFP/USDT - Perfect Entry %80 Profit!
📊 AAVEUSDT - WE DID IT AGAIN!
I stopped adding to the list because it's kinda tiring to add 5-10 charts in every move but you can check my profile and see that it goes on..

REDUSDT Forming Falling WedgeREDUSDT is attracting fresh eyes in the crypto community as this pair sets up for what could be a remarkable bullish move. The recent chart shows price action consolidating within a falling channel, hinting at a potential breakout scenario if the resistance trendline is successfully breached. With a strong volume profile backing this setup, REDUSDT is showing signs of healthy accumulation, suggesting that market participants are quietly building positions in anticipation of a trend reversal.
Many crypto traders are now closely watching REDUSDT because of its high-risk, high-reward potential, with an expected gain of 90% to 100%+. If the breakout confirms, the upside move could be sharp and decisive, driven by both technical momentum and fresh investor sentiment. This aligns with broader market conditions where investors are increasingly hunting for altcoins that can deliver outsized returns in a short period.
What makes REDUSDT even more compelling is the growing interest among investors in the underlying project and its ecosystem. A surge in community engagement and positive developments could serve as fundamental catalysts to sustain this projected bullish momentum. For traders, this setup could present a unique opportunity to catch an early trend before it gains mainstream attention.
✅ Show your support by hitting the like button and
✅ Leaving a comment below! (What is You opinion about this Coin)
Your feedback and engagement keep me inspired to share more insightful market analysis with you!


LIMIT ORDER - $RED/USDT ShortLIMIT ORDER - $RED/USDT
Direction: #Short 🔴
Entry Price: 0.3624
Stop Loss: 0.38677
Target 1: 0.34976
Target 2: 0.33713
Target 3: 0.32449
Target 4: 0.31186
Target 5: 0.29922
Reminder: Move the stop loss to breakeven once the 2nd target (0.33713) is reached.

REDUSDT – Resistance in Focus, Blue Box as Key IndicatorREDUSDT is currently operating in a strong resistance zone, and my analysis indicates that the blue box is the area to watch closely. This is where the battle between bulls and bears is most intense.
Key Insights:
Resistance Zone: REDUSDT is testing critical levels where selling pressure is predominant. This resistance zone is clearly established.
Blue Box Alert: The blue box marks an essential area for potential market reactions. Whether the price respects it or breaks through could determine your trade approach.
Trading Setup:
Short Bias Opportunity:
If the price approaches the blue box and exhibits weakness, I will look for lower time frame breakdowns as confirmation for short setups.
Confirmation is Critical:
Always wait for precise signals—LTF confirmation, CDV validation, and clear volume indications—before entering any trade.
Adaptive Strategy:
In the event the market unexpectedly breaks above the resistance with strong volume and retests the blue box as support, my bias will adjust accordingly. I do not insist on any position without solid confirmation.
Why Follow This Analysis:
I trade with discipline and precision; my approach is data-driven and results-oriented. My high success rate speaks for itself, and every level I mark has been rigorously tested in the market. If you want to trade with confidence and true market insight, following my analysis is key.
Stay vigilant, follow these confirmed signals, and trade smartly.
I keep my charts clean and simple because I believe clarity leads to better decisions.
My approach is built on years of experience and a solid track record. I don’t claim to know it all, but I’m confident in my ability to spot high-probability setups.
If you would like to learn how to use the heatmap, cumulative volume delta and volume footprint techniques that I use below to determine very accurate demand regions, you can send me a private message. I help anyone who wants it completely free of charge.
I have a long list of my proven technique below:
🎯 ZENUSDT.P: Patience & Profitability | %230 Reaction from the Sniper Entry
🐶 DOGEUSDT.P: Next Move
🎨 RENDERUSDT.P: Opportunity of the Month
💎 ETHUSDT.P: Where to Retrace
🟢 BNBUSDT.P: Potential Surge
📊 BTC Dominance: Reaction Zone
🌊 WAVESUSDT.P: Demand Zone Potential
🟣 UNIUSDT.P: Long-Term Trade
🔵 XRPUSDT.P: Entry Zones
🔗 LINKUSDT.P: Follow The River
📈 BTCUSDT.P: Two Key Demand Zones
🟩 POLUSDT: Bullish Momentum
🌟 PENDLEUSDT.P: Where Opportunity Meets Precision
🔥 BTCUSDT.P: Liquidation of Highly Leveraged Longs
🌊 SOLUSDT.P: SOL's Dip - Your Opportunity
🐸 1000PEPEUSDT.P: Prime Bounce Zone Unlocked
🚀 ETHUSDT.P: Set to Explode - Don't Miss This Game Changer
🤖 IQUSDT: Smart Plan
⚡️ PONDUSDT: A Trade Not Taken Is Better Than a Losing One
💼 STMXUSDT: 2 Buying Areas
🐢 TURBOUSDT: Buy Zones and Buyer Presence
🌍 ICPUSDT.P: Massive Upside Potential | Check the Trade Update For Seeing Results
🟠 IDEXUSDT: Spot Buy Area | %26 Profit if You Trade with MSB
📌 USUALUSDT: Buyers Are Active + %70 Profit in Total
🌟 FORTHUSDT: Sniper Entry +%26 Reaction
🐳 QKCUSDT: Sniper Entry +%57 Reaction
📊 BTC.D: Retest of Key Area Highly Likely
I stopped adding to the list because it's kinda tiring to add 5-10 charts in every move but you can check my profile and see that it goes on..
A tiny part of my runners;
🌊 WAVESUSDT.P: Demand Zone Potential
🟣 UNIUSDT.P: Long-Term Trade
🔵 XRPUSDT.P: Entry Zones
🔗 LINKUSDT.P: Follow The River
📈 BTCUSDT.P: Two Key Demand Zones
A tiny part of my runners;
💼 STMXUSDT: 2 Buying Areas
🐢 TURBOUSDT: Buy Zones and Buyer Presence
🌍 ICPUSDT.P: Massive Upside Potential | Check the Trade Update For Seeing Results
🟠 IDEXUSDT: Spot Buy Area | %26 Profit if You Trade with MSB
📌 USUALUSDT: Buyers Are Active + %70 Profit in Total
🌟 FORTHUSDT: Sniper Entry +%26 Reaction
🐳 QKCUSDT: Sniper Entry +%57 Reaction
j
📌I keep my charts clean and simple because I believe clarity leads to better decisions.
📌My approach is built on years of experience and a solid track record. I don’t claim to know it all but I’m confident in my ability to spot high-probability setups.
📌If you would like to learn how to use the heatmap, cumulative volume delta and volume footprint techniques that I use below to determine very accurate demand regions, you can send me a private message. I help anyone who wants it completely free of charge.
🔑I have a long list of my proven technique below:
🎯 ZENUSDT.P: Patience & Profitability | %230 Reaction from the Sniper Entry
🐶 DOGEUSDT.P: Next Move
🎨 RENDERUSDT.P: Opportunity of the Month
💎 ETHUSDT.P: Where to Retrace
🟢 BNBUSDT.P: Potential Surge
📊 BTC Dominance: Reaction Zone
🌊 WAVESUSDT.P: Demand Zone Potential
🟣 UNIUSDT.P: Long-Term Trade
🔵 XRPUSDT.P: Entry Zones
🔗 LINKUSDT.P: Follow The River
📈 BTCUSDT.P: Two Key Demand Zones
🟩 POLUSDT: Bullish Momentum
🌟 PENDLEUSDT.P: Where Opportunity Meets Precision
🔥 BTCUSDT.P: Liquidation of Highly Leveraged Longs
🌊 SOLUSDT.P: SOL's Dip - Your Opportunity
🐸 1000PEPEUSDT.P: Prime Bounce Zone Unlocked
🚀 ETHUSDT.P: Set to Explode - Don't Miss This Game Changer
🤖 IQUSDT: Smart Plan
⚡️ PONDUSDT: A Trade Not Taken Is Better Than a Losing One
💼 STMXUSDT: 2 Buying Areas
🐢 TURBOUSDT: Buy Zones and Buyer Presence
🌍 ICPUSDT.P: Massive Upside Potential | Check the Trade Update For Seeing Results
🟠 IDEXUSDT: Spot Buy Area | %26 Profit if You Trade with MSB
📌 USUALUSDT: Buyers Are Active + %70 Profit in Total
🌟 FORTHUSDT: Sniper Entry +%26 Reaction
🐳 QKCUSDT: Sniper Entry +%57 Reaction
📊 BTC.D: Retest of Key Area Highly Likely
📊 XNOUSDT %80 Reaction with a Simple Blue Box!
📊 BELUSDT Amazing %120 Reaction!
I stopped adding to the list because it's kinda tiring to add 5-10 charts in every move but you can check my profile and see that it goes on..

RED looks bearish (4H)From the point where we placed the red arrow on the chart, the RED correction has begun.
It seems to be inside an ABC structure, and we are currently in wave C, which is bearish.
A demand zone is visible on the chart, which could temporarily reject the price upward.
Since wave B did not retrace more than 0.618 of wave A, it is expected that the low of wave A will be taken out.
For risk management, please don't forget stop loss and capital management
Comment if you have any questions
Thank You

RED New Update (4H)This analysis is an update of the analysis you see in the "Related publications" section
The previous analysis scenario has expired, and this update's scenario is valid.
Given the time correction of recent waves and the absence of sharp drops, this scenario for RED is valid, and buyers' footprints can be seen on the chart.
We expect a strong rejection to the upside from the green zone.
From the point where we placed the red arrow on the chart, it seems that RED's correction has started, which appears to be either a diametric or a triangle.
Wave C itself has formed a diametric, and it is expected to end in the green zone, leading to a bullish wave D.
The closure of a daily candle below the invalidation level will invalidate this analysis.
For risk management, please don't forget stop loss and capital management
When we reach the first target, save some profit and then change the stop to entry
Comment if you have any questions
Thank You

RED buy/long setup (4H)It is one of the new symbols with a bullish chart.
A bullish CH is present on the chart. A supply zone has been cleared. A strong demand zone is located at the bottom.
We are looking for buy/long positions in the demand zone.
Targets are marked on the chart.
A daily candle close below the invalidation level will invalidate this analysis
Do not enter the position without capital management and stop setting
Comment if you have any questions
thank you

REDUSDT – Critical Resistance Zone! Read Carefully!Most traders LOSE MONEY because they act without a plan. They FOMO, they guess, they get liquidated. But we don’t trade like that.
Do you think I just take the first supply zone for shorts and first demand zone for longs ? It's not a mechanical process It has 3 main elements,
1- A coin/token with high volume increase, it means there are trading bots inside there and I can analyze their actions.
2- Volume footprint charts to see what levels trading bots are protecting, it's 3 step process with TPO charts and volume charts.
3- Coin Characteristics, all coins doesn't have similar characteristics, this is the perfect example of it. Please ANALYZE THIS!
As you can see we have double control points of very high volume bars in the red area. Other conditions are okey but I won't explain them because it will be too complicated. Today's lesson is this, thank you for listening.
🚨 Red Box = High-Risk Resistance Zone – This is where uninformed traders get trapped. But if you’re following me, you know better.
📌 The Smart Plan:
✅ Step 1: Wait for the price to reach the red box—no emotions, no impulsive trades.
✅ Step 2: Watch LTF structure + CDV shifts. If sellers step in and volume profile supports it, we execute.
✅ Step 3: If resistance holds, we short with precision. If it breaks with volume + retest, we flip bullish.
✅ Step 4: Risk is everything—trading isn’t gambling. The last swing high is the only stop that makes sense here.
📢 If you’re not following me, you’re trading blind. Stay ahead, trade smart, and watch how the market respects our levels.


RedusdtHere is one short scalp in Redusdt total 10 percent in spot against 3 percent Stop loss 🛑 please maintain tight SL if you are taking in future trade bcoz it high volatile crypto.

#REDUSDT continues its downtrend📉 Short BYBIT:REDUSDT.P from $0,7814
🛡 Stop loss $0,8061
🕒 1H Timeframe
⚡️ Overview:
➡️ The main POC (Point of Control) is 0,5802
🎯 TP Targets:
💎 TP 1: $0,7600
💎 TP 2: $0,7330
💎 TP 3: $0,7112
📢 Monitor key levels before entering the trade!
BYBIT:REDUSDT.P continues its downtrend — watching for further movement!

REDUSDT - It gives you money!Its not redbull is redusdt, Plan your shorts well before buying, Rather wait for the shorts from the points mentioned
