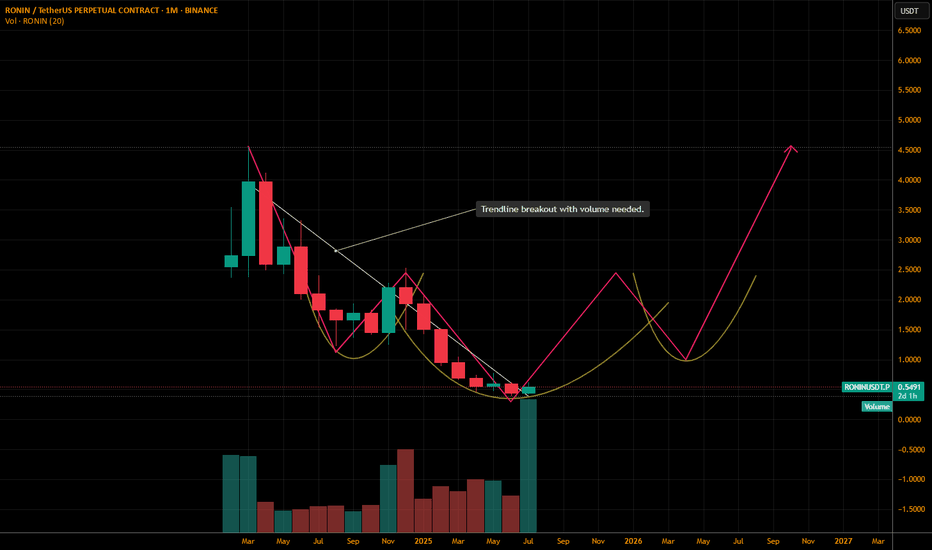
RONINUSDT Forming Falling WedgeRONINUSDT is forming a falling wedge pattern, which is considered one of the strongest bullish reversal signals in technical analysis. The price action has been consolidating with lower highs and lower lows, but the decreasing slope of the wedge highlights a weakening bearish trend. With solid tradi
RONINUSDT.PAs i promised the more you follow the more analysis ill post here.
If you want to buy now you can this is a swing trade,, Buy now, hold and manage.
The price will likely to make a inverse head and shoulder.
I am not setting any target for this.. or s.l
This might be risky.. so only buy if y
Ronin: Low Risk vs High Reward Potential It is interesting the large amount of volume that has been coming in recently. Just yesterday it was the highest on a daily basis since November 2024 and we know November 2024 was a bullish month.
There is a very strong wipeout candle here, 30-May. These can be taken as a strong reversal signal but
RONIN at Decision PointRONIN is currently reacting within a well defined immediate demand zone after completing a clear five-wave decline, marked by an extended corrective structure labeled WXY. This drop has brought price action into a technical exhaustion area, where buying interest is starting to emerge.
The confluenc
RONIN/USDTKey Level Zone: 0.4770 - 0.4800
HMT v8.1 detected. The setup looks promising, supported by a previous upward/downward trend with increasing volume and momentum, presenting an excellent reward-to-risk opportunity.
HMT (High Momentum Trending):
HMT is based on trend, momentum, volume, and market str
See all ideas
Summarizing what the indicators are suggesting.
Oscillators
Neutral
SellBuy
Strong sellStrong buy
Strong sellSellNeutralBuyStrong buy
Oscillators
Neutral
SellBuy
Strong sellStrong buy
Strong sellSellNeutralBuyStrong buy
Summary
Neutral
SellBuy
Strong sellStrong buy
Strong sellSellNeutralBuyStrong buy
Summary
Neutral
SellBuy
Strong sellStrong buy
Strong sellSellNeutralBuyStrong buy
Summary
Neutral
SellBuy
Strong sellStrong buy
Strong sellSellNeutralBuyStrong buy
Moving Averages
Neutral
SellBuy
Strong sellStrong buy
Strong sellSellNeutralBuyStrong buy
Moving Averages
Neutral
SellBuy
Strong sellStrong buy
Strong sellSellNeutralBuyStrong buy
Displays a symbol's price movements over previous years to identify recurring trends.


