ROSEUSDT 1D#ROSE has formed a symmetrical triangle pattern on the daily chart and is on the verge of breaking out above the triangle resistance and the daily SMA200. If that happens, the potential targets are:
🎯 $0.03548
🎯 $0.04051
🎯 $0.04554
🎯 $0.05270
🎯 $0.06182
⚠️ Always remember to use a tight stop-loss

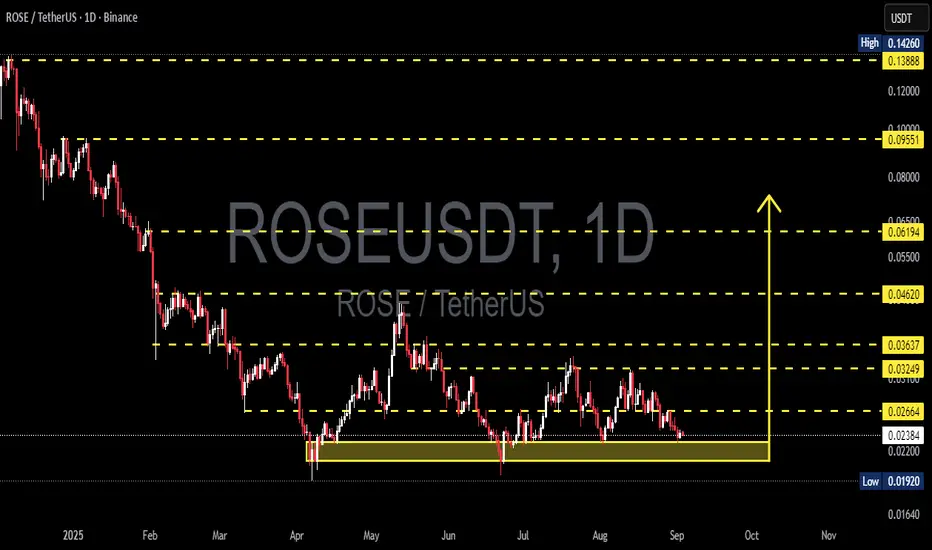
ROSE/USDT — Critical Demand Zone to Define the Next Big Move!🔎 Full Analysis
ROSE/USDT is currently trading inside a critical demand zone (0.01920 – 0.02388) that has been tested multiple times since April 2025. This area has acted as a foundation of support, holding back heavy selling pressure for months. The more often this zone gets tested, the higher the
ROSE Trading UpdateLSE:ROSE Trading Update
LSE:ROSE is retracing, and we are watching two key support zones for potential long entries:
First entry: around 0.02591
Second entry: around 0.02480
Both levels were previous resistance zones in the past and now align with POC + buyer accumulation, making them strong

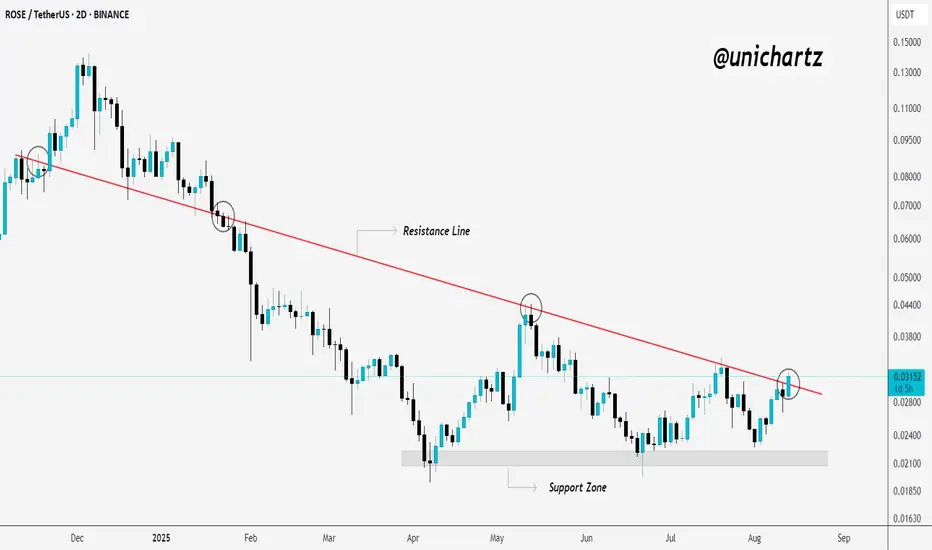
Rose is cooking something!First, let's take a look at the BINANCE:ROSEUSDT market trend.
Right now, we're chilling near its all-time low (ATL). The price has found great support in this zone multiple times, which has pushed it up towards the descending trendline that's acting as resistance.
We've got two resistance tren

OASIS NETWORK Technical Analysis Monthly chartThe Oasis Network is a layer-1 blockchain platform designed for privacy and scalability, using a proof-of-stake (PoS) consensus mechanism. Its native cryptocurrency, ROSE, facilitates transaction fees, staking, delegation, and governance within the ecosystem. Here’s a concise overview based on curre

ROSE/USDT: 150-200% Easy Profit Potential?BINANCE:ROSEUSDT is showing strong bullish signals on the daily chart , with a potential reversal from its long-term downward trend. Key points include a higher low formation , indicating building buyer momentum , dabble bottom pattern in 1week chart , and the EMA 500 at 0.02765 acting as a

Triple Bottom Power – ROSE Eyes Explosive Upside!$ROSE/USDT has formed a triple bottom pattern, signaling strong buying interest at the support zone. Price is now testing the key descending resistance line.
If it manages to close decisively above this level, we could see a strong upside move.
Until then, keep it on your watchlist and monitor clo
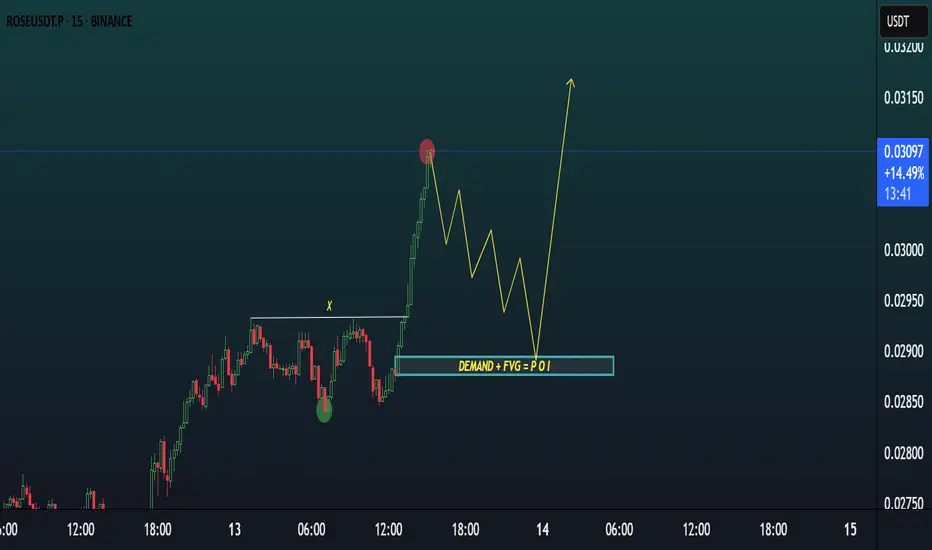
ROSEUSDT TRADE IDEA. ROSEUSDT – Smart Money Setup
✅ Bullish BOS Completed – Market structure shifted bullish after breaking recent highs.
📍 POI Marked for Pullback Entry – Demand Zone + FVG at 0.0290 aligns with structural support, making it our ideal buy zone.
🔍 Plan:
We will wait for price to retrace into the
$roseno brainer buy her looking for 6c then higher after the pullback
let see what we get still lagging here compared to last cycle

$ROSE do or die situationI have categorized the chart in different sections so it becomes more easy to read.
We have found support at those lows that is categorized as BUY ZONE imo. non financial advise.
the past few days everything across the board has been seeing a price decrease due to worldly events.
i opened a long o

See all ideas
Summarizing what the indicators are suggesting.
Oscillators
Neutral
SellBuy
Strong sellStrong buy
Strong sellSellNeutralBuyStrong buy
Oscillators
Neutral
SellBuy
Strong sellStrong buy
Strong sellSellNeutralBuyStrong buy
Summary
Neutral
SellBuy
Strong sellStrong buy
Strong sellSellNeutralBuyStrong buy
Summary
Neutral
SellBuy
Strong sellStrong buy
Strong sellSellNeutralBuyStrong buy
Summary
Neutral
SellBuy
Strong sellStrong buy
Strong sellSellNeutralBuyStrong buy
Moving Averages
Neutral
SellBuy
Strong sellStrong buy
Strong sellSellNeutralBuyStrong buy
Moving Averages
Neutral
SellBuy
Strong sellStrong buy
Strong sellSellNeutralBuyStrong buy
Displays a symbol's price movements over previous years to identify recurring trends.
Curated watchlists where ROSEUSDT.P is featured.

Smart contracts: Make the smart decision
36 No. of Symbols

Up-and-coming crypto: New kids on the block
30 No. of Symbols
See all sparks