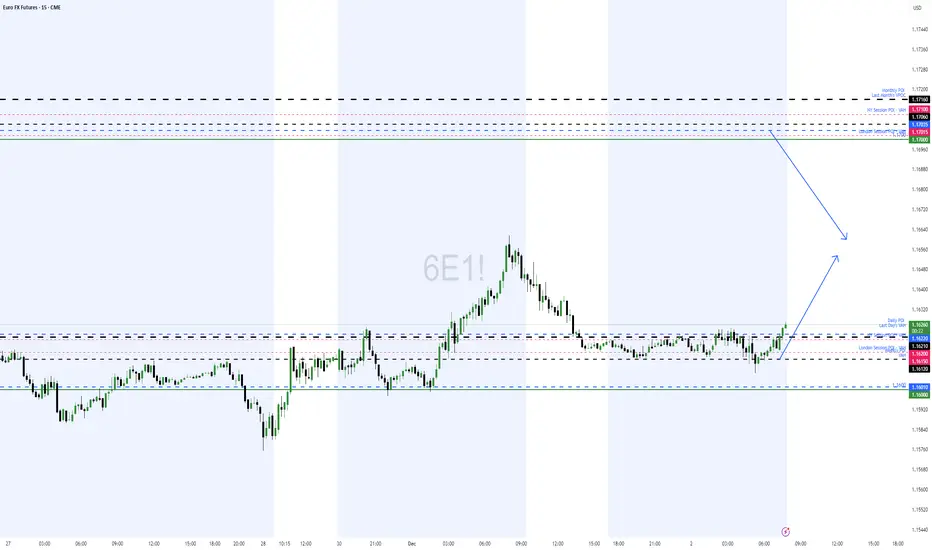
Value Suggest 6e is cheap. Looking at the monthly Vol profile o euro i see 1.162 as a key level to buy and price can be bought and sold at 1.175. but everything comes down to orderflow and what the buyers think.
Trade ideas
Euro FuturesEuro futures have displayed a clear upward trend over the last week, pushing higher primarily due to shifting expectations for U.S. Federal Reserve monetary policy. The move was ignited by weaker-than-expected economic data out of the U.S., such as a slowdown in the ADP private payrolls report and a softer ISM services index. This fueled market anticipation that the Fed is highly likely to ease monetary policy (cut rates) sooner than previously forecast. As U.S. interest rate expectations declined relative to the European Central Bank (ECB) outlook, the interest rate differential narrowed, making the Euro more attractive to investors compared to the U.S. Dollar and thus driving the Euro futures price higher.
This strength in Euro futures has persisted despite the European Central Bank (ECB) being widely expected to keep its interest rates unchanged at its upcoming meeting. The fundamental support for the Euro is largely coming from the weakness in its counter-currency, the U.S. Dollar. Furthermore, resilient economic indicators within the Eurozone, such as improving Purchasing Managers' Indices (PMIs) and signs of stabilizing domestic demand, have provided a floor for the currency. This environment of sustained European rates and anticipated U.S. cuts has created a favorable short-term macroeconomic backdrop for the Euro futures, causing the contract to trade at multi-week highs and suggesting market participants are pricing in continued Dollar headwinds.
If you have futures in your trading portfolio, you can check out on CME Group data plans available that suit your trading needs tradingview.com/cme/
*CME Group futures are not suitable for all investors and involve the risk of loss. Copyright © 2023 CME Group Inc.
**All examples in this report are hypothetical interpretations of situations and are used for explanation purposes only. The views in this report reflect solely those of the author and not necessarily those of CME Group or its affiliated institutions. This report and the information herein should not be considered investment advice or the results of actual market experience.

USD Index Proxy: EURUSD Breakout to Validate T-Note & XAGUSD MovThe Core Thesis: The Euro Futures chart, which is the mirror image of the US Dollar Index (DXY), is consolidating in a Symmetrical Triangle pattern. The direction of the inevitable breakout will be the ultimate fundamental driver for the Silver ATH move and the T-Note's wedge break. This chart holds the key to the macro move.
Technical Snapshot: The Symmetrical Triangle
The Pattern: The daily chart shows a clear Symmetrical Triangle formed since mid-2025, characterized by converging trendlines (lower highs and higher lows). This pattern signals indecision but precedes a high-momentum directional move.
Key Levels: The price is hovering near a critical support zone around 1.15000 and just above a major long-term EMA (shown in pink/red).
Trendline Breakouts:
Bullish Breakout: A decisive close above the upper trendline and the resistance around 1.16840 would confirm a move higher.
Bearish Breakdown: A close below the lower trendline and the major support cluster around 1.14300 - 1.15000 would confirm a move lower.

Euro Under Pressure as Dollar Dominance and Economic Worries WeiOver the past two weeks, the Euro futures have experienced significant downward pressure, struggling to hold ground against a strengthening U.S. Dollar. One driver of this depreciation has been a marked divergence in monetary policy expectations between the European Central Bank (ECB) and the Federal Reserve. While the Fed has maintained a hawkish stance, signaling higher-for-longer interest rates supported by resilient U.S. economic data, the ECB has appeared more cautious, with recent eurozone economic indicators hinting at a potential slowdown. This widening interest rate differential makes the Euro less attractive to yield-seeking investors, leading to capital flows away from the single currency and into the Dollar.
Adding to the Euro's woes, recent economic reports from key eurozone members have painted a picture of subdued growth and persistent inflationary challenges, creating a difficult balancing act for the ECB. Traders in FX futures have actively priced in these concerns, pushing the Euro to test critical support levels against the Dollar. This dynamic underscores how intertwined global economic performance and central bank rhetoric are in shaping currency valuations within the futures market, with the Euro's path heavily dependent on both domestic economic recovery signals and the evolving strength of the mighty U.S. Dollar.
If you have futures in your trading portfolio, you can check out on CME Group data plans available that suit your trading needs tradingview.com/cme/
*CME Group futures are not suitable for all investors and involve the risk of loss. Copyright © 2023 CME Group Inc.
**All examples in this report are hypothetical interpretations of situations and are used for explanation purposes only. The views in this report reflect solely those of the author and not necessarily those of CME Group or its affiliated institutions. This report and the information herein should not be considered investment advice or the results of actual market experience.

SP500, Bitcoin, Dollar & Euro Daily Trade SetupsIn this update we review the recent price action the SP500, Bitcoin, Dollar Index and the Euro and identify the high-probability trading opportunities and price objectives to target. To review today's video analysis, click here!

The COT trader - EUJust waiting for a strong bearish daily candle to form.
Take an entry on the next day daily open.
Target the previous swing lows.

GC1 & 6E1 Daily Trade SetupsIn this update we review the recent price action in the Gold and Euro futures and identify the next high probability trading opportunties and price objectives to target. To review today's video analysis click here!

EURUSD SHORTPrice tapped the supply zone at daily
overall trend bearish
ABC formation high probability for short trade to 1.1550
Trend safe

EURUSD - 3 ScenariosWe have 3 ascending channels.
1st one was breached & Retested earlier taking the chart into the 2nd green channel. We have seen rejection twice over SUPPORT 1 giving us a good bullish momentum; On the way up, chart broke a resistance line & retested it, turning it into SUPPORT 2.
Now we are heading for the red resistance zone.
We have 3 potential scenarios;
1- A CONTINUATION of the Upward Momentum keeping us inside the Green Channel.
2- BREACHING the green Channel and moving into the BLUE one, yet staying above SUPPORT 2. 3- BREACHING the green channel & SUPPORT 2.
Scenarios 1 & 2 remain favorable over 3. We need to watch how the chart will react in the red zone & watch out for FAKE Breakouts.
Trade Safe.

Long Euro at 1.165As euro yesterday respected our level of 1.162 we expect the move to continue till 1.17. I would like to get in at 1.165 for longs and if the price rejects 1.17-1.171 we will short the future.

Rapid ORB Pro in ActionOur indicator has popped a signal in the Asia session. We have already executed the trade and let see where we will go. Please remember to manage your trade all the time..

Runtime Error- Rapid ORB ProIf you facing this issue. please go the video this will solve the issue. this is just a memory buffer limitation. We just need to reset the buffer.

Rapid ORB Pro- In action- Hyper Precision signal NY sessionWe are providing update live trade with our indicator. Very clean signal generated by our indicator.
Hopefully by next week we will publish the guidelines.

Rapid ORB ProThis a live demonstration about our indicator. We will publish details tutorial in you tube and over her as well. How to use and guidelines to enter.

Next week 6E(EURUSD) BearishNext week’s price outlook appears bearish.
Market structure shows a clear downtrend following the confirmed break of the previous swing low.
Price is expected to retrace into the FVG before continuing lower toward the downside FVG.
The FVG is untapped. We have to watch the major support area . if the area broke, price has higher chance to reach the below FVG
The FVG below is a high-probability area, as five liquidity lows are positioned directly above it.

EUR/USD Running Flat Near CompletionAbout the Asset
Micro EUR/USD Futures on the CME are a smaller version of the standard EUR/USD futures contract. They move exactly like the EUR/USD currency pair, which reflects how strong or weak the Euro is compared to the US Dollar. Because the Dollar sits at the centre of the global financial system, the movements in this pair carry broader meaning. Traders often use EUR/USD as a guide to understand shifts in global liquidity and risk appetite.
Why This Chart Matters
A rising EUR/USD usually means the Dollar is weakening. When the Dollar weakens, financial conditions soften and risk assets often find support. A falling EUR/USD usually means the Dollar is strengthening, which can tighten liquidity and add pressure on equities and other risk-sensitive markets. Tracking this currency pair helps identify where global sentiment may turn next.
Relationship With SPX500
EUR/USD and the SPX500 tend to move in similar directions because both respond to the strength of the Dollar. When the Dollar strengthens, EUR/USD drops and the SPX500 often struggles. When the Dollar weakens, EUR/USD rises and the SPX500 usually recovers. The comparison on this chart shows how both markets have been moving through similar cycles. This helps confirm whether a turning point in EUR/USD is also likely to influence equities.
Elliott Wave Structure
From the early part of the chart, the pair completed a clear five-wave advance, ending near 1.1890. After this high, the market moved into a three-wave A-B-C correction. Wave A ended at 1.1420. Wave B then bounced strongly and briefly moved above the start of Wave A, which is a typical sign of a running flat structure.
Wave C has been weak and overlapping, which fits the behaviour of an ending diagonal. Diagonals often show slowing momentum and choppy swings, and they tend to appear at the end of a corrective pattern. Importantly, Wave C has not broken below the Wave A low at 1.1420. This supports the running flat idea, where the final leg fails to make a new low.
Key Levels
The level at 1.1420 is the invalidation point for the bullish running flat structure. As long as price stays above this level, the market retains the potential to complete Wave C and turn higher. The area around 1.1500 to 1.1520 has already shown some reaction, hinting that the diagonal may be complete or close to completing.
A break above the downward-sloping trendline that has contained the recent decline would be the first sign of strength. A stronger confirmation would come if price moves above the high of the internal Wave (4) within C.
What I Expect
If the running flat interpretation is correct, the market may bounce before testing the 1.1420 low. Ending diagonals are known for turning early, and failed C-waves are common in this pattern. A recovery from the current zone would align with the SPX500 pullback slowing down as well. Both assets would then be in a position to move higher together if the Dollar’s strength eases.
Disclaimer: This analysis is for educational purposes only and does not constitute investment advice. Please do your own research (DYOR) before making any trading decisions.

Rapid ORB ProLive trade using our advanced indicator. This is free for everyone to use in trading view. We are working with guidelines and different ways to enter trade with out indicator. This will make everyone profitable.

EURUSD long with the most obvious signals.This is a dream of a longshot. What better time than now, when so much is happening in the world and the price has retested the support already, to dream? When the trend is poised to spring up after a retraction, the eventuality is on the buyers. We need the price back up to sell it again.

FX Futures: Dollar Strength Prevails Amidst Shifting Global TideOver the past two weeks, the FX futures landscape has been largely dominated by a resurgent U.S. Dollar, creating distinct trends across major currency pairs. The Dollar Index futures have shown a clear upward trajectory, fueled by a hawkish tone from the Federal Reserve, robust U.S. economic data, and a persistent belief that interest rates will remain higher for longer. This Dollar strength has put significant pressure on its counterparts. Euro futures struggled to maintain ground, testing key support levels as eurozone economic indicators hinted at a potential slowdown, making the ECB's less hawkish stance more pronounced. Similarly, British Pound futures faced headwinds, reflecting ongoing concerns about inflation and growth in the UK.
Beyond the majors, Japanese Yen futures continued their multi-week slide, extending losses as the Bank of Japan remained steadfast in its ultra-loose monetary policy, creating a widening interest rate differential with the U.S. On the other hand, Canadian Dollar futures showed a bit more resilience, benefiting from a relatively stable oil market and domestic economic data that provided some support. Traders across the board are keenly watching central bank commentary and upcoming inflation prints, as these will likely dictate whether the Dollar's reign continues unchallenged or if other currencies can find a catalyst for a reversal in the weeks ahead.
*CME Group futures are not suitable for all investors and involve the risk of loss. Copyright © 2023 CME Group Inc.
**All examples in this report are hypothetical interpretations of situations and are used for explanation purposes only. The views in this report reflect solely those of the author and not necessarily those of CME Group or its affiliated institutions. This report and the information herein should not be considered investment advice or the results of actual market experience.

EUR/USD: Local Selling OpportunityTechnical Situation
EUR/USD shows an interesting local setup. The price has tested a key resistance level twice, which has proven its strength and halted the upward movement.
Current Picture
Currently, the quotes are located at a high-volume zone, where sellers' reaction to the decline is already visible. This could be a signal for entering short positions.
Alternative Scenario
A scenario where the price makes another move higher—towards the next volume zone—is not ruled out. In this case, selling opportunities will become even more relevant with an improved risk/reward ratio.
Entry Points
Selling is relevant:
From current levels
Upon updating local highs followed by a pullback
Additional Context
The presented analysis reflects the local picture. To understand the broader situation on EUR/USD, I recommend checking my previous publications.
Important: Don't forget to monitor the Dollar Index (DXY) dynamics, as it directly affects EUR/USD movement.

Euro Sentiment: What’s Ahead in the Next Few DaysRetail positioning tells a clear story:
70% short / 30% long on EUR/USD
→ That’s a textbook setup for a long .
The crowd is bearish — but structure favors bulls.
From a technical standpoint, we’re seeing a solid corrective move up from 1.15, with even a mini-higher high – higher low pattern forming — yes, like the ones in classic TA textbooks.
It looks not just logical… but inviting.
Now let’s look at the options market:
There’s real bullish momentum building:
1. Naked calls being bought
2. Call spreads actively traded
My focus is on two key structures:
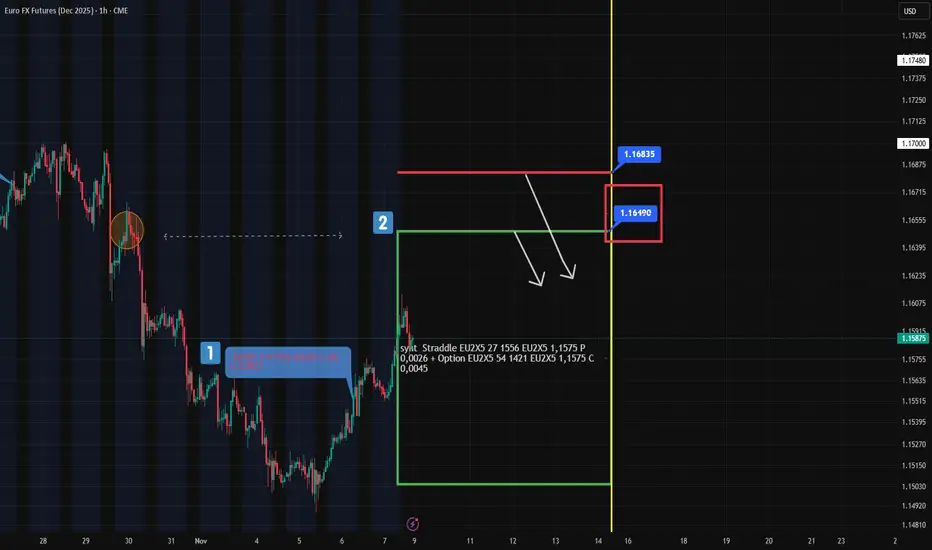
First, the call at 1.165, entered on November 6 — now already in the money (#1 at chart)
Friday’s straddle at 1.1575 — its upper boundary aligns perfectly with the trigger level from October 29 (#2 at chart)
🎯 Confluence? Yes.
🔍 Putting It All Together:
We have fuel for further upside in EUR:
Retail overcrowded short
Technical structure improving
Options flow turning bullish
But resistance looms ahead:
1.1649 and up to 1.1683 (futures prices) are strong zones
These levels could cap the upside move and offer high-probability short setups
👉 In particular, 1.1649 stands out as an ideal zone to consider a short.
On Monday, I’ll calculate the Expected Range (ER) levels — and if it aligns with this resistance, I’ll definitely place a limit order here.
Not using ER levels yet?
Spend one minute learning them — and gain the edge most traders overlook.
EUR/USD – Short-Term Structural Continuation SetupGlobal Macro Context
The Federal Reserve continues to maintain a neutral–dovish stance, showing no urgency to cut rates.
With no COT Report and no major updates on monetary policy this week, the macro narrative remains unchanged.
We also didn’t have the JOLTS release, and we’re unlikely to have Payroll data tomorrow due to the ongoing government shutdown.
This absence of labor data makes it difficult for Fed members to justify any near-term rate cut.
Hence, monetary expectations remain stable, supporting a relatively firm U.S. dollar in the short run.
Market Structure & Price Action
From a long-term perspective, EUR/USD remains in a bullish structure.
We recently saw a bearish failed auction inside a long-term demand zone, with buyers successfully producing a short-term structural shift (CHoCH) to the upside.
Price had moved outside the Value Area (VA) of the previous medium- and long-term impulses —
a typical condition for retracement. Several inefficiencies were left behind,
so the current upward correction is consistent with restoring balance.
However, the medium-term structure is still bearish and dominant,
and when sellers react from upper supply zones, they’ll likely attempt to violate the current short-term bullish structure and realign the broader framework to bearish —
consistent with the slower monetary transition implied by the Fed’s stance.
At the moment, the focus remains on aligning with the short-term bullish bias,
and reassessing near the vPOC of the medium-term VA,
where renewed selling pressure could emerge.
Volume & Order Flow Analysis
The demand zones within the current short-term dealing range were validated by strong confluence:
Technical discount (retracement toward 75%),
Positive Delta Cluster (confirming buyer aggression at discount),
VWAP alignment (institutional mean reversion level).
The lower demand zone corresponds to the accumulation base that originated this entire move —
the true institutional demand, where the bulk of long positions were established and will likely be defended.
The upper demand represents a reaccumulation leg,
where price overlapped a previous supply that failed to hold —
the moment sellers lost control and bullish momentum accelerated.
Outlook
Tomorrow would normally bring COT and Payroll,
but due to the ongoing U.S. shutdown, no major macro data is expected.
Therefore, price action will likely depend on order flow and continuation dynamics,
especially around VWAP and the short-term demand zones.
The plan remains to trade in alignment with the short-term bullish structure,
focusing on continuation entries as long as demand holds and Delta confirms sustained buying aggression.

6E/Eurusd buyI am buying 6E/Eurusd at this High-Level demand area.
Entry : 1.14880
SL :1.14105
TP : 1.15650
