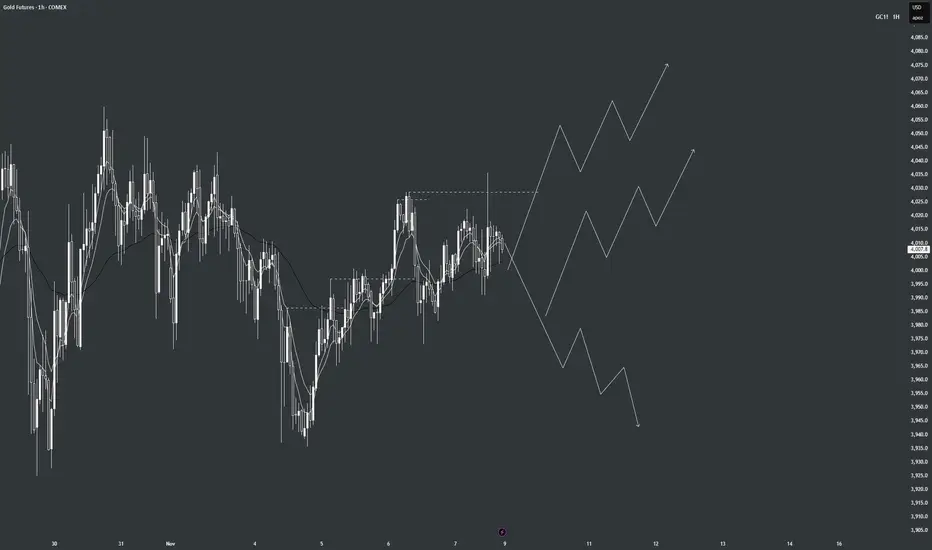
GC Weekly Outlook | November 10–14, 2025Gold has been slowly breaking structure and surfing the 50ema. We creeped up inside the 1hr range last week and liquidated those highs. We could see price continue to the upside this week November 10-14. I am expecting the 1hr o continue to push higher, we can possibly get a deeper pullback until that impulse. I always make sure to follow the trend on the 1hr timeframe since I enter on the lower timeframes. The trend is your friend.
Trade ideas
GoldFail to brake out of the triangle indicating manipulation sweeping the highs closing back in the range. If price reject the 50% of the daily wick look for a short set up cuz lower prices be the best probability.

Gold futures to break back down the 4000?As we all know Gold has had an incredible rally this year,
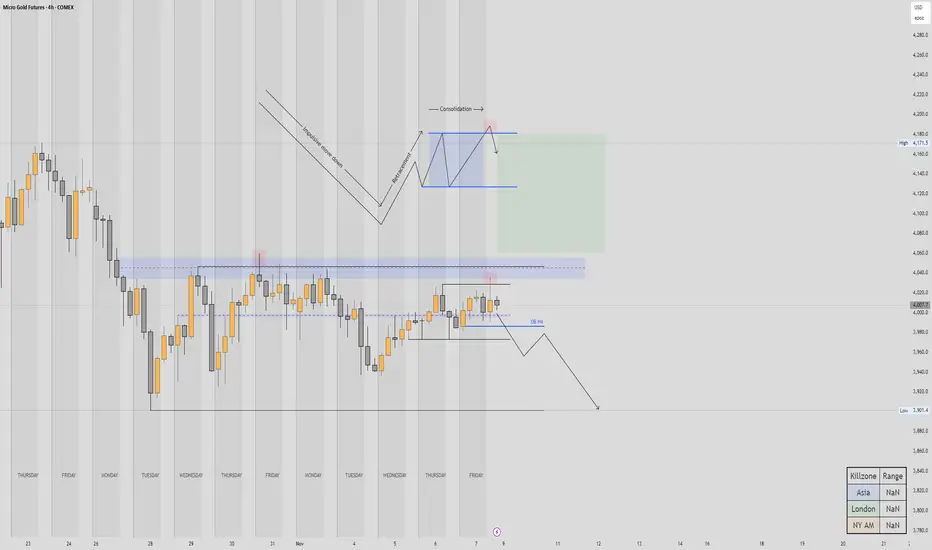
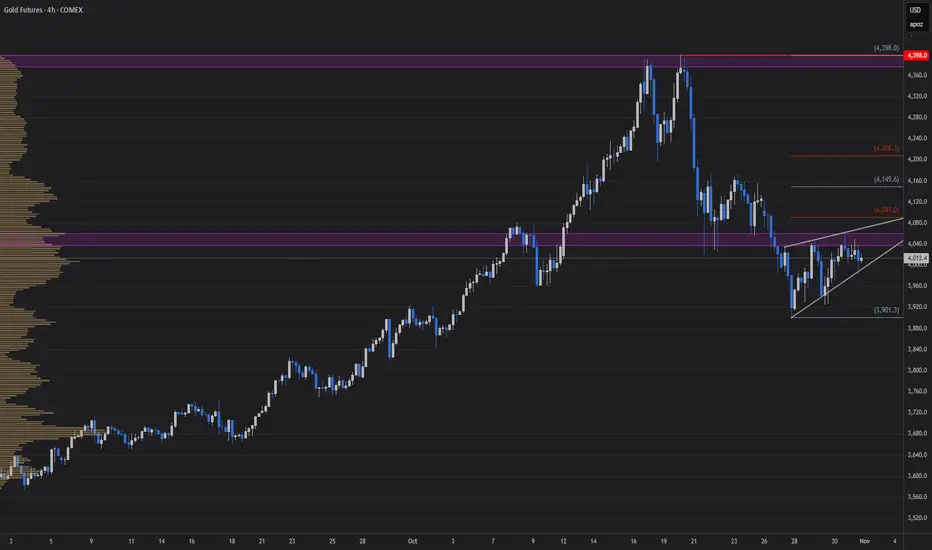
Though, it's been consolidating for the last two weeks, and as far as the structure of the consolidation, some of the liquidity has been taken from the daily FVG on Oct the 30th, leaving a permanent high on the H4 chart with a nice bearish candle
Then it consolidated again for a bit, got an impulse to the downside, retraced with difficulty back to the H4 order block, to consolidate again last 2 days of last week. Finally , it printed what could be more of a permanent high on friday afternoon.
The combination of this, plus the last two day's candles looking bearish, starts to advocate for a bearish bias.
Therefore I'd like to see the price go and reach for the low of the range, after it's breaking the H4 structure
Of course this idea could be invalidated, if Gold was to break above the recent high and the Daily FVG, then we'd reasses the situation.
Still, I would be cautious for longs, Gold has been very extended for a very long time, needs to cool off a bit so we can go buy some coins again!
Cheers!
Trade idea for monday1. Bullish Scenario (Breakout Play)
Entry: Wait for a confirmed breakout and 30-min candle close above 4,020–4,030.
Retest Entry: Enter on retest of 4,010–4,020 zone.
Targets:
TP1: 4,060 (first resistance)
TP2: 4,100
TP3: 4,160
Stop-Loss: Below 3,980 (below breakout candle or wedge support)
R:R: ~1:2.5 to 1:3 depending on target.
2. Bearish Scenario (Rejection Play)
Entry: If price rejects 4,020–4,030 and closes below 3,995.
Targets:
TP1: 3,960
TP2: 3,945 demand zone
Stop-Loss: Above 4,030
R:R: ~1:2 potential

Gold Gearing Up — Watch $4,000 for the Next Bull RunXAUUSD testing $4,000 support. A bullish reaction here could ignite the next leg up. Smart money likely re-entering — I’m looking to buy dips around this level with eyes on $4,200+.
COMEX:GC1! OANDA:XAUUSD OANDA:XAUEUR FX_IDC:XAUUSD TVC:DXY

GOLD FUTURERS: Critical levels for tradingMCX GOLD : Trading sideways with minor dips. Bias :Positive
Positional Buy :Once it starts giving a close above 1,21,000 for a fresh rally towards 1,22,000+
Positional sell :Once it gives a close below 1,20,000 for 1,17,000/1,10,000 levels
Major Support :1,20,000/1,17,000/1,10,000
Major Resistance :1,21000-1,21,100(For educational purpose only)

1H BUY OPPO. AFTER BREAK OF LEVEL1. Break of 4015 buy 1H CANDLE.
2. buy on retest on 3 levels:
a) 4013-4008 LEVEL.
b) 3987-3981 level.
c) 3977-3965 level.
if 1H candle close down 3956 level.
setup fails. out of it or stop buying now.

XAUXAUStraight from perplexity - Potential for a Return to $4,200
Gold prices have fluctuated but repeatedly tested the $4,200 level, and the consensus among many experts is that, despite recent corrections, gold could readily revisit or sustain levels near $4,200, depending on global economic events, monetary policy (especially Fed rate decisions), inflation, and geopolitical uncertainties.

Gold MCX Future - Intraday Technical Analysis - 5th Nov., 25MCX:GOLD1!
MCX Gold Futures — Chart Pathik Insights | 5-Nov-25
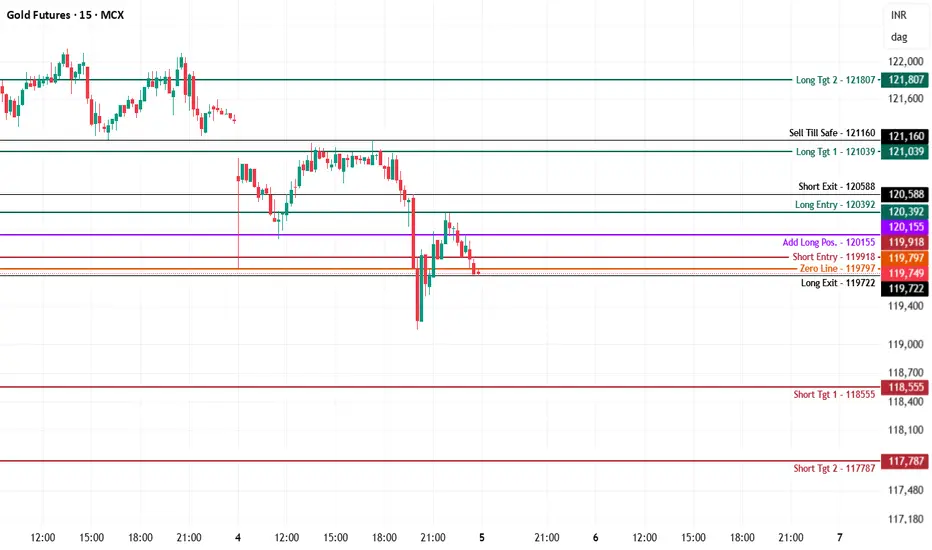
Gold futures are under selling pressure, trading stall at 119,749 right at the zero line after a sharp leg down and minor bounce attempts. Price remains weak as sellers control action just beneath the 120,000 psychological mark, pointing to possible further downside unless reclaimed by bulls.
Bearish Structure:
Short setups dominate below 119,918, with every failed retest of the add-long (120,155) keeping momentum with sellers.
Downside Levels:
118,555: First logical target for bears; cover some, trail the rest.
117,787: Aggressive extension if broad liquidation triggers.
Risk Management: Shorts should be managed above the add-long or zero line to minimize risk if a reversal takes hold.
Bullish Structure:
Longs to be considered only above 120,392, needing quick acceptance back in the prior higher band and strong closes above resistance.
Upside Levels:
121,039: Initial resistance for partial or full booking.
121,807: Extension if sentiment flips with volume.
Risk Management: Use the short-entry/zero-line as stops for any fresh longs caught in whipsaws.
Neutral/Inflection:
The 119,797–119,749 band marks the direct battle for the session — choppy price is likely until a firm imbalance emerges. Be patient for confirmation before executing size.
Use these mapped zones for optimal structure, adaptive entries, and aggressive defense.
If these levels clarify your daily plan, boost, comment, and share—your support boosts the learning loop.
Follow Chart Pathik for unbiased pivots, process-backed logic, and practical market learning.
GC week 45threw this together real quick.
T.A explained -
BS & FS levels are expected support when dashed lines, tested when dotted and resistance when solid lines.
The inverse is true for the Inv. BS Inv. FS levels, they are resistance as dashed lines, tested as dotted and support as solid lines.
Monthly timeframe is color pink
weekly grey
daily is red
4hr is orange
1hr is yellow
15min is blue
5min is green if they are shown.
strength favors the higher timeframe.
2x dotted levels are origin levels where trends have or will originate. When trends break, price will target the origin of the trend. its math, when the trend breaks, the vertex breaks too so the higher timeframe level/trend that breaks, the more volatility there could be as strength in the orders flow in to fuel the move.

GOLD COMEXGold looks weak and face Resistance in 4010 and 4050. On 1hour good setup for short. Target near 3810 and SL NEAR 4050 .

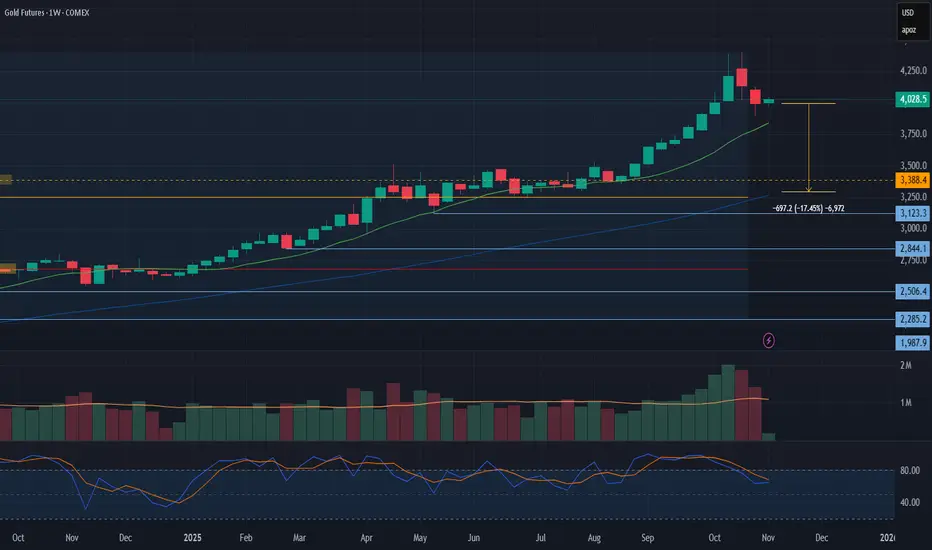
Gold futuresOver the past four weeks, gold futures have pulled back and fallen below the $4000 level. Formally, the trend remains bullish; however, from a historical perspective, it has already lasted nearly 1000 days, which leaves little room for further growth. In the event of a downward correction, gold could target the support level in the $3200-3300 range.
Long-term trend: Up
Resistance level: 4400
Support level: 3200-3300
GC Higher or Lower?Looking at GC on the 4 hour TF, we see it consolidating in a small rising wedge. If price wants to continue higher, I will be looking for price to drop back down to the $3980s level and then move higher breaking out of the wedge. If price wants to continue lower, I will be looking for price to make its way up to the 38.2% Fibonacci level marked on the chart, around $4090s, before breaking back down and creating another leg down in its recent downtrend.
What are your thoughts on GC?
Gold Today's gold chart has 11 drawings from the monthly timeframe in pink to the 15min timeframe in blue.
top down analysis favors the higher timeframe levels for strength but the best entries are found on the lower timeframes fractals confirming the larger timeframe direction.
Gold has broken an accumulation trend and is now looking for the liquidity from above to test the support at lower levels. We'll look back later and see which levels were taken and where liquidity was hiding,
price just tested a 4hr trend so price is in between the 1hr timeframe support ladder and daily resistance. If price can hold the 1hr timeframe, it has a chance to regain the daily trend or at least back test it.

Gold: Bearish Divergence Signals Weak MomentumFenzoFx—Gold tapped into the $4,050.00 buy-side liquidity yesterday, currently trading below this level. The cumulative volume delta demonstrates a lack of buying interest in gold, formed a bearish divergence with the price chart.
From a technical perspective, if Gold remains below $4,050.00, the price will likely decline toward the equal lows at $3,925.00.

GOLD might be resuming it's bullish trend soon!Price is breaking the trendline, made higher low and
now is making a higher high. IF confirmed this brekout.
And the faster moving averages crossover above the 55 EMA,
it will be configured a good entry point for Gold.
Now, with the price and faster moving averages 25 EMA
and 55 EMA between the 200 EMA and SMA moving averages, it's still in a non
decision zone for me.
After crossover, trend confirms, after higher high (with body), trend
confirms. If it goes above 4,171 and 4.394 with a good volume and
strenth, it might be a crystal clear indication of a new trend that can
go up to 5K pretty quick.

COMEX Gold Futures : Technical View
Gold futures are forming a falling wedge pattern, currently trading at ₹3,995. A break below ₹3,930 could indicate a short-term correction, while failing to sustain above ₹4,050 might lead to continued downward pressure.
Key Levels:
- Current Price: ₹3,995
- Support: ₹3,930
- Resistance: ₹4,050
- Potential Outcome: Break below ₹3,930 may lead to further decline, while sustaining above ₹4,050 could indicate a bullish reversal
Technical Analysis:
The falling wedge pattern suggests a potential reversal or continuation of the trend. If gold futures break below ₹3,930, it may signal a short-term correction. Conversely, sustaining above ₹4,050 could indicate a bullish reversal.

Bearish Gap Caps XAU/USD UpsideFenzoFx—Gold traded lower after it crossed above the descending trendline, capped at the $4,050.00 bearish gap. Currently, Gold is testing the trendline as support, with support at $3,925.00. The recent breakout has confirmation from cumulative volume delta, and the delta also made a new higher low and lower high.
The immediate support rests at $3,925.00. Yesterday, the price swept the sell-side liquidity by a few ticks below this level. This means the price should not return below this level in the current session if the market is bullish today.
From a technical perspective, if $3,925.00 support holds, XAU/USD will likely rise to take the buy-side liquidity at $4,050.00. Please note that the bearish outlook should be invalidated if the price closes below the immediate support. This setup has a 1 to 4 risk-to-reward.

Gold Could Finally Be Set for a BounceGold is on track for its second week lower, its first such bearish sequence since June. But clues on price action and options positioning suggests upside risks for gold could prevail.
Matt Simpson, Market Analyst at City Index.

GOLD REVERSAL Hello! Been on a holiday and am back.
Here is a swing trade on GOLD after a good fall and retracement. Gold has made a hammer on the daily timeframe. One can look for a reversal from here.
Entry- 119000-118800
Target- 120500, 121000, 121700
STOP- The low of hammer candle.
Note- You may enter as close as the low of the hammer candle.
Disclaimer- This is just for educational purpose
Jai Shree Ram.

GC Futures – Patience While the Market Waits for a CatalystYesterday’s session was pure range — no real direction, likely ahead of Fed news and the Trump-China talks. Price continues to consolidate beneath the H4 FVG and above the Daily Low (D-L), with both sides holding liquidity.
Until we see a clean displacement, I’m sitting on my hands and preserving capital. The market’s indecision is information — it’s telling us to wait.
Key levels remain 4,046 (D-H) and 3,930 (D-L) — any clean break beyond these zones should define the next directional move.
#Gold #Futures #GC #DayTrading #NoFOMO #ICT #OrderFlow #MarketStructure

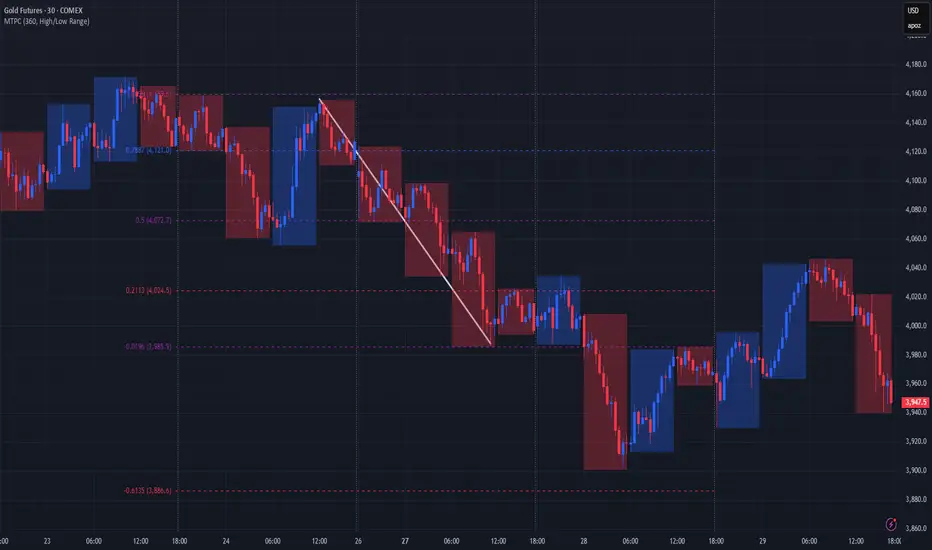
A better alternative to Fibonacci grid🙏🏻 Fibonacci based grid is a great inspiration from the Universe, but imo ain’t the final product, and here it is:
For traders
Use these values above and put em into grid tool here, and you’ll end up with uniform distribution based grid:
1.6134612334371357
1.0196152422706632
0.7886751345948129
0.5
0.21132486540518708
-0.019615242270663247
-0.6134612334371357
Then about how to apply it, you can divide trading activity by analytical units, these are in turn are based on:
^^ by price
^^ by time
^^ by signed volume waves/volume delta
Explanation
If you’ve followed my latest work you know I’ve identified a way to combine higher order moments to construct natural data driven estimates of data’s extremums and “ever possible” values (I still got no idea how no1 Ever posted it anywhere over the last centuries).
Now imagine you got only 2 input values: actual max and min (just like in Fibo grid, it ain’t knows nothing else). Given only these 2 values we can model stuff with uniform distribution that has precisely known values of standardized moments, so we end up with (and remember that uniform distro is symmetric around its mid, so all odd moments are zero):
dev = 1 / math.sqrt(12) //standard deviation
kurt = 1.8 //kurtosis (not excess ofc, the raw one)
hkurt = 27 / 7 //hyperkurtosis, 6th moment, raw af as well
0.5 + dev * hkurt
0.5 + dev * kurt
0.5 + dev
0.5
0.5 - dev
0.5 - dev * kurt
0.5 - dev * hkurt
And the resulting output of it u seen at the beginning of the post, notice how the edges *almost* match your lovely golden ratio.
For wanderers:
Now for the wanderers, creators etc etc etc
We might have a new math constant in our hands.
This can’t be a coincidence that limit levels (the ones at the edges) almost match the golden ratio . What if we find some kind of ‘almost’ uniform distro, where the limit levels would ‘exactly’ match the golden ratio? No problem - Beta distribution with parameters alpha = beta = (smth just a bit greater than 1).
I solved it numerically in python with mpmath library (necessary for high precision stuff, default packages are gonna truncate too much and we work with gamma functions there, high powers, huge numbers).
The following constant used as both parameters for Beta distribution provides us an almost uniform beautiful distro, with a minimal necessary deviation from uniform distro if u pls, just with a lil bit gently smoothed corners, and all connected to fibonacci sequence and golden ratio:
1.013156499304251804283836146883597463164059088989506487984660881392552993230097518061037104047261922219476043198153474114525730243848097530913517155085537693517359999905511951459927003624291626547046737804828112785002512650…
… and it goes on and on. I called it Sagitta constant, because visually it creates that beautiful almost flat shape, the minimal natural curvature. And now if we put this as c in Beta(c, c) following the same levels construction method from before we get these levels:
std = 0.28741741
K = 1.80628205
Hk = 3.88993123
0.5 + std * hk = 1.61803398
0.5 + std * k = 1.01915692
0.5 + std = 0.78741741
0.5 = 0.5
0.5 - std = 0.21258258
0.5 - std * k = -0.01915692
0.5 - std * hk = -0.61803398
Visuals, plots, graphics
^^ here you can see how our resulting distro & derivatives look like, kinda cute aye?
Beta(c, c), where c is our constant Sagitta, actually might be a natural prior for Bayesian stuff, almost a boxcar windowing function for DSP so u gonna tame that famous spectral leakage, or a kernel for KDE, like u name it, every case when u need a uniform shape yet with slightly relaxed endpoints, you can use it in design and architecture.
Go for it bros, test it in your R&D. Maybe some1 gonna use it to prove Riemann assumption conjecture , if u get dat milli send me 25% ima find a good use for it.
∞
gold to go another leg or two lower? 3800 or 3650gold achieves measured move just outside of timed zone from head and shoulders setup, retests bottom of initial shoulder, and returns to measured down move looking to break 3900 support down to 3800.
if downward momentum continues look for 3650 as solid support from an old upward trend line and parallel channel.
