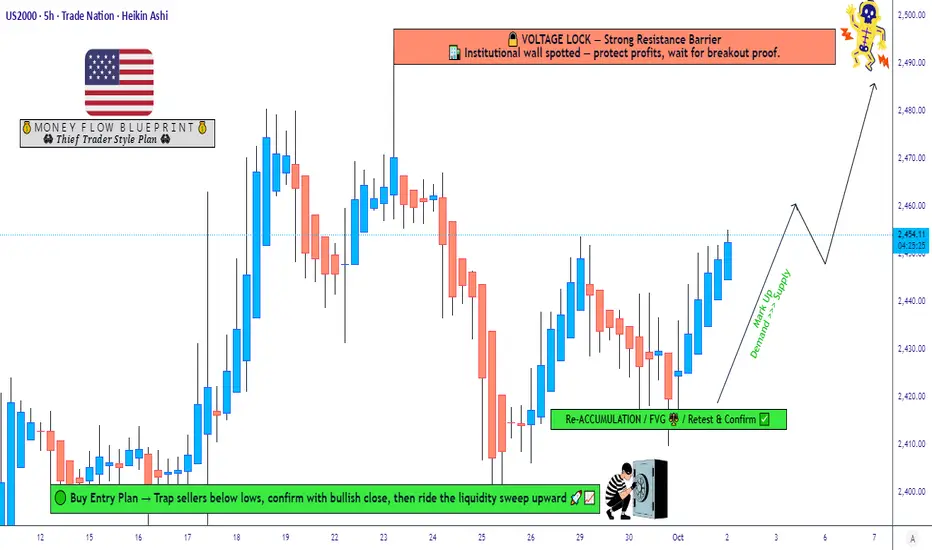
Can Small Caps Outperform as US2000 Approaches Resistance?📊 US2000 Index – Market Wealth Strategy Map (Swing/Day Trade)
Ladies & Gentlemen (Thief OG’s) – here’s a fresh layering entry plan for US2000 with a bullish outlook. This is my playful "Thief Strategy" style — multiple entries, multiple chances, and yes… multiple exits too. 😎
🔑 Plan: Bullish Bias
💸
Related indices
Russell 2000 Year-End Price Target and Technical Rebound OutlookIf you ahven`t bought the Double Bottom on RUT 2K:
Now the Russell 2000 Index (RUT), which tracks small-cap stocks, has recently entered oversold territory, signaling that a potential technical rebound could be on the horizon. Oversold conditions typically occur when selling pressure becomes exces

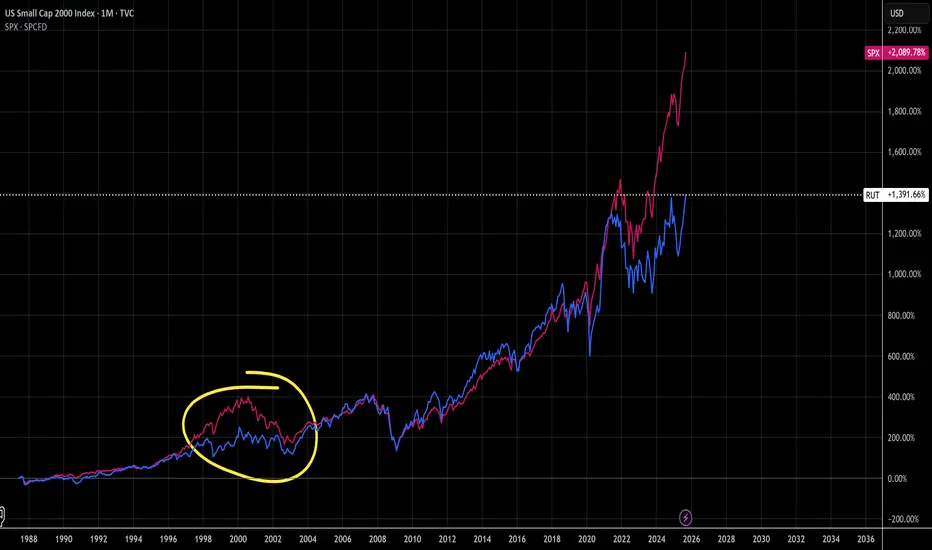
RUT vs SPX - A clear mirror of the 2000 Dot Com CrashTechnicals:
Here we compare the SPX in pink to the RUT in blue. You can see the last time the SPX overtook the RUT was in 1998-2002, if history repeats this puts us squarely in the late 1998. Unlike 1998, we see the RUT has made a higher high after it's V-shaped recovery which looks more promising
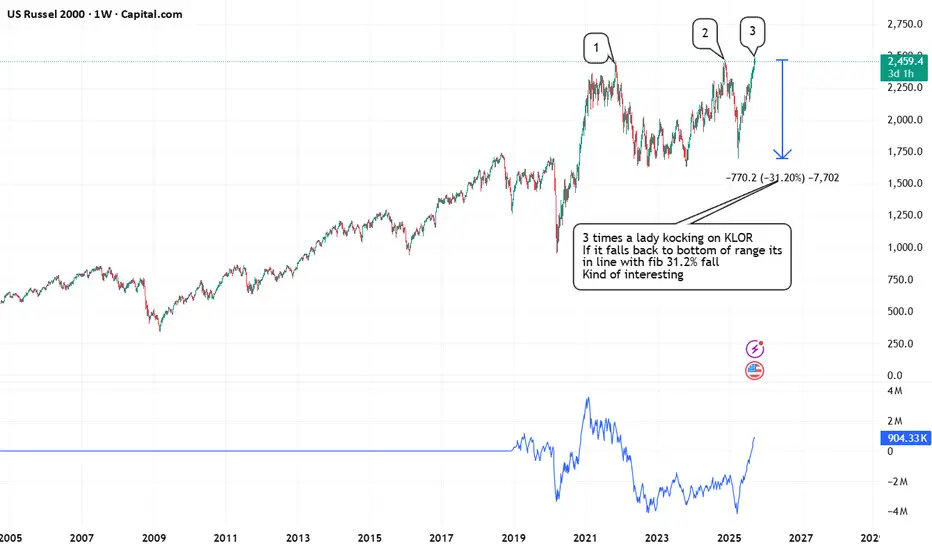
3 times a lady! Knock knock knocking on heavens door ...Bearish on the Russel
looks kind of toppy to me
love that if it goes back to the bottom of the range if so it falls 31.2% a fib number
Not advice - just for educational purposes
Oh there are next to no bears left out there out in the cold just feels like me!
you will need to count 5 small im
RTY ShortRTY is likely to face a potential decline from the 2430 level at point D of the crab pattern, with TP1 through TP3 serving as probable target objectives.

Russell eases to test key short-term supportThe Russell has bounce off its lows a tiny bit but could we now see a more decisive recovery heading deeper into the U.S. session?
The markets have been holding firm with tech sector leading the spx500 to a new high today, even though the index then came off earlier highs amid profit taking with go
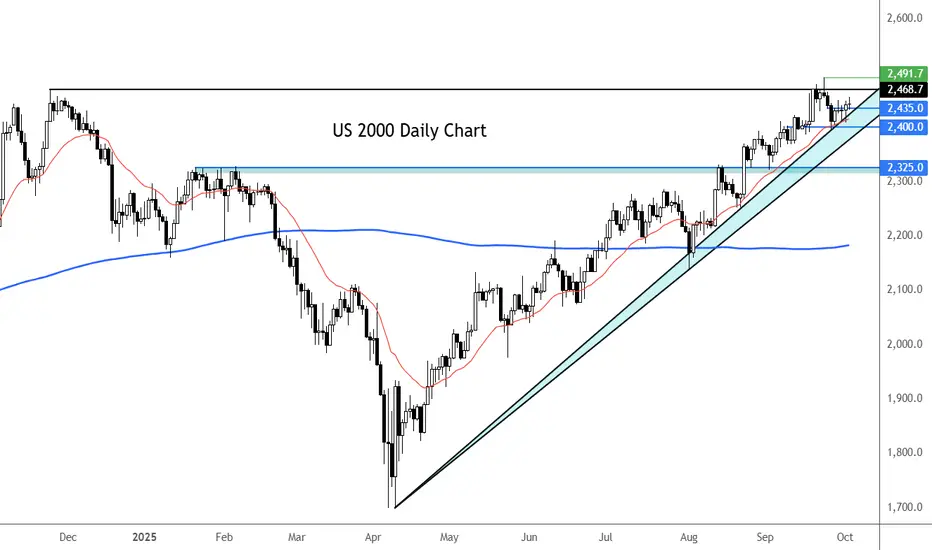

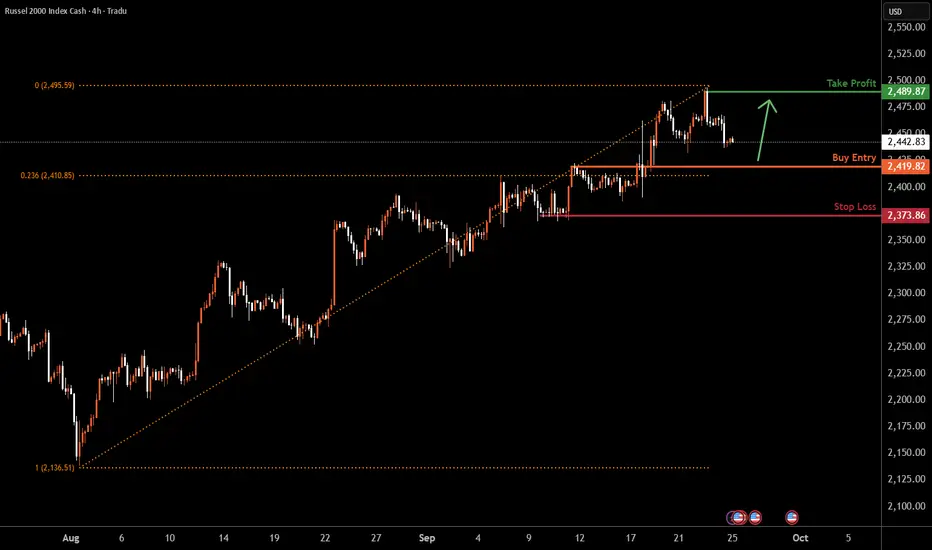
US2000 H4 | Continuation of bullish momentumBased on the H4 chart analysis, we could see the price fall to the buy entry at 2,419.82, which is a pullback support that is slightly above the 23.6% Fibonacci retracement and could bounce from this level to our take profit.
Stop loss is at 2,373.86, which is a pullback support.
Take profit is at
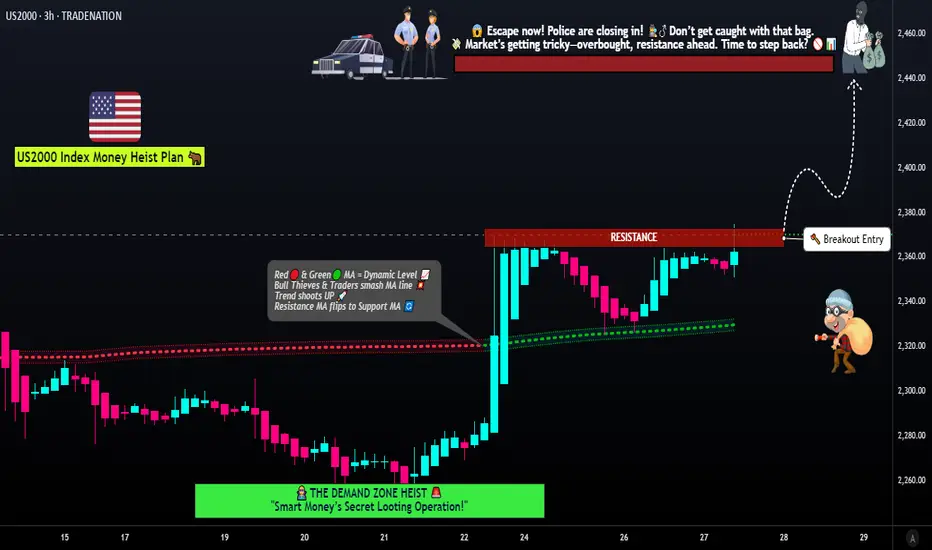
US2000 Bullish Breakout Strategy! Layer Entries and Escape Plan🚨💰 US2000 / RUSSELL2000 Index Market Robbery Plan 🏦💸 (Swing/Scalping Trade)
🌟Hi! Hola! Ola! Bonjour! Hallo! Marhaba!🌟
Dear Money Makers & Robbers, 🤑💰💸✈️
Based on 🔥 Thief Trading Strategy 🔥 here is our heist plan to rob the US2000 / RUSSELL2000 Index Bank Vault. Stick to the strategy outlined below
New Risks Require Policy Adjustment – Fed Rate Cut as ExpectedNew Risks Require Policy Adjustment – Fed Rate Cut as Expected
On September 17, at the conclusion of the FOMC meeting, the Fed lowered its policy rate by 25 bps, as expected, to a range of 4.0–4.25%. The decision was almost unanimous, with only one dissent: Stephen Miran, a new committee member app

See all ideas
Summarizing what the indicators are suggesting.
Oscillators
Neutral
SellBuy
Strong sellStrong buy
Strong sellSellNeutralBuyStrong buy
Oscillators
Neutral
SellBuy
Strong sellStrong buy
Strong sellSellNeutralBuyStrong buy
Summary
Neutral
SellBuy
Strong sellStrong buy
Strong sellSellNeutralBuyStrong buy
Summary
Neutral
SellBuy
Strong sellStrong buy
Strong sellSellNeutralBuyStrong buy
Summary
Neutral
SellBuy
Strong sellStrong buy
Strong sellSellNeutralBuyStrong buy
Moving Averages
Neutral
SellBuy
Strong sellStrong buy
Strong sellSellNeutralBuyStrong buy
Moving Averages
Neutral
SellBuy
Strong sellStrong buy
Strong sellSellNeutralBuyStrong buy
Displays a symbol's price movements over previous years to identify recurring trends.
Frequently Asked Questions
The current value of US Small Cap 2000 Index is 2,476.1776 USD — it has risen by 0.72% in the past 24 hours. Track the index more closely on the US Small Cap 2000 Index chart.
US Small Cap 2000 Index reached its highest quote on Oct 3, 2025 — 2,497.3647 USD. See more data on the US Small Cap 2000 Index chart.
The lowest ever quote of US Small Cap 2000 Index is 106.0700 USD. It was reached on Oct 28, 1987. See more data on the US Small Cap 2000 Index chart.
US Small Cap 2000 Index value has increased by 2.53% in the past week, since last month it has shown a 5.26% increase, and over the year it's increased by 13.49%. Keep track of all changes on the US Small Cap 2000 Index chart.
The top companies of US Small Cap 2000 Index are NASDAQ:CRDO, NASDAQ:SATS, and NYSE:IONQ — they can boast market cap of 24.89 B USD, 22.19 B USD, and 21.81 B USD accordingly.
The highest-priced instruments on US Small Cap 2000 Index are NYSE:GHC, NASDAQ:CVCO, and NASDAQ:WINA — they'll cost you 1,161.41 USD, 570.43 USD, and 512.35 USD accordingly.
The champion of US Small Cap 2000 Index is NASDAQ:RGTI — it's gained 5.24 K% over the year.
The weakest component of US Small Cap 2000 Index is NASDAQ:MCHB — it's lost −99.95% over the year.
US Small Cap 2000 Index is just a number that lets you track performance of the instruments comprising the index, so you can't invest in it directly. But you can buy US Small Cap 2000 Index futures or funds or invest in its components.
The US Small Cap 2000 Index is comprised of 1966 instruments including NASDAQ:CRDO, NASDAQ:SATS, NYSE:IONQ and others. See the full list of US Small Cap 2000 Index components to find more opportunities.