Russell 2000: Massive Breakout or Brutal Rejection?1) Technical Analysis
The Russell 2000 (RUT) has reached a major multi-year resistance zone at 2450–2550 — a level that rejected price repeatedly since 2021.
Key observations:
• A massive long-term Cup Pattern is visible, and the price is now at the top of the cup.
• Initial rejection is visibl
Related indices

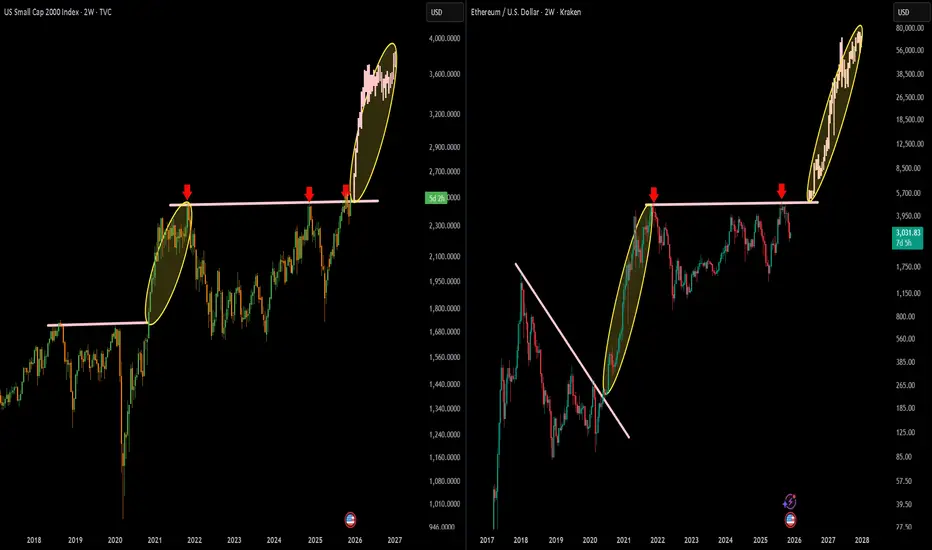
US Small Caps (Russell 2000) Vs Ethereum (ETH) CHART ANALYSIS & BIAS
I am comparing US Small Caps (Russell 2000) on the left with Ethereum (ETH) on the right.
Both charts show identical structural behavior:
A long multi-year accumulation / resistance zone
A clean breakout
A vertical markup phase immediately after reclaiming the key level
S
US2000 Momentum Rebuilds After Triangular MA Retest🚀 US2000 Bullish Setup – Triangular MA Pullback Play (Layered Entry Blueprint) 🚀
✨ Asset: US2000 – Small-Cap U.S. Index
📅 Trade Style: Day / Swing
🎯 Bias: Bullish Continuation confirmed through Triangular Moving Average Pullback
📌 Trade Plan – Clean & Clear
📈 Bullish Structure Confirmed
The price

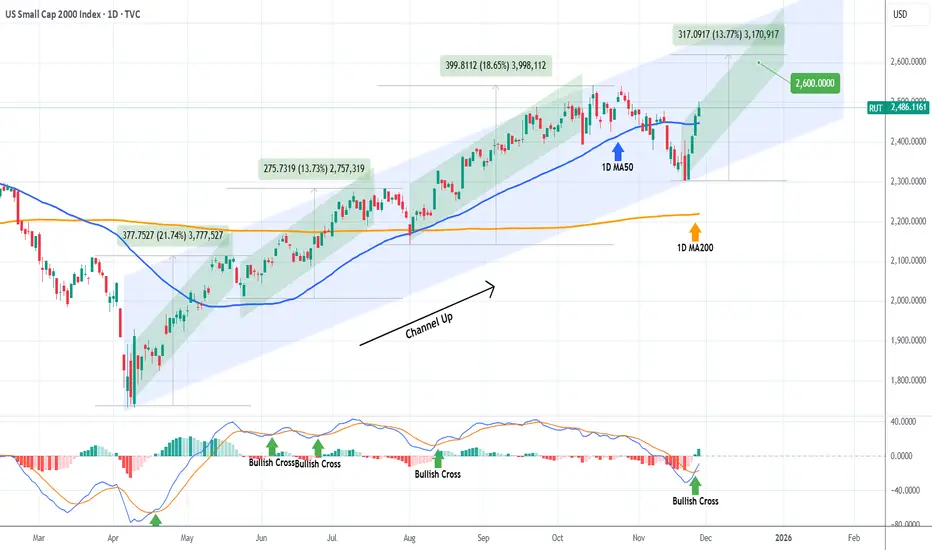
RUSSELL targeting 2600 on this Bullish Leg.Russell 2000 (RUT) has been trading within an 8-month Channel Up since the April 07 market bottom and following its latest correction (Bearish Leg), it recovered this week its 1D MA50 (blue trend-line), having already started the new Bullish Leg.
The minimum rise a Bullish Leg had within this patte
Russell 2000 will start outperforming NasdaqIMO the reversal is here for technology companies. Smaller companies will start outperforming Mega Caps. This will be because investors are looking for higher returns by taking more risk.
Smaller companies have a higher potential stock price appreciation but are more risky.
In 2000, this RUT/NASDA

R2Klooking at this chart I feel like too many threw in the towel too quick .
A little over 18 hours left for the weekly things seem very bullish.

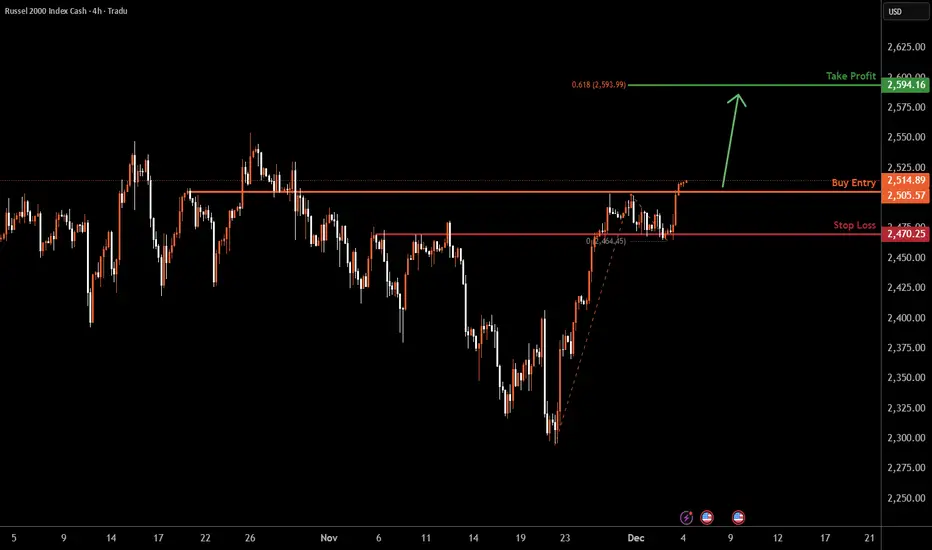
US2000 H4 | Bullish Momentum To ExtendMomentum: Bullish
Price has reacted well off the buy-entry level, which also aligns with an overlap support level.
Buy Entry: 2,513.55
Overlap support
Stop Loss: 2,470.25
Overlap support
Take Profit: 2,594.16
61.8% Fibonacci projection
High Risk Investment Warning
Stratos Markets Limited (trad
Russell 2000 >>>> NASDAQWill the RUT Russell 2000 start outperforming the Nasdaq?
Look at 2000. The market top was at the reversal point. Nasdaq crashed faster than small caps.

3 SESSION SETUP HORN WITH PARALEL CANAL INSIDE REVERSAL3 session horn with paralel canal inside patern in patern

Momentum Weak Despite Nvidia BoostShould small-cap U.S. equities be rallying because AI giant Nvidia just delivered another blowout earnings update? Sure, risk sentiment has improved, and continued AI investment comes with some immediate broader economic benefits, but the move still comes across as a little suspect, especially with
See all ideas
Summarizing what the indicators are suggesting.
Oscillators
Neutral
SellBuy
Strong sellStrong buy
Strong sellSellNeutralBuyStrong buy
Oscillators
Neutral
SellBuy
Strong sellStrong buy
Strong sellSellNeutralBuyStrong buy
Summary
Neutral
SellBuy
Strong sellStrong buy
Strong sellSellNeutralBuyStrong buy
Summary
Neutral
SellBuy
Strong sellStrong buy
Strong sellSellNeutralBuyStrong buy
Summary
Neutral
SellBuy
Strong sellStrong buy
Strong sellSellNeutralBuyStrong buy
Moving Averages
Neutral
SellBuy
Strong sellStrong buy
Strong sellSellNeutralBuyStrong buy
Moving Averages
Neutral
SellBuy
Strong sellStrong buy
Strong sellSellNeutralBuyStrong buy
Displays a symbol's price movements over previous years to identify recurring trends.
Frequently Asked Questions
The current value of US Small Cap 2000 Index is 2,520.9805 USD — it has fallen by −0.02% in the past 24 hours. Track the index more closely on the US Small Cap 2000 Index chart.
US Small Cap 2000 Index reached its highest quote on Oct 15, 2025 — 2,541.6657 USD. See more data on the US Small Cap 2000 Index chart.
The lowest ever quote of US Small Cap 2000 Index is 106.0700 USD. It was reached on Oct 28, 1987. See more data on the US Small Cap 2000 Index chart.
US Small Cap 2000 Index value has increased by 1.56% in the past week, since last month it has shown a 4.69% increase, and over the year it's increased by 4.69%. Keep track of all changes on the US Small Cap 2000 Index chart.
The top companies of US Small Cap 2000 Index are NASDAQ:CRDO, NYSE:BE, and NASDAQ:SATS — they can boast market cap of 32.32 B USD, 26.44 B USD, and 25.41 B USD accordingly.
The highest-priced instruments on US Small Cap 2000 Index are NYSE:GHC, NASDAQ:MDGL, and NASDAQ:CVCO — they'll cost you 1,074.79 USD, 568.57 USD, and 561.18 USD accordingly.
The champion of US Small Cap 2000 Index is NASDAQ:TOI — it's gained 1.54 K% over the year.
The weakest component of US Small Cap 2000 Index is NASDAQ:MCHB — it's lost −99.95% over the year.
US Small Cap 2000 Index is just a number that lets you track performance of the instruments comprising the index, so you can't invest in it directly. But you can buy US Small Cap 2000 Index futures or funds or invest in its components.
The US Small Cap 2000 Index is comprised of 1942 instruments including NASDAQ:CRDO, NYSE:BE, NASDAQ:SATS and others. See the full list of US Small Cap 2000 Index components to find more opportunities.