RVN/BTC Flag PatternHello, Flag pattern on 4h timeframe after highest volume for the last 3 months on daily timeframe. For me I have defined 2 scenarios on the graph. Many thanks, AskyRby Askhat_KulchiyevUpdated 227
Sideways moviment on RVN/BTCHello, traders! RVN is inside a big accumulation pattern after the price brokes down an important support level, this could be a bearish accumulation pattern or a sideways movement, and in a moment like these, we don't try to guess where the price is gonna go but react of it, so we will wait for a better confirmation, besides that we are in the middle of the pattern. Push the like button and follow us on TradingView. Rby MarketMinds1122
RVN BTCYou are responsible for your money - visit me on Twitter through my page on tradingview Find Telegram channel Daily deals Gold 5% Rby Farhan-Safah5
RVNBTCThis is my first call, with my new system, that I've been backtesting, successfully, over the last 6 months. Details and target on chart. Good luck to all. Not advice.RLongby Avery_UptonUpdated 121211
RVN/BTC GETTINH READY FOR A WAVE 3This is a trade idea to profit from this BTC impulsive wave that will lead to some alts bursting in the next days.RLongby jmydu8
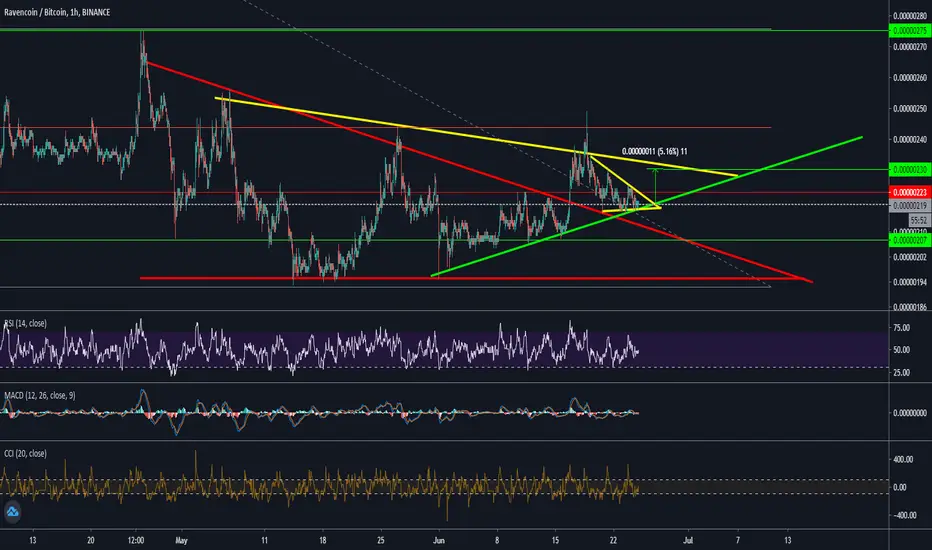
Ravencoin- RVN/BTC Long. Targeting double-Strong accumulation potential as volume profile at given levels is high. -Washed out to new lows and trending upwards since along with rsi (although neutral volume could indicate that this move may take some time) - Looking for a double around 350-400sat. -TD9 + 1 ,2 3, 4 sequence of candles after may suggest that the bottom is in. -Yellow is the buy zone and red is the target zone. Goodluck :) RLongby saw_labs10
RVN Structural S/R Flip| Pivot Point| .618 Fibonacci| RSI WedgeEvening Traders, Today’s Analysis – RENBTC – trading above structural level with Fibonacci confluence, RENBTC is likely to rise up validation of this level. Points to consider, - Structural S/R Flip (Retest) - Technical Confluence (Trade location) - RSI Falling Wedge pattern - Bull Impulses (PA validation) RENBTC is re-testing its structural S/R flip; further candle closes will solidify the level. This is a key support with technical confluence; market structure, key Fibonacci level (.618) and a Fibonacci Extension. This indicates a true trade location and a pivotal point on the chart The RSI is in a falling wedge pattern, breaking in either direction will dictate the overall trend. Stochastics are over extended, can stay trading here for an extended time, momentum is stored to the upside upon a valid buy cross. Overall, in my opinion, price action will dictate the overall trend, strong bull impulses will be a sign of a probable parabola. Validating support will be very bullish, RENBTC will likely rise to Fibonacci targets. What are your thoughts? Please leave a like and comment, And remember, “Dangers of watching every tick are twofold: overtrading and increased chances of prematurely liquidating good positions” – Jack Schwager RLongby The_Alchemist_Trader_99113
Pullback to shattered dynamic resistancePullback to shattered dynamic resistance. buying in these prices would be good.RLongby bitpulir2212
Watch the Raven soar!!This 3 day chart shows the strength the Raven has been showing. The recent volume shows the interest and it keeps rising. Stochastic RSI and RSI are both upward and have been screaming buy.RLongby WeAreSat0shi16
LONG RAVENBuy RavenCoin at 242 sat. Target 1: 274 sats Target 2: 320 sats We are breaking the daily resistance Ichimoku cloud. We are breaking the previous resistance level at 241. Rby Apollonosaure7
#RVNBTC $RVN #RVN BULLISH ROCKET WILL RISE TO THE MOON :)))Dear My friends RVN has got the action and you can see my all combinations on the drawing. Maybe it will be nice opportunity on this crypto cake Rby Crypto_GonzalesUpdated 8
$RVN, I think its time for this asset to start moving up$RVN I think its time for this asset to start moving up & catch up w/ the rest of the Alts... UCTS signaling a buy on the 2D & lower timeframes while volume has been increasing... ~225 sats could be a place to look for an entry on its way toward ~275/300/340... #RVNRby CryptoNTez27
Long term 2nd hf 2020 RVNBTC Next fibo key levels (from actuel tendance + historic resitance) 4.236 ( 636 ) (900) 3.618 (570) (797) 2.618 ( 465 ) ( 631 ) 1.618 (361) ( 464 ) 1.000 ( 296 ) (361) 0.786 ( 274 ) (326) 0.618 (257) ( 298 ) 0.500 (244) ( 278 ) 0.383 () (259) 0.236 () (234) stop-loss 195 RLongby Amrou_Updated 6
Bullish patternWe can see a confirmed bullish pattern. We have crossed trend resistance and now are on the way to test our horizontal resistance point. Signal was given FREE to our group check us out | VRLongby BigLava8
RVNBTC88% down from ATH 378 Days falling wedge break BTC dominance dumping lots of alts already 3x to 5x Sleeping from long time huge accumulation going on 270 Sat is key resistance if we break that targets are on chart. Make it Crow Team James RLongby saurabhdaware5513
RVN/BTC looks juicy :)Well we see RVN broke out of this massive falling wedge and now ranging above. We may see a significant move up very soon :) Leave a like and follow if you like my Charts :) Also some cool stuff following in next time, stay tuned!RLongby cr4kn4x16
RVN/BTC Ready for 31% in short Term#RVNBTC Short Term Update:- #RVN finally broke out Resistance level and we waiting for Re test. If price down around 220 Satoshi then i will buy more #RVN. Already we are in Good Profit. Re entry:- 220-225 Satoshi Target:- 295 Satoshi ( 31% ) Stop Loss:- No need After cross 300 Satoshi then Big Move. Please LIKe and Appreciate me for Latest crypto Updates. Must follow me for latest crypto Updates. Thank you. RLongby CryptoPatel3737110