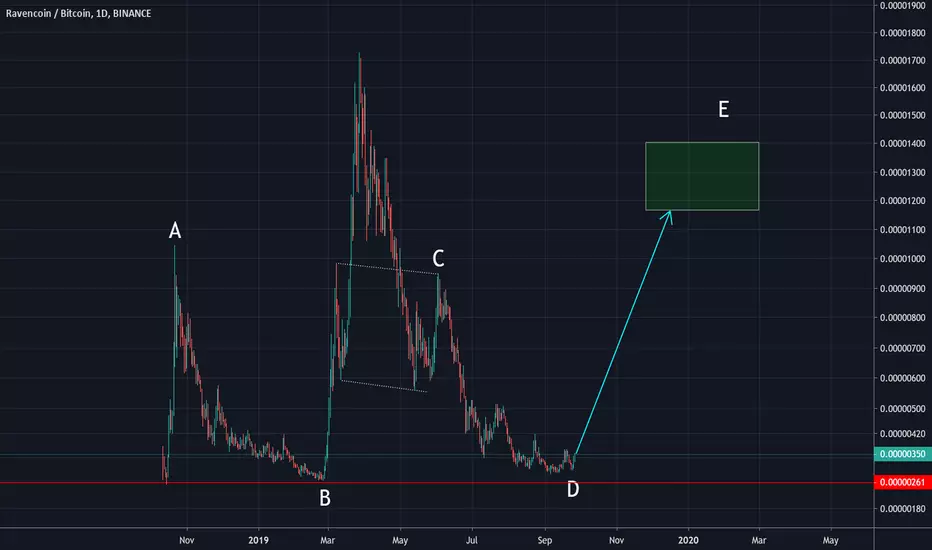
EW ScenarioPossible Count here expecting ABC correction for a Re-Entry Providing this is the top of this wave gl.
RVNBTC trade ideas

RAVEN Broke out from descending triangle pattern.Hello friends,
We are looking at RVN against the BITCOIN on the 4H or medium timeframe here.
It looks like we have broke out of a 4 month bottoming pattern right now, at the same time when Bitcoin also broke bullish.
This can get quite profitable as RVN has shown insane pumps in the past.
Right now lets aim for a modest 25% gain and from there on evaluate further.
Entry: 0.00000430 (about now)
Target: 0.00000550 (0.23 FIB Resistance)
Stop: 0.00000343 (Manual stoploss after a daily close)
Thanks and best regards, Thumbs up and subscribe for more.

RVNBTC Elliot waves and Fibsthis coin is bullish if this
RED EW : price touched resistance 0.382(442 sats )
we are having the 4th wave at the 385 area and also fibs 0.618
so wait for daily closing is small ew (blue) price doesn't hold than it come this place
BLUE EW :
near resistance and also come at support 394 sats at A wave
so entry below 400 is overall good for this coin
target is 5th wave
entry : below 400 , 385 - 395 good
sl : 375
target : 5 to 20%

RVN ready to launch for a 50% moveIt's not pumping like the majors yet, but this looks really nice for a bounce in the coming days.
The fact that it hasn't started the move up yet is why I entered.
Bullish divergences, shortening of the thrust, and slowing selling momentum all indicating a bounce is just around the corner.
Targeting 450 for a 50% move.


$RVNRVN will be listed in Binance USA. It may pump hard if BTC allows. RSI, MACD looks bullish on 1D. Perfect EMA alignment

RVN/BTC - Leading diagonal - Bullish ScenarioRVN/BTC - Leading diagonal - Bearish Bullish Scenario
For this graph, We use Elliott Impulse Wave (12345) with eclipse tools
Elliot wave correction and pitchfork tools + MaCD
On this graph, we saw perfect leading diagonal Bullish Scenario
Verdict:
We open risk, Good buy at 385-390 Satoshi
Stop loss at 380-375
first target 406-4016
The Diagonal. Leading diagonals “lead” a 5-wave pattern (or the first part of a zigzag) — hence they appear in the wave 1 position. Ending diagonals “end' a 5-wave pattern — hence, they appear in the wave 5 position (or tail-end of a C-wav
Remember TECHNICAL ANALYSIS is all about probabilities and based on previous market performance(not all about certainty)
Disclaimer: This is for educational purposes,it is not intended as a financial advice.
The analyst won't be responsible for a loss of fund. Trader should be able to manage risk.
#Trend Analysis
#Chart Patterns
#Wave Analysis
Support us on our facebook page: www.facebook.com
We accept any kind of donation please help our community
ETH: 0xbe761779a9063be8f9856424cd12d58bb8e25e06
Thanks a lot!

RVNBTC formed bullish BAT | A good long opportunityPriceline of Ravencoin / Bitcoin has formed a bullish BAT pattern and entered in potential reversal zone.
This PRZ area should be used as stop loss in case of complete candle stick closes below this zone.
Volume profile is showing less interest of traders at PRZ level but MACD is strong bearish and Stochastic is in bear cross so for secure trade we can wait for MACD to turn weak bearish or for stochastic to give bull cross then buy.
I have used Fibonacci sequence to set the targets:
Buy between: 0.00000384 to 0.00000381
Sell between: 0.00000390 to 0.00000400
Regards,
Atif Akbar (moon333)

Ravencoin/Bitcoin Repeating Falling Wedge.Ravencoin has a fairly predictable pattern of creating sharp falling wedge and then breaking out of them violently. There was even another one that is not reflected on this graph as it happened before the coin was added to Binance.
I don't have time for a very long analysis but as a long time miner and holder of RVN it seems from my experience we are due for a recovery. Mining RVN at an average electricity cost of $0.10/kWh nets you a pretty fat operating loss of -$0.11-14/day per GPU (1070-1080Ti) while competing coins like BTG and Beam on Nicehash or even ETH can net you $0.10-$0.25/day in profit after energy. Ravencoin holds a fairly large and fundamentally sound community with a pretty solid development team backing it. I know there are quite a few Ravencoin miners out there who are taking advantage of this low difficulty to scoop up and accumulate coins on the cheap for the eventual rebound. I know because I used to be one of them.
Before Bitcoin recovered in mid 2019 RVN had experienced a surge like many other alt-coins. I mined and held RVN on and off all through the fall and winter of 2018 into Spring of 2019. It went from the 200-300 range after breaking out of it's loOoOoOoOong falling wedge pattern up to peaks in the 1400-1600 satoshi range. I imagine now that bitcoin has reached a much higher level in terms of fiat we will see a similar pattern although at a smaller scale (less satoshis). My targets are split somewhere between the 0.236, 0.5, and 0.618 Fibonacci retracement levels.


RVN Swing$RVN broke above and retested the POC which has been an important level dating back to 2018. I'm liking the R/R here.

RVNBTC: A Quality Alt Ready to Move?Looking closely at the chart of Raven (RVNBTC), we some potentially bullish developments.
RVNBTC has broken out above it's 21-day moving average. It is also holding above the 21-DMA. The 21-DMA is a major moving average because it is usually a sign of the strength of a trend. Right now, RVNBTC is spending more time above its 21-day moving average than it has in quite some time.
We also see that RVNBTC has broken out from, and successfully retested, a large downward sloping wedge. Even though it's a bit counterintuitive, a downward sloping wedge at the bottom of a down move can be bullish. Here's the logic behind it: The downward sloping wedge represents bears continually trying to hold the market down. In this case, the wedge was likely created by non-stop capitulation in the alt market. Then, when the market pops up through the top of the wedge, as RVNBTC has, the market rallies sharply as bears who pressed it lower for a long time get squeezed out by a flood of new longs.
We also like what we see from the Parabolic SaR indicator. This indicator helps you know when a new trend is beginning or ending. It is shown on the graph as small dots. Currently, this indicator is flashing bullish, which increases our confidence.
Bottom Line : If RVNBTC can help in the tokenization of assets, it may have a future. The chart picture seems to have turned positive, making this an altcoin you can enter into a small long position.

RVNBTC forming a bullish Shark | A good long opportunityPriceline of Ravencoin / Bitcoin cryptocurrency is forming a bullish Shark and soon it will be entered in potential reversal zone.
This PRZ area should be used as stop loss point in case of complete candle stick closes below this zone.
I have used Fibonacci sequence to set the targets
Buy between: 0.00000357 to 0.00000353
Sell between: 0.00000363 to 0.00000374
Regards,
Atif Akbar (moon333)


RVN bullisher than bullish in weeklychartIs RVN ready for the 1.618 Fibo ?
and is the hard forke the catalyst?
Buy and enjoy

RVN looking PRIMED for a PUMP [RVN/BTC]Ravencoin looking ready for a nice move!
Falling wedge and horizontal support level is exactly want to see to snag a buy, also a trendline supporting the idea.
These opportunities can create 50+% chances- it is important to get in and out for the move, as generally the chart is still in an overall downtrend.
To re-cap
-Wedge
-Support level
-Trendline
-Fractal Structure
If you want to see join our discord for more trade ideas and free scripts... check our signature below!!

Ravencoin about to EXPLODE$RVN looks juicy here. Got a good entry. First major resistance 414 sats. I think it blows past that easily.

RVNBTC Broken TriangleBuy over triangle, target price height of triangle.
Buy : 0.00000362
TP : 0.00000444
Stop Loss : 0.00000350